
Key Takeaways
To address lingering pressures in the aftermath of the pandemic, California public schools received record funding, largely bolstered by nearly $60 billion in federal and state one-time stimulus funds. Our comprehensive look at the allocation and uses of these federal and state educational recovery funds reveals several key findings:
- Learning losses were significant and occurred across districts and students in all demographic groups. In 2022, test scores were back at or below 2016 levels in nearly all grades after several years of growth pre-pandemic. Compared to 2019, proficiency fell more sharply in math (7 percentage points) than in ELA (4 percentage points). →
- Districts with the highest shares of low-income and high-need students received the greatest influx of new funding. Funding allocations were also higher for districts with lower test scores. However, because learning losses were large in most districts, the relationship between learning losses and funding is weaker. →
- Over time, the focus of spending shifted from health and technology to learning recovery. Early expenditures targeted technology and health/safety needs, while more recent spending has shifted towards extended learning time, interventions to accelerate student progress, and mental/social-emotional health supports. →
- One-time spending sparked potentially innovative education practices. Case-studies of individual districts highlight how funding from federal and state agencies aided in the return to in-person teaching and ramped up efforts that may lift student learning and well-being. →
The unprecedented level of funding from federal and state sources helped schools stay open and implement programs to help students recover. With more effective outreach and technical assistance, districts can implement evidence-based strategies, streamline funding sources, and better target distribution of funds in the future.
For their part, policymakers will need to avoid further complicating and constraining district choices—especially as federal stimulus funds expire—as well as balance whether to target future funding to address pandemic-induced losses or longstanding gaps. Leveraging funds to create lasting changes will be key to delivering on the promise of an effective and equitable educational recovery.
Introduction
Prior to the onset of COVID-19, many students were not meeting state standards in English or math, with high-need student groups (i.e., low-income, English Learners (ELs), foster/homeless youth) and students of color often farthest below these standards. Nearly all analyses of student outcomes during the pandemic and the first year of pandemic recovery indicate that the percentage of students meeting state standards has fallen, gaps among student groups have increased, and student mental health has declined.
As of June 2023, $60 billion in one-time funding will have been allocated towards education recovery for prekindergarten through 12th grade, roughly evenly divided between federal (47%, or $28.4 billion) and state (53%, or $32.0 billion) sources. This is a substantial investment relative to earlier education spending levels: in 2018–19, the year before the pandemic, the sum of all local, state, and federal dollars totaled $101.7 billion.
Funding for recovery has largely been allocated to districts based on their shares of low-income students, which is a proxy for student need and is the main way the state’s school funding formula (Local Control Funding Formula, or LCFF) directs funds towards high-need districts and students. However, this allocation does not necessarily mirror student need as measured by learning loss—instead, funding is distributed to places with lower achievement levels. Nor does it ensure that spending is directed to the most productive uses for student recovery.
This report studies how recovery funding targets student need—defined in a number of ways—as well as if districts’ spending decisions will promote sustained recovery even after federal and state recovery funding ends. The report also examines how the influx of funding may be providing enterprising districts with opportunities to capitalize on innovations that began during the pandemic.
We provide the first comprehensive statewide look at funding allocations and spending decisions for both federal and state stimulus programs. Over the coming years, educational recovery from the disruptions of the COVID-19 pandemic will require sustained investments in effective learning strategies. The quantitative and qualitative analyses in this report provide new insights for California policymakers and set the stage for our continued work to examine the ongoing stimulus spending and its association with improved student outcomes.
The Recovery Context in California
To understand how recovery efforts were unfolding and if recovery included innovation—especially novel practices to address systemic inequities—we conducted case studies in three California school districts (Milpitas, Lindsay, and SoCal, an anonymized district). We held three rounds of interviews over 16 months, interviewing district leaders, school principals, and teacher leaders. Our case studies appear as text boxes throughout this report that provide insights into how districts emerged from this unprecedented era.
Many California schools cautiously attempted to reopen, then suffered from recurring shutdowns, bouts of illness among students and teachers, and death inside many families. We met many educators who reopened their classrooms under dreadful and uncertain conditions. Still, by fall 2021 district leaders were redoubling efforts to stay open, buoyed by rising vaccination rates in California. Most students returned to in-person classrooms during the 2021–22 year in and around periodic closures and quarantines.
Conditions did evolve in two promising ways. First, unprecedented levels of federal and state aid began flowing to local districts in 2020, resulting in increased per pupil funding levels for each of our case study districts, whose per pupil funding ranged from approximately $13,000 to $24,000 (see Technical Appendix Figure E1).
Second, COVID-19 necessitated adaptation and innovation. Educators pursued novel teaching practices during remote instruction, better organizing instruction with digital technologies, and arranging more time in small groups to serve children with high needs or with disabilities. Teachers and principals told us they have built stronger relationships with parents, sharing online tools to clarify weekly assignments, build trust, and promote careful monitoring of homework.
The Need for Learning Recovery in California
In the wake of the COVID-19 pandemic, the National Assessment of Educational Progress (NAEP) revealed a sharp drop in reading and math scores for fourth and eighth graders at the national level. California fourth and eighth graders experienced similar losses in math; however, reading proficiency remained statistically the same as before the pandemic (National Center for Education Statistics 2022).
Math was a tougher subject for students during the pandemic, although younger grades showed steep declines in the reading portion of California’s Smarter Balanced Assessment Consortium (SBAC) tests. Elementary students may be regaining the ground they lost at a faster pace than older students, but K–12 students are still years away from a full recovery. Meanwhile, students in middle school either made slower progress recovering from learning loss or remained stagnant (Tadayon 2022).
The losses were larger in higher-poverty schools than in lower-poverty schools as the pandemic worsened an already inequitable system for under-resourced populations (Kuhfield, Soland, Lewis, and Morton 2022; Jones and Willis 2022).
Whether or not schools’ reopening status impacted test scores is also unclear (Starr, Prunty, Herrera, and Ugo 2022). Generally, within states, achievement losses were larger in districts that spent more time in remote instruction during 2020–21 (Fahle et al. 2022). However, the relationship between school closures and achievement is not perfect; other factors may have contributed to the disparate impacts of the pandemic, such as socioeconomic conditions, COVID-19 infection and death rates, unemployment and economic factors, and broadband access (Fahle et al. 2022). For example, California remained in remote instruction for much longer than other states—yet losses in reading proficiency were smaller and losses in math proficiency were similar to states that moved to in-person instruction earlier, like Florida and Texas (National Center for Education Statistics 2022).
Losses in English and Math Proficiency Are Significant
California school children are less likely to be proficient in English Language Arts (ELA) and math than they were before the pandemic, with levels of proficiency not seen since 2016 (Figure 1). Compared to 2019, proficiency fell more sharply in math (7 percentage points) than in ELA (4 percentage points). Below, we examine the need for recovery by grade level, demographic group, and district type.
Proficiency levels in 2022 reverted to 2016 levels in ELA and 2015 levels in math

SOURCE: Smarter Balanced Assessments (SBAC), California Department of Education, 2022.
NOTE: The SBAC was not administered in 2020 and we exclude 2021 because the SBAC was optional.
Average test scores fell below 2016 levels in nearly all grades
Historically, student scores on state standardized tests generally have improved each year for each grade level. To truly understand test score declines associated with the pandemic, we need to measure them relative to the expected improvement. Using test score data from 2015–2019, we project 2022 test scores, and compare those projections to actual 2022 scores.
For ELA, 2022 scores in all grades fell short of what we would have expected had the positive trends from 2015–19 continued (Figure 2 and Figure 3). In lower grades, 2022 test scores fell back to levels not seen since 2015 or 2016.
2022 ELA test scores by grade dropped below the trends established in 2015–2019

SOURCE: Smarter Balanced Assessments, California Department of Education, 2022.
NOTES: The SBAC was not administered in 2020 and was optional in 2021. Solid lines depict linear trend in achievement, by grade, estimated using pre-pandemic data (2015–2019). Those dates are used to project 2022 achievement and are depicted with dashed lines. The dot in 2022 is the observed mean scale score.
For math, the losses are much more severe (Figure 3). For example, 2022 scores in each grade typically fell below the lowest mean test score since Smarter Balanced (SBAC) testing began in 2015.
2022 math test scores by grade dropped well below the trends established in 2015–2019

SOURCE: Smarter Balanced Assessments, California Department of Education, 2022.
NOTES: The SBAC was not administered in 2020 and was optional in 2021. Solid lines depict linear trend in achievement, by grade, estimated using pre-pandemic data (2015–2019). Those dates are used to project 2022 achievement and are depicted with dashed lines. The dot in 2022 is the observed mean scale score.
Older students experienced greater grade-level loss
To understand learning recovery needs in terms of years of learning, we transform mean test scores from 2022 into grade equivalents based on 2019 grades and test scores. For example, if 2022 grade 6 students scored at a grade 5.5 equivalent, it signals that students were about 0.5 of a year behind where grade 6 students were in 2019.
In 2022, ELA scores were generally 0.2 to 0.6 grades behind 2019 (Table 1). Learning loss in math in 2022 was far greater, especially in grades 8 and 11. The most alarming result is for 11th graders, who performed at 2.4 grade levels below where 11th graders did before the pandemic. (See Technical Appendix A for details on how we estimated learning loss in 2019 grade equivalents and related figures.)
Losses occurred across demographic groups
Among demographic groups, both low- and non-low income students saw losses of under one grade in ELA. Again, losses were much larger in math, especially in the upper grades—and non-low income students in the 11th grade lost larger grade equivalents than low-income students (see Table 1).
All racial/ethnic groups saw major losses in math—typically one-quarter to a full grade equivalent loss in elementary school, but more than one grade equivalent loss in middle and high school. Asian and Filipino students experienced the smallest losses in math, while Latino students, Black students, white students, and students in the “other” group experienced the largest losses.
2022 grade level losses were dramatic in math

SOURCE: Smarter Balanced Assessments, California Department of Education, 2022.
NOTES: Cells display amount of grade level loss by grade level and demographic group. The losses are estimated relative to average test scores for the given group and grade in 2019. See Technical Appendix A for detail. Low-income refers to students who qualify for free or reduced priced meals.
For ELA, most demographic groups dropped between one-quarter and three-quarters of a grade equivalent in each grade. The notable exceptions were Asian and Filipino students, who in some middle and high school grades rose above the test scores observed for the same group in 2019. (For ELA see Appendix Table A1.)
Proficiency fell most for districts with the most EL, Latino students
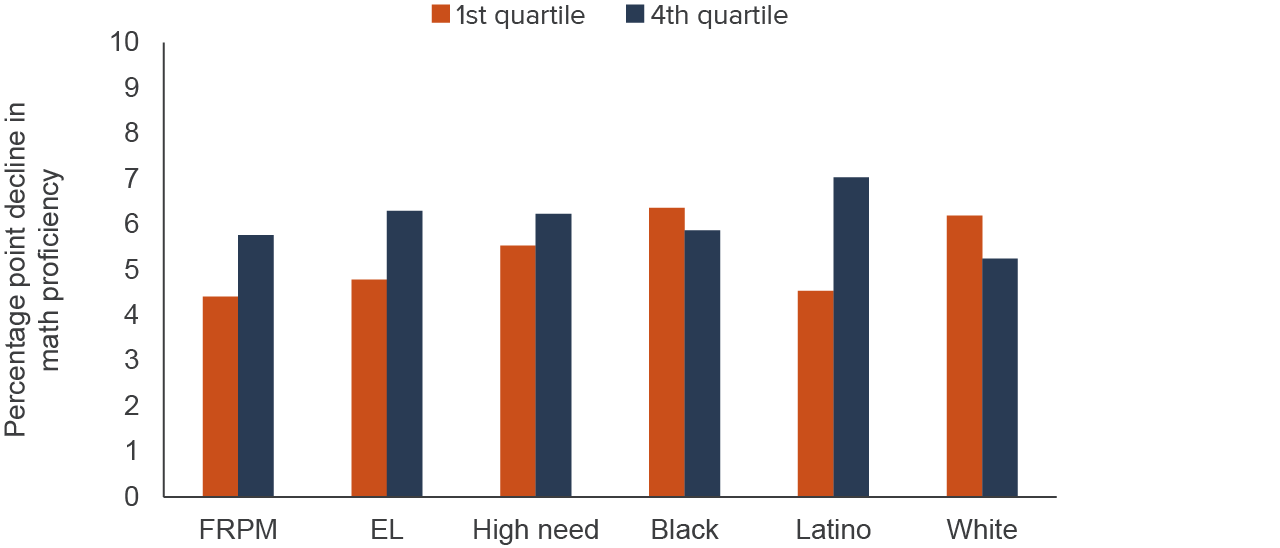
Because funding for recovery is directed to districts, not to demographic groups, we return to comparing student proficiency—this time by district characteristics. In districts with high shares of Latino students, math proficiency fell by 7.1 percentage points, while in those with lower shares, math fell by 4.4 percentage points (Figure 4). Proficiency also fell notably in districts with higher shares of English Learner students and high-need students.
Districts with high shares of Latino students saw the largest drop in math proficiency
SOURCE: Smarter Balanced Assessments, California Department of Education, 2022.
NOTE: Decline in proficiency by percentage points is calculated between 2018–2019 and 2021–22 scores: FRPM refers to Free and Reduced Price Meals, EL is short for English Learner, and High Need refers to the share of students that are EL, FRPM-eligible, or homeless/foster youth.
For ELA, proficiency dropped approximately 4.5 percentage points in districts with higher shares of Latino students compared to 3.9 percentage points in districts with lower shares. However, districts with high shares of white students had the largest drop in ELA proficiency (4.7 percentage points)—but these districts had the highest rate of ELA proficiency both before and after the pandemic—in 2019 and in 2022 (55.4% and 50.6%, respectively). Additionally, regarding urbanicity, school districts located in towns experienced the greatest decline in both math and ELA (4.9 percentage points and 6.4 percentage points, respectively).
Targeting Federal Dollars for Student Recovery
As part of a larger response to combat the COVID-19 pandemic across the country, the federal government distributed billions of dollars through several stimulus packages to California. Much of this federal funding was geared towards helping California’s K–12 education system adapt to a new learning format and mitigating the harm on students’ quality of education.
The first federal and state grants to support education during the pandemic began in March 2020. In the list below, the vast majority of the funds are allocated based on some measure of student need (e.g., Title I, LCFF, counts of homeless students). And not all descriptions suggest a COVID-19 recovery purpose. For example, the Arts, Music, and Instructional Materials Block Grant can be used to support COVID-19 recovery, despite its description. Below, we describe several federal and state programs that we examine in this report.
- The Coronavirus Relief Funds (CRF) provided money to districts to mitigate the impact of school closures ($4.4 billion).
- The Elementary and Secondary School Emergency Relief Fund (ESSER I) came as part of the CARES Act ($1.6 billion). Some funding from the CARES act gave direct aid to school districts and was partially allocated based on Title 1.
- The Governor’s Emergency Education Relief Fund (GEER I) provided direct aid to districts but was allocated based on the governor’s discretion ($355 million).
- GEER II ($341 million) and ESSER II ($6.7 billion) were allocated using the same method as the original packages.
- ESSER III ($15 billion), part of the American Rescue Plan (ARP) Act, focused funding on learning recovery. To receive ESSER III funding, districts were required to submit an expenditure plan outlining how they would use the funds before receiving them.
- The state’s Expanded Learning Opportunity Grant (ELO-G, $4.6 billion from September 2020 to September 2024) provided funding for learning recovery, and was allocated based on counts of homeless students, ADA, and the LCFF formula. Districts were required to develop plans to receive the funds.
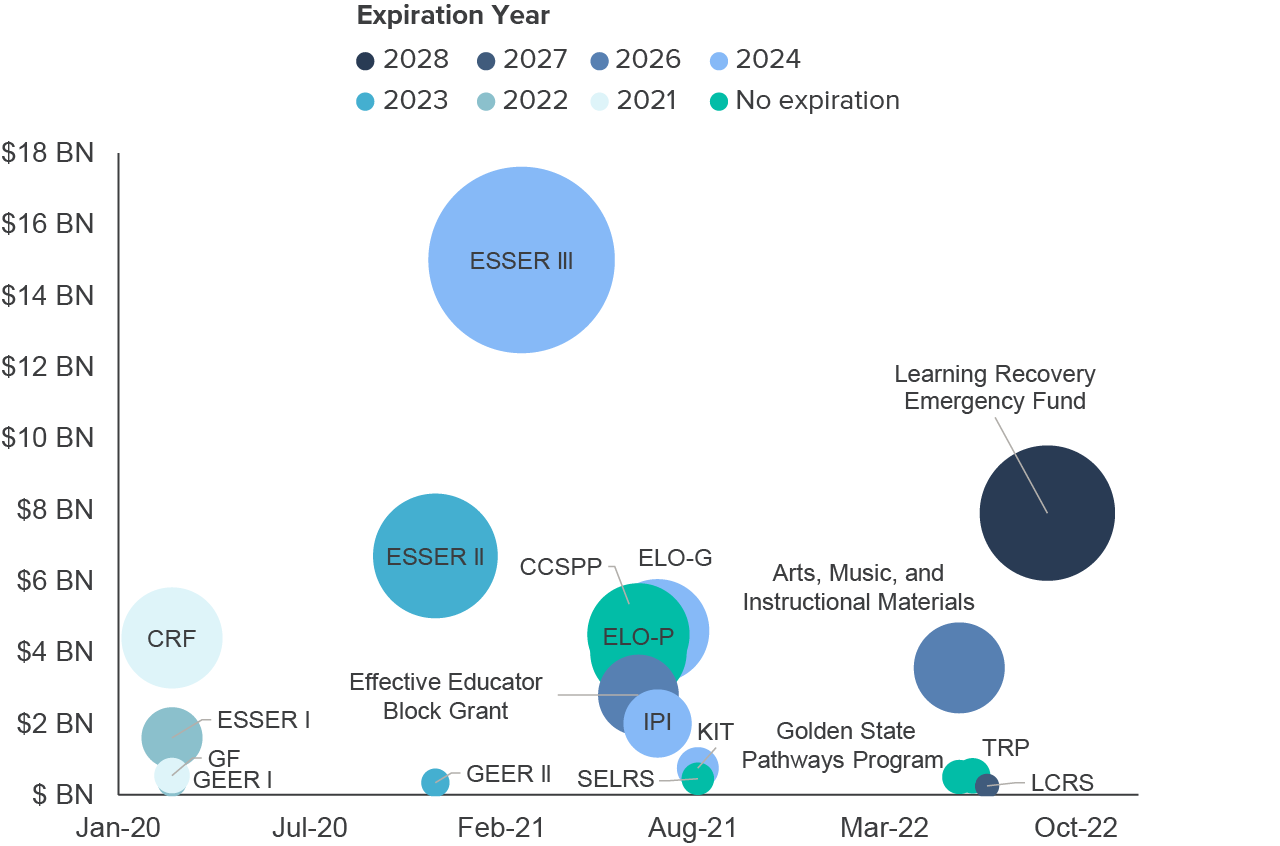
Figure 5 illustrates the source, size, and starting date of funding sources directed towards education recovery. Technical Appendix Table B1 describes the intended purpose, amount, spending period, and allocation method of these funds.
Major funding for education recovery came from federal and state sources
Major stimulus from the past two years
SOURCE: California Department of Education; authors’ calculations.
NOTE: Excludes programs under $250 million. Because the Learning Loss Mitigation Fund includes CRF, GEER I, and General Fund dollars it is not reported separately here.
How Much Funding Did Districts Get and How Did They Allocate It?
Between each of the stimulus packages, the federal government distributed $28.4 billion in one-time allocations to California. Of that total, we have a detailed accounting for $26.7 billion (94%) of this funding via quarterly expenditure reports from the California Department of Education. This report includes expenditures through the end of March 2023; as we discuss below, nearly two-thirds of the allocated funding has been spent.
Most of these stimulus dollars were distributed from the state to districts and schools via their Title 1 allocations, providing greater allocations to districts serving larger populations of low-income students. But this was not always the case. Notably, some state programs—including ELO-G and Learning Loss Mitigation Fund (LLMF)—included both state and federal dollars and were not distributed using Title 1 allocations. Roughly 45 percent of ELO-G funding was from federal sources, and the allocations were proportional to the share of high-need students as defined by the state’s funding formula (low-income, English Learner, and foster youth).
For the LLMF—which includes federal funds from GEER I, CRF, and the state’s General Fund (GF)—the state distributed funds to districts via multiple mechanisms:
- A portion of CRF funding and of GEER I were allocated to districts based on the number of students between the ages of 3 and 22 in special education courses.
- Another portion of CRF was allocated based on the proportion of supplemental and concentration funding allocations via the LCFF.
- GF dollars and the last portion of CRF were distributed to districts based on the proportion of statewide LCFF entitlement.
- Finally, roughly half of GEER II funds were allocated in the same manner as GEER I, with the remaining portion allocated through the Emergency Assistance to Non-public Schools (EANS) program.
Districts can use stimulus funding in a myriad of ways including addressing learning loss, purchasing education technology, and investing in mental health services for students and staff. Specific spending requirements vary from program to program.
Total funding across programs reflects districts’ low-income student shares
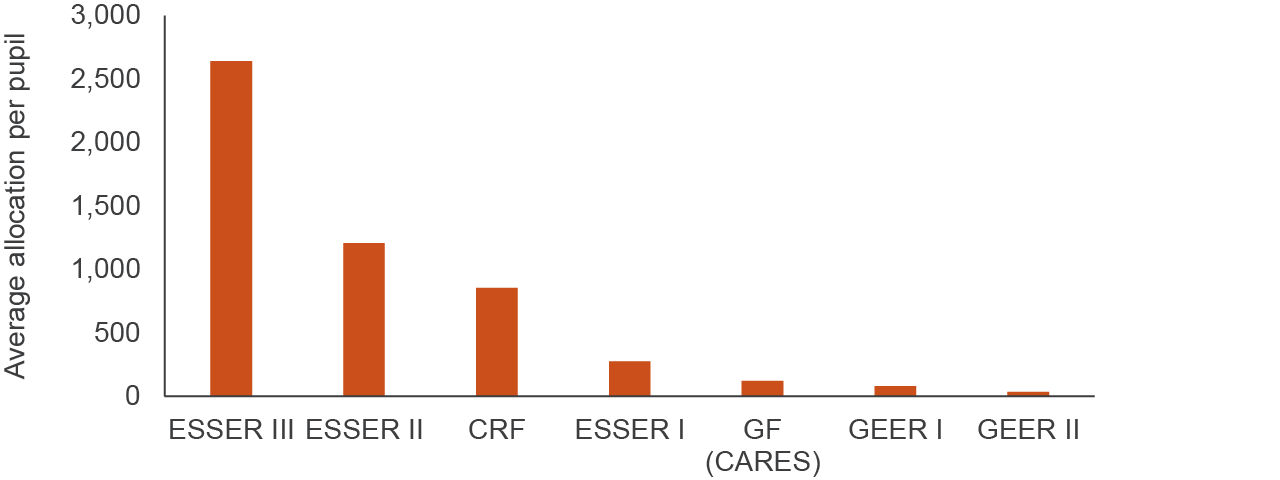
On average, California districts received the following amounts per student in state and federal funding (Figure 6):
- $276 per student from the ESSER I fund ($1.6 billion total);
- $1,207 per student from the ESSER II fund ($6.7 billion total);
- $2,642 per student from the ESSER III fund ($15 billion total) on average; and
- $854 per pupil from CRF.
The other stimulus funds provided less than $100 per pupil on average to districts in California.
Importantly, the average total allocation per pupil varied widely across districts. Districts in the 10th percentile—the bottom 10 percent of districts in terms of stimulus funding—received $1,107 per student, while districts in the 90th percentile received $8,155, or approximately seven times more funding per pupil. Districts in the 90th percentile also received over twice as much funding per pupil than the median district ($3,488).
A large portion of federal funding stems from ESSER III
SOURCES: Quarterly Expenditure Reports; California Department of Education; authors’ calculations.
NOTES: Figure displays the average allocation per pupil to districts by each stimulus fund. Enrollment data is from the 2021–22 school year. Charter schools that report expenditures independently from a district’s general fund are excluded.
Figure 7 reports the average amount of stimulus funds allocated by quartile and district characteristics. As expected, a high correlation exists between the average allocation per pupil and the share of high-need students a district serves. Federal stimulus funding was targeted to districts based on Title 1 funding, which is tied to the size of districts’ low-income student population and is correlated with a district’s high-need student share.
The fourth quartile—or districts serving the largest share of high-need students—received roughly four times the funding per pupil as a district in the first quartile. Schools with high shares of Latino students, or students of color more generally, also tend to serve larger populations of high-need students than schools with large shares of white students. District size also relates somewhat to allocations, with the smallest districts receiving larger funding amounts per pupil.
The state and federal governments allocated greater funding to districts with higher shares of high-need and Latino students
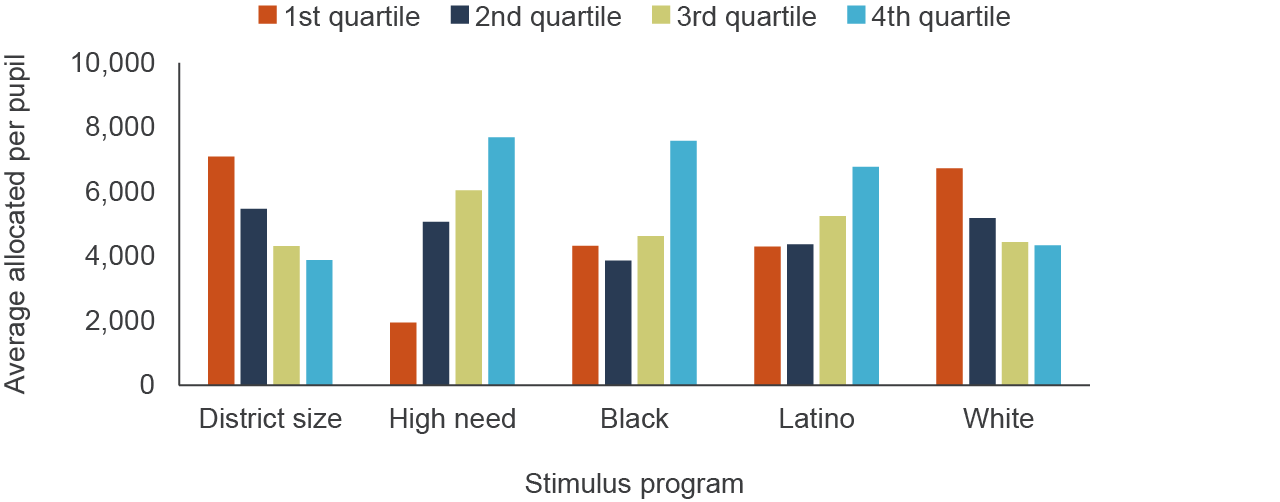
SOURCES: Quarterly Expenditure Reports; California Department of Education; authors’ calculations.
NOTES: The figure displays the average total allocation per pupil for different district characteristics by quartile of that characteristic. Each quartile consists of 25 percent of districts. Quartiles are ordered from smallest (first) to largest (fourth). See Technical Appendix Figure C5 for analogous version weighted by student enrollment. Demographic and enrollment data is from the 2021–22 school year. Charter schools that report expenditures independently from a district’s general fund are excluded.
More funding went to districts with lower achievement—but not always greater learning loss
The billions of dollars California public schools received in federal stimulus can be thought as having two primary purposes:
(1) to aid in the return to normal school operations, and
(2) to help accelerate student academic and social-emotional recovery after disruptions that contributed to learning losses and mental health challenges.
However, the extent of learning losses was not known when the state made decisions for allocating stimulus funds. Instead, most early funds went to districts based on either the federal Title 1 formula or California’s LCFF, both of which target districts with higher shares of low-income students—who also tend to have lower test scores.
These federal relief packages are therefore better structured to reach schools with lower achievement levels and address underlying achievement gaps rather than reach schools that showed the largest learning losses on the SBAC between 2019 and 2022.
Overall, the relationship between funding and learning loss is weak (Technical Appendix Figures C2–C4), reflecting the fact that many other factors also influenced learning losses, which were felt almost universally across California’s districts. For example, the average district at the 75th percentile, or the higher range of learning loss in math (-9 percentage points), received about $425 more per pupil in stimulus funding—to be spent over nearly four years—compared to a district at the 25th percentile, or the lower range in learning loss (-2.5 percentage points).
However, when we consider test score levels, we find a much stronger relationship with allocated funding (Technical Appendix Figures C2–C4). In 2022, the state directed more stimulus funding to districts with the lowest performance on the SBAC. On average, a district where 20 percent of students scored at grade level in math in 2022 received nearly $4,000 more per student than a district where 60 percent of students scored at or above grade level.
This result is in part a byproduct of the design; as detailed earlier, test scores fell across all student groups, especially in math. And although losses were larger in the highest-need than in the lowest-need districts (Figure 4, earlier), the difference was small. In other words, because losses were so large and common across districts, and funding allocations were based on district demographics before we understood the degree of learning losses, there is no strong systematic relationship between how much funding a district received and how large its learning losses were.
Understanding these relationships will be important for policymakers going forward. Most notably, funds have been distributed in ways that may help address pre-existing achievement gaps: if the funding is used productively to improve learning and this translates into higher test scores, we should expect larger gains among the previously lowest-performing districts, which disproportionately enroll low-income, Black, Latino, and/or English Learner students.
In addition, while we do not attempt to assess the efficacy of funding directly in this report, the small correlation between funding and losses could be consistent with how early stimulus funds were spent. Moreover, early spending on technology to aid distance learning and health and safety measures to help safely reopen schools may have mitigated some extent of learning losses.
Moreover, because funding levels are not highly correlated with learning losses, we should be cautious when assessing the efficacy of stimulus funding and learning recovery programs by examining the share of districts that have “recovered” to prior test score levels. These relationships can inform expectations about where recovery may occur fastest if the dollars prove effective. More generally, whether the state should target funding to alleviate pandemic-induced gaps or longstanding gaps is a key ongoing question for policymakers.
District Spending Reflects Funding Expiration Dates
To date, approximately 63 percent of all stimulus funding has been spent (Figure 8). Because districts received their first funding allocation in fall 2020, they began utilizing funding to combat difficulties that the COVID-19 pandemic was causing in the K–12 system.
- Districts spent 18 percent of allocated federal stimulus funding in the 2020–21 school year.
- Districts spent 22 percent of allocated funding in the 2021–22 school year, an increase of approximately $1 billion dollars.
- Another 23 percent was spent in the 2022–23 school year (through March 2023).
Approximately 63 percent of total allocated stimulus funding has been spent by the first half of 2023
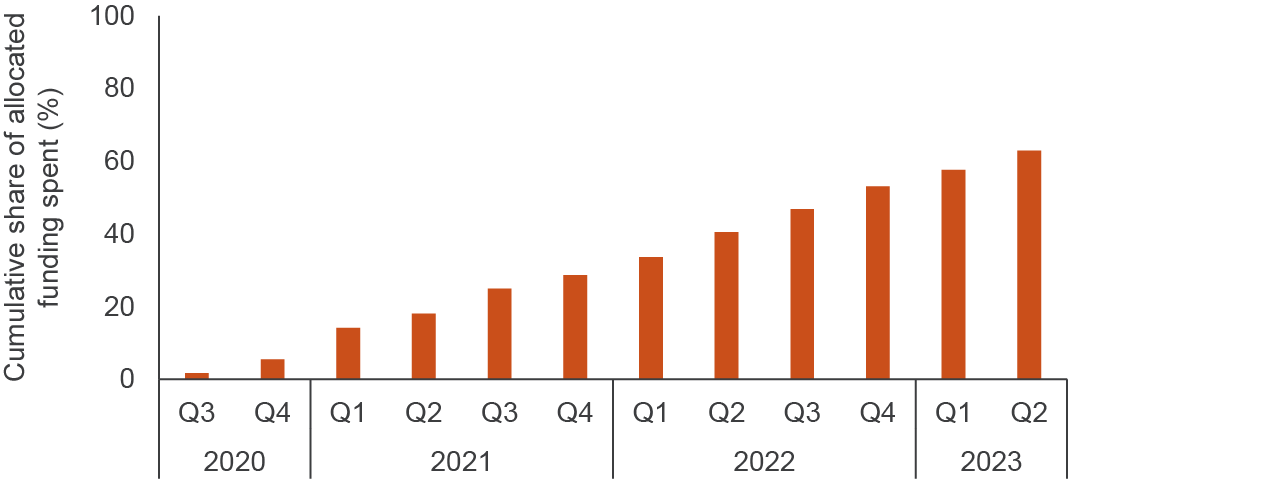
SOURCES: Quarterly Expenditure Reports; California Department of Education; authors’ calculations.
NOTE: Figure displays the total share of stimulus funding spent by quarter of the calendar (not fiscal) year from Q3 2020 through Q2 2023. Charter schools that report expenditures independently from a district’s general fund are excluded. Expenditure data as of March 31, 2023.
Each federal stimulus fund has a designated period (see Figure 7, earlier) in which districts must spend their allocated funding, or else they must return the remainder to the federal government. Districts are focusing on spending down funding from programs with the nearest expiration date (Figure 9).
- By the end of September 2022, funding from ESSER I and from programs in the Learning Loss Mitigation Fund (LLMF) (GEER I, GF (CARES), and CRF) must have been spent—districts have spent approximately 100 percent of this funding before its expiration date.
- By the end of September 2023, ESSER II and GEER II require funds to be spent—82 percent of funding for ESSER II and 56 percent for GEER II has been spent through March 2023.
- By the end of September 2024, ESSER III funds must be spent—districts have spent 42 percent of the total amount of these funds through March 2023.
Share of allocated funding spent per pupil by stimulus funding program
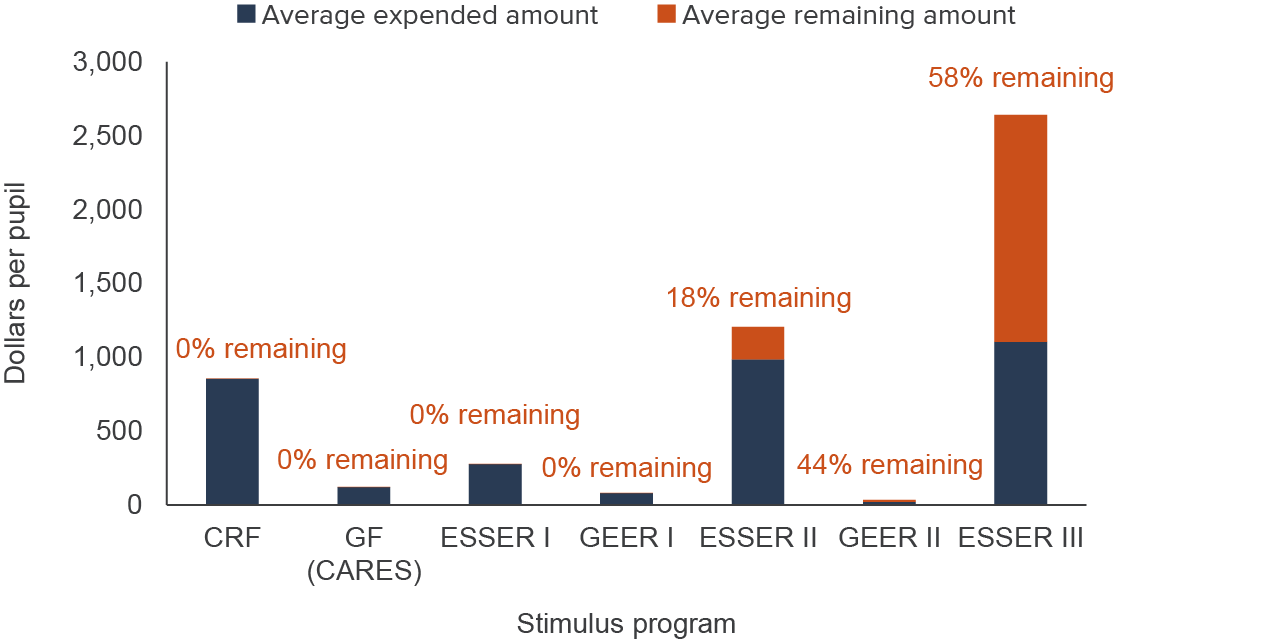
SOURCES: Quarterly Expenditure Reports; California Department of Education; authors’ calculations.
NOTES: Figure depicts the share of allocated funding spent per pupil by federal funding programs. The dark green portion represents the average amount a district has spent per pupil per program, while the lighter teal portion shows the remaining amount per pupil to be spent of allocated stimulus funding. Enrollment data is from the 2021–22 school year. Charter schools that report expenditures independently from a district’s general fund are excluded. Expenditure data as of March 31, 2023.
A deeper dive into the share of total funds spent reveals relationships between demographics and the share spent through March 2023 (Figure 10). Districts in the first quartile, with lower shares of high-need student populations or Latino student populations, have spent approximately 15 percent more of their allocated funding than districts in the fourth quartile.
The opposite relationship is true when we examine spending by share of white students; that is, districts with higher shares of white students have spent more of their funding. There is a weaker correlation between each quartile of districts based on district size and the proportion of Black students served.
These trends could be driven by the fact that districts serving higher populations of high-need students received more funding: funding may take longer to spend or be more difficult to spend quickly at a larger scale.
Districts with lower shares of high-need or Latino students, and higher shares of white students, have spent more of their funding

SOURCES: Quarterly Expenditure Reports; California Department of Education; authors’ calculations.
NOTES: The figure displays the share spent as of January 2023 for different district characteristics by quartile of that characteristic. Each quartile consists of 25 percent of districts. Quartiles are ordered from smallest (1st) to largest (4th). Demographic and enrollment data is from the 2021–22 school year. See Technical Appendix Figure C6 for analogous version weighted by enrollment. Charter schools that report expenditures independently from a district’s general fund are excluded. Expenditure data as of March 31, 2023.
Technology, health/safety, and learning loss were largest spending categories
Across all stimulus programs, there are 40 different categories for classifying the quarterly spending. These categories include summer learning enrichment, air quality inspection, instructional materials, mental health services, and community schools. To ease interpretation, we group these expenses into seven distinct categories:
- Health, safety, and nutrition: items to protect students and staff from contracting and spreading COVID-19 and enhancing the quality of student nutrition.
- Technology and materials: educational technology devices for students and teachers, as well as curriculum materials.
- Mental health and socio-emotional learning (SEL): mental health staff including school counselors, as well as expenditures related to socio-emotional learning training for staff and other general SEL resources for students.
- Additional time: summer programs, after-school programs, and other programs to increase instructional minutes.
- School resources and community schools: resources needed to address needs at specific schools; funding for full-service community schools.
- Academic interventions/learning loss: student interventions and programs to help students recover from lost instructional time throughout the pandemic.
- Other expenditures to maintain operations: other activities necessary to maintain normal school operations.
In the 2020–21 school year, districts spent roughly half of their funding on technology and school health and safety needs (Figure 11). The first year of the pandemic was an adjustment period for districts as they adapted to virtual instruction during a period of intense school closures. Spending on health, safety, and nutrition also made up a significant share of spending at that time; it remains a significant but smaller share of spending in 2022–23 (through March 2023).
At around $220 per student, the average spending on learning loss interventions was consistent in 2020–21 and 2021–22, but has surpassed that level in 2022–23, reaching roughly $310 per student through March 2023. If this pace continues, spending on learning loss will be notably higher than in prior years. Funding also increased heavily for SEL and mental health services: from roughly $17 per student in the average district in 2020–21 to $110 per student in 2022–23 (through March 2023).
Most spending went to health and technology early in the pandemic; relatively more spending went to learning loss and other interventions in the current school year
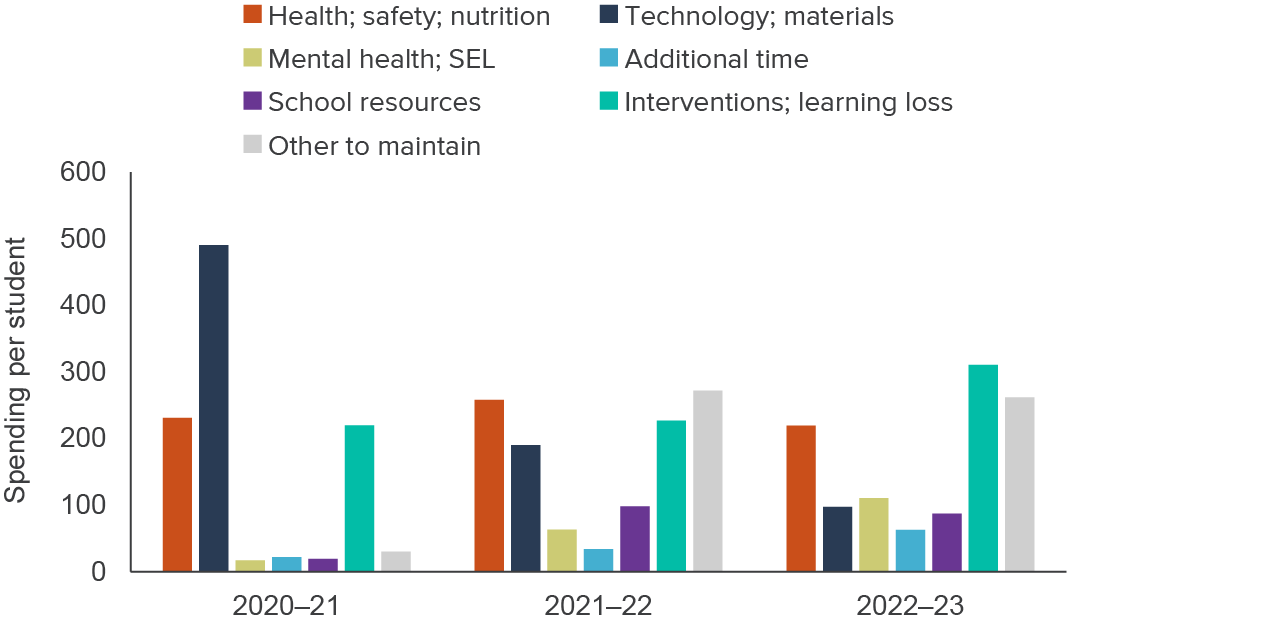
SOURCES: Quarterly Expenditure Reports; California Department of Education; authors’ calculations.
NOTES: Figure reports average spent per student across districts (unweighted). See Technical Appendix Table C1 for detail on aggregation of spending categories. Enrollment data is from the 2021–22 school year. Charter schools that report expenditures independently from a district’s general fund are excluded. Expenditure data as of March 31, 2023.
Over all years and stimulus programs, technology spending has been the largest category, accounting for roughly 23 percent of stimulus spending in the average district ($778 per student). Academic/learning loss interventions (22%; $757 per student) and health spending (21%; $709 per student) and) are the next-largest categories. Spending on additional time is the smallest category of spending (4%, $119). As we discuss in the following section, this spending is in contrast to districts’ ELO-G expenditure plans, for which extended learning time is a common strategy.
Notably, the fourth-largest category is “other spending necessary to maintain operations,” accounting for nearly 17 percent of spending ($564 per student). While “other” spending accounted for only 3 percent of spending in 2020–21, it now accounts for roughly 22 percent of spending in the most recent school year.
Strategies and Outcomes for State Spending
To address the impact of lost instructional time, California created the $4.6 billion Expanded Learning Opportunity Grant (ELO-G) in 2021. At the time of its passage, it was the largest learning recovery grant in the state’s history, with about 45 percent of funding from the federal government.
Grant allocations for ELO-G are proportional to funding allocated to districts under the state’s funding formula—which distributes extra funding for low-income, English Learner, and foster youth students—with the goal of prioritizing students disproportionately impacted by the pandemic. Districts can use these funds through September 30, 2024.
The California Department of Education (CDE) released general spending guidelines, but it is up to districts to implement plans that meet local needs. The CDE requires that districts use ELO-G funding to pursue some combination (but not necessarily all) of seven supplemental and support strategies:
- Strategy 1: Extending instructional learning time. This strategy may include increasing instructional days or minutes and may include providing seasonal programs in the summer, winter, or between standard academic terms.
- Strategy 2: Accelerating progress to close learning gaps. This approach includes tutoring or small group instruction, supplemental programs and materials to accelerate academic proficiency, and professional learning for educators.
- Strategy 3: Integrated pupil support. This form of support includes providing access to nutritionally adequate meals, health counseling, and programs to support student social-emotional learning.
- Strategy 4: Community learning hubs. This resource includes efforts to increase student access to computer devices, high-speed internet, and other technology tools.
- Strategy 5: Supports for credit-deficient students. This endeavor includes providing intervention courses, summer credit recovery courses, and flexibility to students at risk of not meeting the minimum graduation requirements.
- Strategy 6: Additional academic services for students. This approach includes using diagnostic, formative, and summative assessments to evaluate and monitor student learning.
- Strategy 7: Training for school staff to address students’ academic and social-emotional needs. This professional development expansion may include direct SEL instruction, integrating SEL into daily instruction, and implementing restorative practices and trauma-informed instruction.
As a requirement to receive their ELO-G funds, districts must develop and submit their learning recovery plans in addition to submitting quarterly reports on actual spending (as they do with federal stimulus dollars). In their plans, they are required to describe:
- how students’ needs will be assessed;
- how they will provide supplemental instruction and support;
- their expenditure plan; and
- how the district is coordinating its ELO-G with ESSER to maximize support for students and staff.
We downloaded all publicly available ELO-G plans from 820 districts; among those, 791 districts (96%) reported valid expenditure data. Those 791 districts account for 84 percent of all California districts and serve 95 percent of the K–12 student population.
Most Funds Went to Accelerate Student Learning and Extend Instructional Time
Most districts spent their ELO-G on multiple strategies to support recovery. More than 90 percent of districts used ELO-G to accelerate student learning, and 86 percent used it to provide integrated student support. Other strategies such as extended instructional learning time, support for credit-deficient students, and training for school staff, were also implemented in most districts (Figure 12).
Vast majorities of districts used ELO-G to accelerate learning and provide integrated student supports

SOURCE: Authors’ calculations using data from districts’ ELO-G Plans.
NOTE: * Unified and high school districts only. Sample includes 791 districts serving 95 percent of the K–12 student population.
When we look at the planned expenditures, we see that most ELO-G dollars are used to accelerate student learning and extend instructional learning time (Figure 13). Districts spent nearly a third of ELO-G dollars on learning supports (such as small group instruction) to accelerate student learning; whereas one-quarter of ELO-G dollars were used to extend instructional learning time (such as summer programs). Notably, this differs from the federal stimulus spending discussed in the previous section, for which only 4 percent of federal funding spent so far has been reported spent on extended learning time.
Even though most districts provided staff training, community learning hubs, and credit recovery supports, these categories each account for less than 10 percent of the total ELO-G spending. However, this does not necessarily mean that districts are not implementing those strategies. For example, they may tap into other funding sources, such as ESSER I and II to purchase devices, such as computers and hotspots (strategy 4), or into the Educator Effectiveness Block Grant to provide training for school staff (strategy 7).
Most dollars from ELO-G went to accelerate learning and extend instructional learning time

SOURCE: Authors’ calculations using data from districts’ ELO-G Plans.
NOTE: * Unified and high school districts only. Sample includes 791 districts serving 95 percent of the K–12 student population.
Demographics and geography affected spending
High-poverty districts spent a higher share (31%) of their ELO-G dollars to extend instructional learning time, compared to low-poverty districts (19%; Figure 14). Students in high-poverty districts may have lost more instructional time due to less access to broadband and computer devices during distance learning and to slower reopening in spring 2021 (Hayes and Gao 2021; Herrera et al. 2022). On the other hand, low-poverty districts spent a larger percentage on programs to accelerate student learning (36%) and additional academic services (13%).
High-poverty districts spent a higher share of ELO-G funds to extend instructional learning time

SOURCES: Authors’ calculations using data from districts’ ELO-G Plans; District-level income data from the California Department of Education.
NOTES: 1. High-poverty districts: at least 75 percent of students are eligible for free/reduced price lunch; Low-poverty districts: less than 25 percent of students are eligible for free/reduced price lunch. 2. Supports for credit-deficient students apply only to unified school districts and high school districts. 3. In 59 districts, the shares of the seven strategies add up to >100 percent. This may happen, for example, when a district spent $500,000 to hire additional instructional supports to provide small group instruction during summer programs, and the investment is applied to both strategy 1 (extending instructional learning time) and strategy 2 (accelerating progress through learning supports). In this situation, we applied $500,000 to each, and changed their total ELO-G so the shares add up to 100 percent. Those 59 districts do not seem to differ from other districts in any observable characteristics that we can measure (e.g., size, student demographics, student needs, urbanicity). Results excluding those 59 districts are virtually identical. 4. We ran a regression using each strategy % as the dependent variable and district characteristics as independent variables. % free/reduced price lunch, % English learners, and geographic locations are significant predicators of districts’ spending on each strategy. The results are included in Table D2 Technical Appendix D.
The geographic locations of districts also reveal interesting differences in spending. Rural districts spent a lower share of ELO-G to extend instructional learning time (Figure 15). One explanation may be that rural districts reopened in-person instruction much earlier than urban districts, so students may not have lost as many instructional hours as those in urban districts. Nationwide, 63 percent of rural schools offered in-person instruction to all students in January 2021, compared to 35 percent of urban schools (National Center for Education Statistics 2022). On average, rural districts in California reopened to all grades in early February 2021, while urban districts fully reopened in early May of that year (Herrera et al. 2022).
Another possibility is that rural districts, which have long struggled to recruit and retain quality teachers, had trouble keeping up with increased demand for additional or more teachers to staff recovery programs. About a quarter of rural schools nationwide were understaffed prior to the start of the pandemic, and 70 percent said there were too few candidates applying for open teaching positions for the 2022–23 school year (National Center for Education Statistics 2022). Therefore, rural districts may have strived to address learning loss differently as earlier reopening times prompted different spending strategies.
Urban districts spent more ELO-G funds on extended instructional time and less on learning acceleration

SOURCES: Authors’ calculations using data from districts’ ELO-G Plans. High-need student share, low-income student share, Black/Latino students share, and English learners share are from the California Department of Education’s publicly available data. Urban/Rural are based on National Center for Education Statistics locale code.
NOTES: 1. Supports for credit deficient students apply only to unified school districts and high school districts. 2. In 59 districts, the shares of the seven strategies add up to >100 percent. This may happen, for example, when a district spent $500,000 to hire additional instructional supports to provide small group instruction during summer programs, and the investment is applied to both strategy 1 (extending instructional learning time) and strategy 2 (accelerating progress through learning supports). In this situation, we applied $500,000 to each, and changed their total ELO-G so the shares add up to 100 percent. Those 59 districts do not seem to differ from other districts in any observable characteristics that we can measure (e.g., size, student demographics, student needs, urbanicity). Results excluding those 59 districts are virtually identical. 3. We ran a regression using each strategy % as the dependent variable and district characteristics as independent variables. % free/reduced price lunch, % English learners, and geographic locations are significant predicators of districts’ spending on each strategy. The results are included in Table D2 Technical Appendix D.
Conclusion and Recommendations
In this report we take a first comprehensive look at allocation and uses of federal and state stimulus funding for educational recovery. Allocations vary significantly across districts; districts with the highest shares of low-income and otherwise high-need students have seen the greatest influx of new funding. To date, nearly two-thirds of allocated federal funds have been spent, and the average district is on pace to have spent down over 95 percent of funds by fall 2024, when the last federal stimulus fund (ESSER III) expires.
In 2020–21 and 2021–22, districts spent the lion’s share of federal funding on health and technology needs—due to the public health emergencies and abrupt shift to distance learning. As the pandemic evolved, by 2022–23, districts report spending more on interventions to address academic losses, as well as mental health/SEL programs and programs to increase instructional time. ELO-G expenditure plans indicate that most ELO-G funding is allocated to extend instructional learning time and implement interventions to accelerate student progress.
As districts continue to spend stimulus funding and policymakers contemplate ongoing and longer-term needs for the state’s public school system, key implications emerge from our findings:
Streamlining funding sources could aid districts. Federal and state stimulus funds are numerous, and though they are flexible, the varying expiration dates and reporting requirements add complexity to district budget allocations. Ongoing efforts to target new state funds and adjust funding formulas risk adding further layers of complexity to district budgeting.
But district worries over spending inefficiencies and greater administrative burdens around managing funding streams raise concerns about a “return” to the pre-LCFF era of categoricals. While some complexity is unavoidable as the state attempts to target resources to best serve the student populations most in need, policymakers should be wary of further complicating and constraining district choices, especially as federal stimulus funds expire.
More effective outreach and technical assistance could help districts implement evidence-based strategies. Districts welcome additional federal and state funding, but the awareness of allowable uses, spending categories, and reporting requirements imposes constraints and adds complication, particularly for smaller districts with less administrative capacity. Deploying funding requires some level of “braiding,” or weaving together different strands of state and federal funding to sustain programs, but this may be more difficult for some districts.
State legislation also introduced unintended confusion: in 2021 the state passed the Expanded Learning Opportunities Grant (ELO-G); in 2022 the state passed the Expanded Learning Opportunities Program (ELO-P). ELO-P can be used only for after-school and summer school enrichment programs for transitional kindergarten through sixth grade. ELO-G funding applies to all districts, and the money can be spent on programs beyond after-school and summer programs.
There was considerable confusion among districts about ELO-G and ELO-P, and some districts appeared to treat those two programs the same. Policymakers should be more careful naming future programs, and more effective outreach could help districts make better use of those resources.
The effectiveness of stimulus dollars on educational recovery needs closer examination. Due to the underlying formulas for distributing federal and state stimulus dollars, funding allocations do not correlate highly with the actual level of learning losses at the district level. However, allocations are highly correlated with underlying achievement levels, with the greatest funding going towards districts that are the lowest-performing and have the highest-need student populations. While this may suggest that early investments staved off larger learning losses, understanding the efficacy and impact of stimulus funds will require more careful study in future work.
Nevertheless, this correlation implies that aggregate measures of test scores over the coming years may not be a good indicator of whether additional resources provided through stimulus funds were useful, unless we also consider a district’s pre-pandemic academic achievement. Instead, if these resources are productive, we may expect to see achievement gaps narrow more quickly than statewide learning losses recover—which may indeed be a policy goal. As future funding becomes available, policymakers will need to balance whether to explicitly target funding to districts with the largest learning losses or instead to address longstanding gaps. A clear framework around what an equitable recovery entails would ensure funding is targeted with the state’s specific recovery goals in mind.
Better, more consistent data and measurement are necessary to better target and assess educational recovery policies. Currently, the exact uses of federal and state stimulus funds are only vaguely defined, which will limit the ability to draw effective insights into which programs and innovations the state should prioritize over the coming years. In addition, reporting requirements vary across programs and funding streams, complicating reporting for districts—and complicating efforts by researchers and policymakers to understand funding allocations. Centralized state efforts to ensure consistent reporting requirements across programs could ease burdens on districts while allowing for better insights to come from analyses of this information across districts.
Unprecedented federal and state funding helped schools stay open and implement programs to help students recover. Leveraging those one-time funds to create long-lasting changes in the education system remains key to an effective and equitable recovery. And how districts transition from this short-term period of higher funding to a more sustainable level of future investment will be a critical area of policy concern.
Our future work will document the recovery programs districts have implemented across the state, examine their associations with student outcomes, and consider how districts are planning to sustain programs after COVID-19 recovery funding runs out. This work will consider the institutional mediators at play as stimulus dollars are translated into services, materials, and staffing in the classroom. In the years to come, education policymakers and researchers must address these factors to understand how policies and programs influence educational recovery—and how effects may vary by grade, demographics, and initial magnitude of losses.
Topics
K–12 Education