
Highlights
- To jump-start educational recovery after the disruptions from COVID-19, the federal and state governments sent billions in one-time stimulus funds to school districts.
- California allocated much of its stimulus funding to districts based on their shares of low-income students—a proxy for student need and the main way California directs money towards high-need districts and students. This approach more directly targeted districts with pre-existing lower achievement levels rather than those with larger pandemic learning loss.
- Districts have spent nearly two-thirds of federal funds as of March 2023; most of the remainder must be spent by September 2024. Federal spending first targeted health and technology, but now more often targets academic interventions.
The extent of learning losses was not known when California first allocated its stimulus funds; instead, most funds went to districts based on either the federal Title 1 formula or California’s Local Control Funding Formula, both of which target districts with higher shares of low-income students—who also tend to have lower test scores. The federal relief packages were therefore better structured to reach schools with lower achievement rather than those with the largest drop in test scores on California’s Smarter Balanced Assessments between 2019 and 2022.
What impact did the pandemic have on the academic performance of California’s students?
In 2022, math and English Language Arts (ELA) scores were back at or below 2016 levels in nearly all grades, after several years of growth pre-pandemic. Losses occurred across districts, income levels, region, and race/ethnicity.
Districts serving higher shares of low-income students, English Learners, and foster youth faced slightly larger drops in proficiency between 2019 and 2022. Districts with the largest Latino populations saw the sharpest drops—especially in math, where proficiency fell by 7.1 percentage points.
How much stimulus funding did California receive for educational recovery?
Between each of the stimulus packages, the federal government distributed $28.4 billion in one-time stimulus dollars to California. Early moneys became available in March 2020 and included $4.4 billion from the Coronavirus Relief Funds (CRF), $1.6 billion from the Elementary and Secondary School Emergency Relief Fund (ESSER I), $6.7 million from ESSER II, and $15 billion from ESSER III.
On average, the state allocated $708 per student from CRF, $239 from ESSER I, $1,067 from ESSER II, and $2,350 from ESSER III—although high-need districts generally received higher funding. The Governor’s Emergency Education Relief Fund (GEER I, $335 million, and GEER II, $341 million) also made funds available at the governor’s discretion.
In 2021, California created the $4.6 billion Expanded Learning Opportunity Grant (ELO-G) to directly address the impact of lost instructional time. To receive ELO-G funds, districts were required to submit learning recovery plans and quarterly reports on spending.
Where did districts direct their stimulus dollars?
In the 2020–21 school year, the typical district directed roughly half of their federal funding to technology and materials, as districts adapted to virtual instruction amid public school closures. In 2022 and 2023, districts shifted their stimulus spending toward addressing learning loss. Over all federal stimulus programs through March 2023, technology has been the largest spending category, accounting for about 23 percent in the average district ($778 per student). Academic/learning loss interventions (22%; $757 per student) and health spending (21%; $709 per student) are the next largest categories.
More than 90 percent of districts used ELO-G dollars to accelerate student learning through programs such as small group instruction, and 86 percent used these funds for student supports such as access to meals, mental health counseling, and programs to support social-emotional learning (SEL). District case studies highlight how funding aided in the return to in-person teaching and ramped up innovations around student learning and well-being.
How can policymakers improve funding programs for educational recovery?
Across all stimulus programs, there are 40 categories for reporting expenses. Currently, the ways districts may use program funds, and the spending categories funds fall into are vaguely defined. The reporting requirements are more clearly defined. State efforts to clarify uses and make reporting requirements consistent across programs—as well as provide technical assistance—could ease burdens on districts while allowing better analyses of programs. With more consistent data and measurement, policymakers can identify the educational recovery policies to prioritize for the future.
Most federal stimulus spending went to health and technology early in the pandemic; later, more spending went to learning loss and other interventions
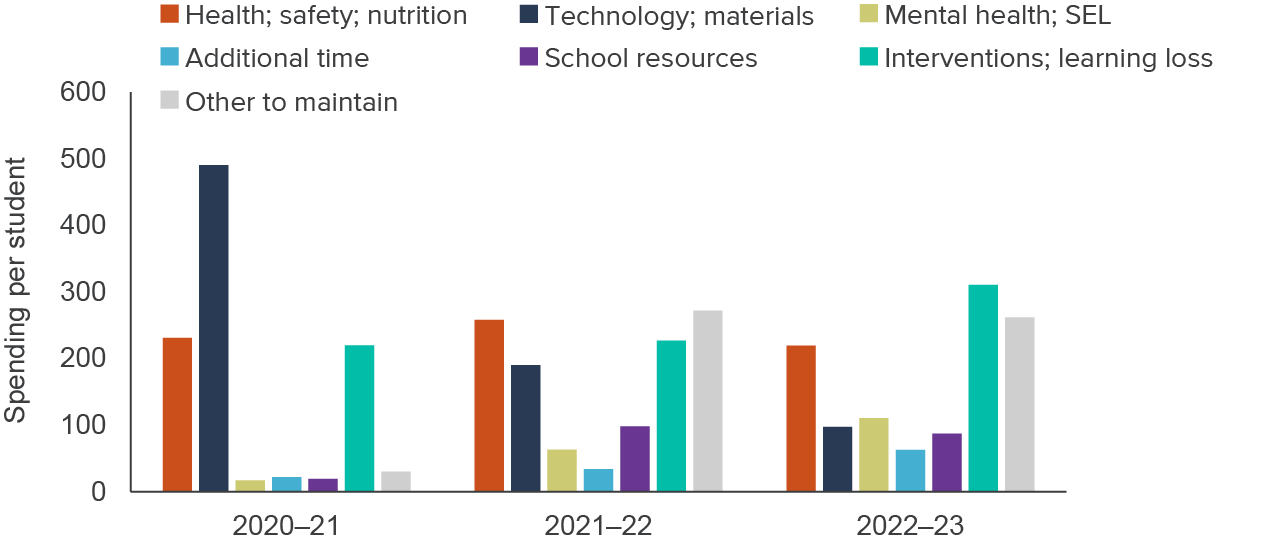
SOURCES: Quarterly Expenditure Reports; California Department of Education; authors’ calculations.
NOTES: Average spent per student across districts (unweighted). 2022–23 includes spending through March 31, 2023. Enrollment data is from the 2021–22 school year. Charter schools that report expenditures independently from a district’s general fund are excluded. Other to maintain: other activities to maintain normal school operations.
Topics
K–12 Education