
- A quarter of the nation’s immigrants live in California.
California is home to 10.7 million immigrants, or about a quarter of all foreign-born residents living in the country. In 2016, 27% of the state’s population was not born in the United States. This marks a threefold increase since 1970, when 9% of California’s population was foreign born, and is similar to the rate of increase in foreign-born residents nationwide (up from 5% in 1970 to 13% in 2016). Today, 50% of California’s immigrants are naturalized US citizens. - Immigrants in California express less interest in politics than US-born residents …
In our surveys, we find that immigrants in California are less likely to have a great deal (17%) or a fair amount (23%) of interest in politics than US-born residents (30% great deal, 42% fair amount). Among immigrant respondents who have become naturalized US citizens, 83% are registered to vote, similar to the rate among US-born residents (86%). However, 54% of immigrants who became US citizens are considered likely voters, compared to 61% of US-born residents.
Interest in politics
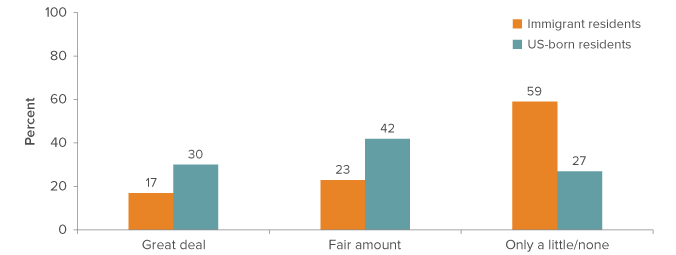
SOURCE: Nine PPIC Statewide Surveys from January 2017 to January 2018, including 15,374 adults, 3,789 of whom were immigrant residents.
- … but both groups are paying more attention to politics since the presidential election.
Since Donald Trump’s election, nearly half of the state’s immigrants (49%) and US-born residents (52%) say they are paying more attention to politics. Among both groups, a third express more interest in local town hall meetings held by elected officials. However, overwhelming majorities of immigrants (90%) and US-born residents (80%) have not attended a political event, rally, or organized protest since the November election. - Naturalized citizens in California are more likely to be registered as Democrats.
Among naturalized citizens in our surveys who are registered to vote, 56% are registered Democrats, 28% are independents, 14% are Republicans, and 2% are registered with other parties. Among the state’s US-born registered voters, 43% are Democrats, 28% are Republicans, 24% are independents, and 5% are registered with other parties. But similar shares of California’s immigrants and US-born residents identify as politically liberal (35% immigrant, 37% US-born), conservative (35% immigrant, 33% US-born), and moderate (30% each).
Party registration
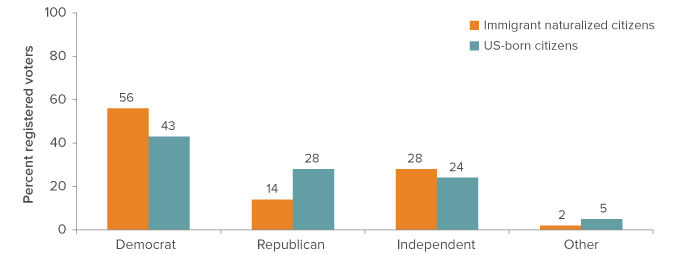
SOURCE: Nine PPIC Statewide Surveys from January 2017 to January 2018, including 15,374 adults, 3,789 of whom were immigrant residents.
- Immigrants are more likely than US-born residents to trust the federal government.
In California, nearly four in ten immigrants say they can trust the federal government to do what is right just about always (13%) or most of the time (26%), compared to fewer than a quarter of US-born residents (3% always, 20% most of the time). Notably, immigrants (74%) are far more likely than US-born residents (44%) to prefer a bigger government providing more services. However, majorities of both immigrants (57%) and US-born residents (64%) think the federal government wastes a lot of taxpayer money. And solid majorities of immigrants (60%) and US-born residents (75%) think the federal government is run by a few big interests looking out for themselves, with fewer (34% immigrant, 21% US-born) believing the federal government is run for the benefit of all people. - Immigrants have more favorable views on immigration than US-born residents.
Nearly nine in ten immigrants in California say immigrants are a benefit to the state because of their hard work and job skills, while only 8% say they are a burden because they use public services (70% US-born say benefit, 26% US-born say burden). An overwhelming majority of immigrants (84%) also oppose building a wall along the entire border with Mexico, compared to a strong majority of US-born residents (67%). And most Californians favor the protections provided by the Deferred Action for Childhood Arrivals (DACA) program, with overwhelming majorities of both immigrants (88%) and US-born residents (78%) in favor of DACA protections for some undocumented immigrants who were brought to the United States as children.
Opinions and political ideology of California’s immigrants
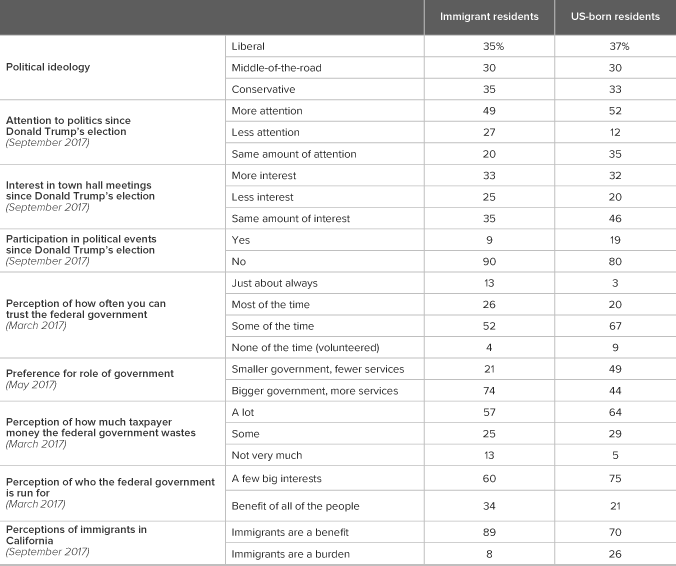
SOURCE: Nine PPIC Statewide Surveys from January 2017 to January 2018, including 15,374 adults, 3,789 of whom are immigrant residents, unless otherwise noted; 2016 American Community Survey.
Sources: Nine PPIC Statewide Surveys from January 2017 to January 2018, including 15,374 adults, 3,789 of whom were immigrant residents, unless otherwise noted; 2016 American Community Survey.
Topics
Political Landscape Population Statewide SurveyLearn More

Fact Sheet · January 2026
Immigrants in California

Policy Brief · December 2025
Policy Brief: California’s Immigration Landscape and Current Public Opinion

Blog Post · May 7, 2024
How Has California’s Immigrant Population Changed over Time?

Blog Post · November 2, 2023
California’s Changing Immigration Is Reshaping Its Electorate
