


Recent Publications


Blog Posts
View More →
What California’s Next Governor Needs to Know about the Social Safety Net
Caroline Danielson, Tess Thorman, Patricia Malagon

K–12 Enrollment Trends Diverge by Students’ Language Background
Julien Lafortune, Laura Hill

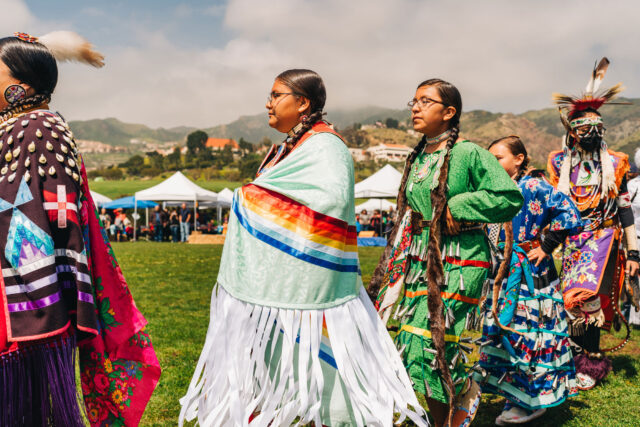
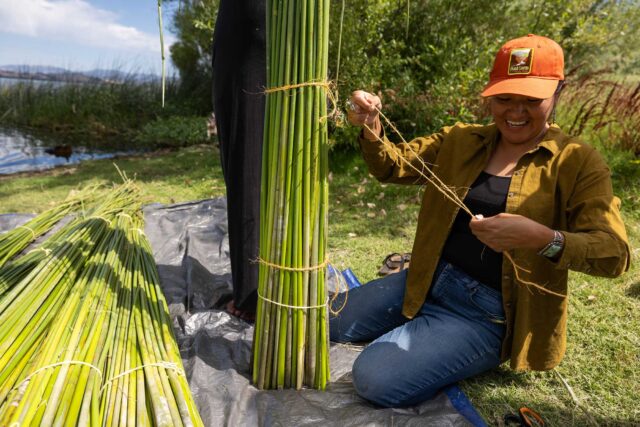
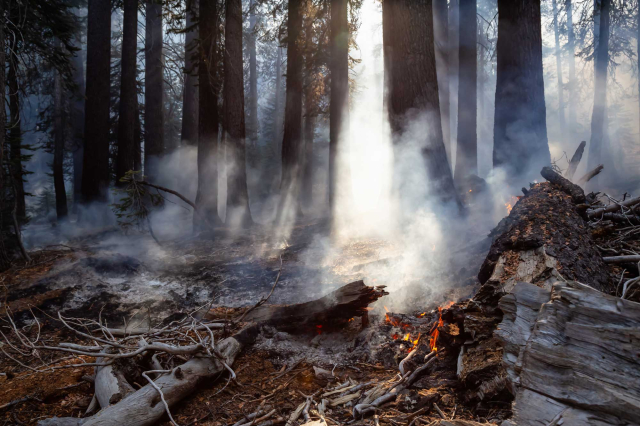
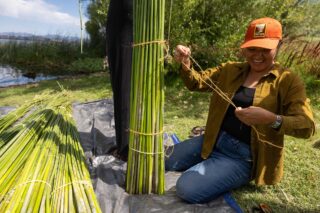
The Essential Role of Tribes in Regional Water Management
Vicki Hsieh
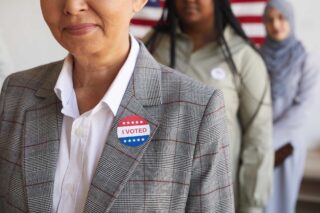
How Election Reform Played Out in California’s June Primary
Eric McGhee, Mark Baldassare
Events
View More →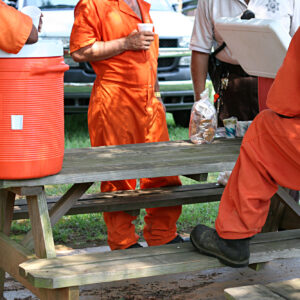
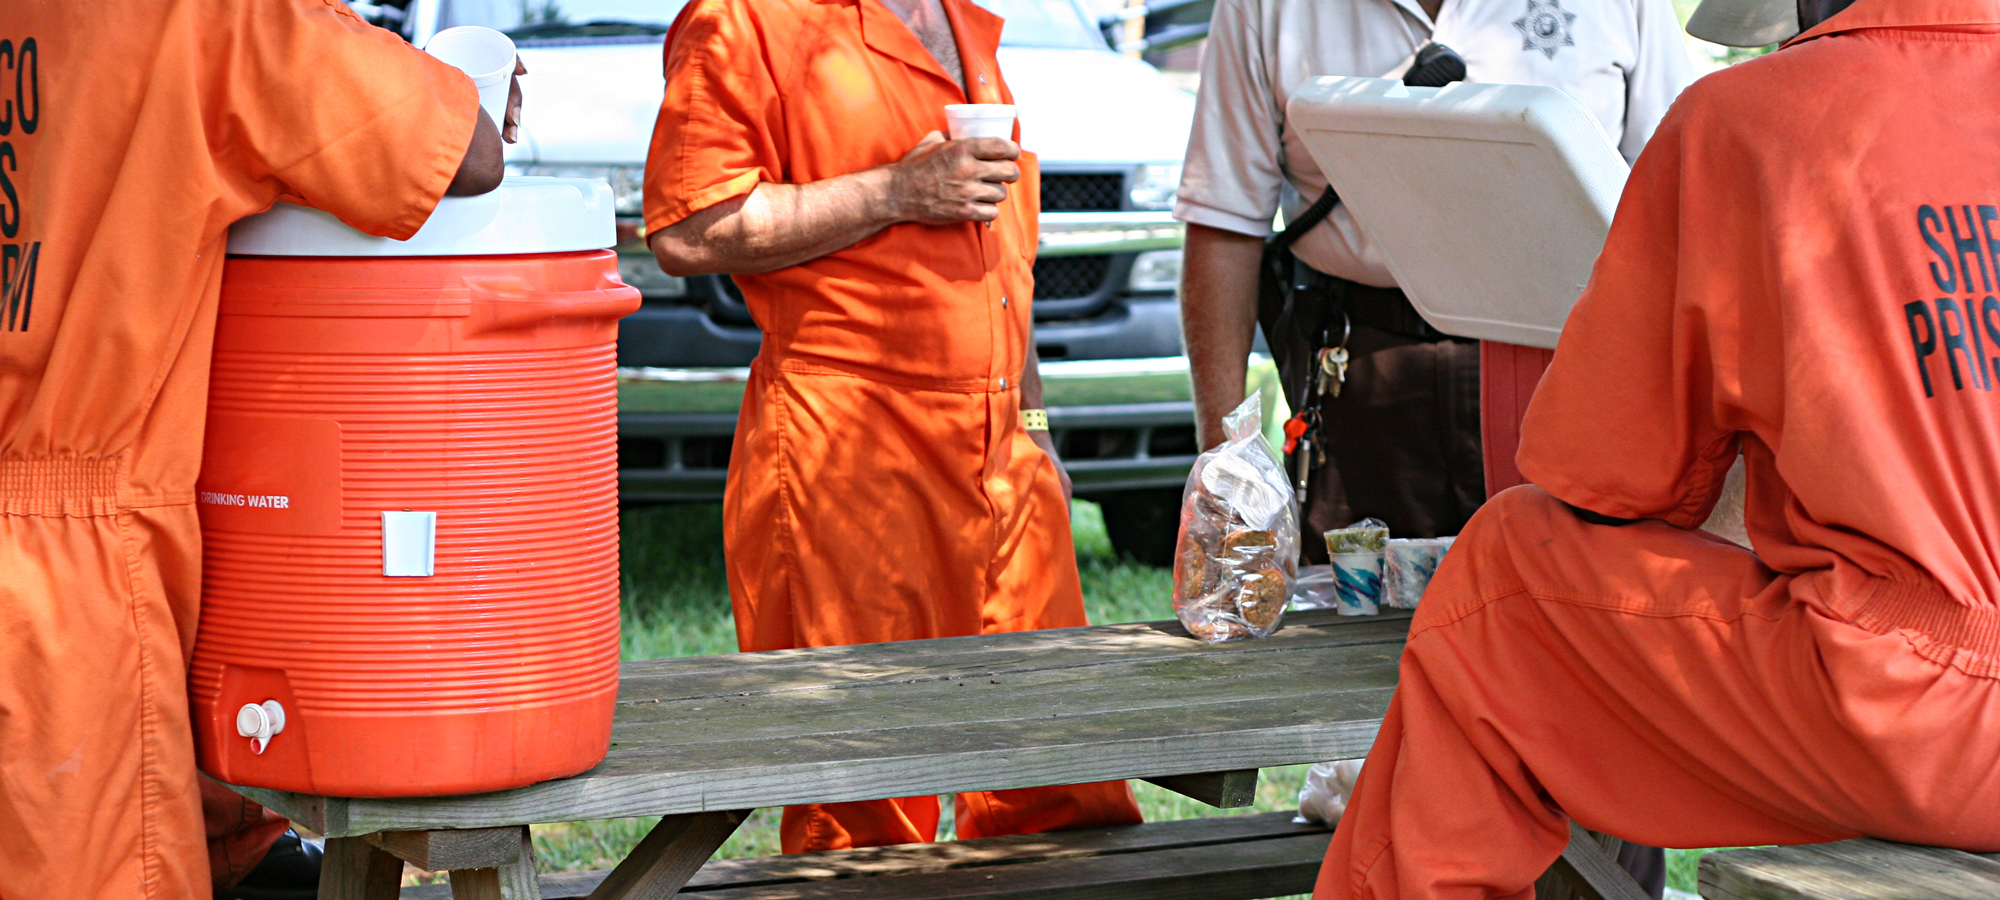
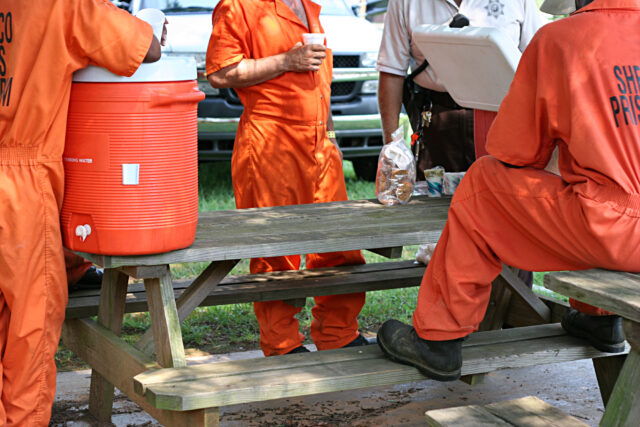
Employment Before, During, and After Prison in California
June 25, 2026 · 11:00 am - 11:30 am
Fact Sheets
View More →
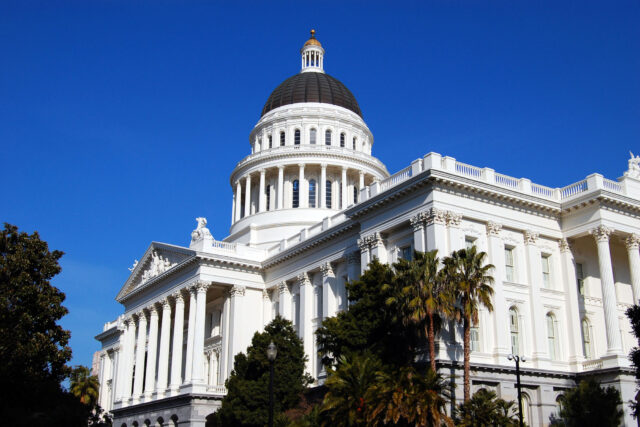
Higher Education Funding in California
Kevin Cook, Valerie Lundy-Wagner

California’s Economy
Daniel Payares-Montoya, Sarah Bohn

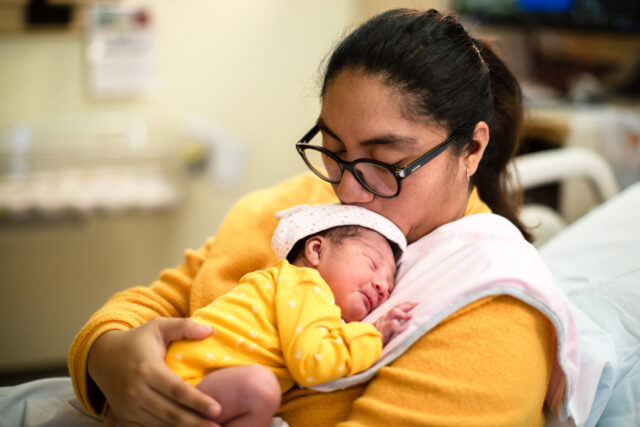
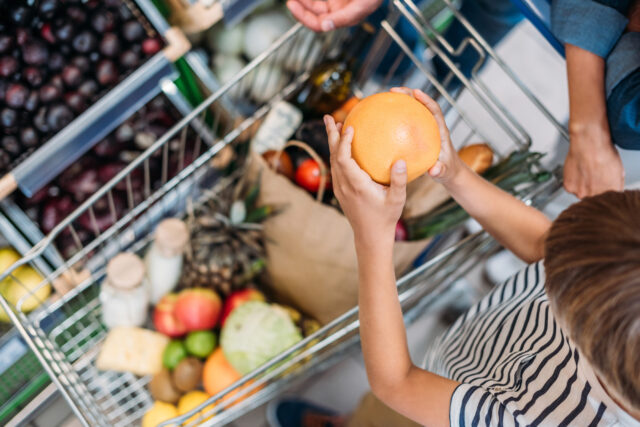
California’s Nutrition Safety Net
Tess Thorman, Patricia Malagon
Tribal Water Rights and Water Use in California
Brian Gray, Letitia Grenier
Income Inequality in California
Tess Thorman, Daniel Payares-Montoya
