California’s education spending has risen substantially in the past decade, bolstered by growing revenues, recovery from the Great Recession, and pandemic-era state and federal investments. Recognizing the central role teachers play in student performance, the state has invested over $1 billion in additional funding to address teacher staffing and preparation in recent years. However, California’s schools continue to face academic and fiscal challenges. Tracking recent trends in district staff spending and student-teacher ratios, as well as teacher credentials and experience, can inform efforts to address these challenges.
Increased school spending has had a modest effect on teacher staffing
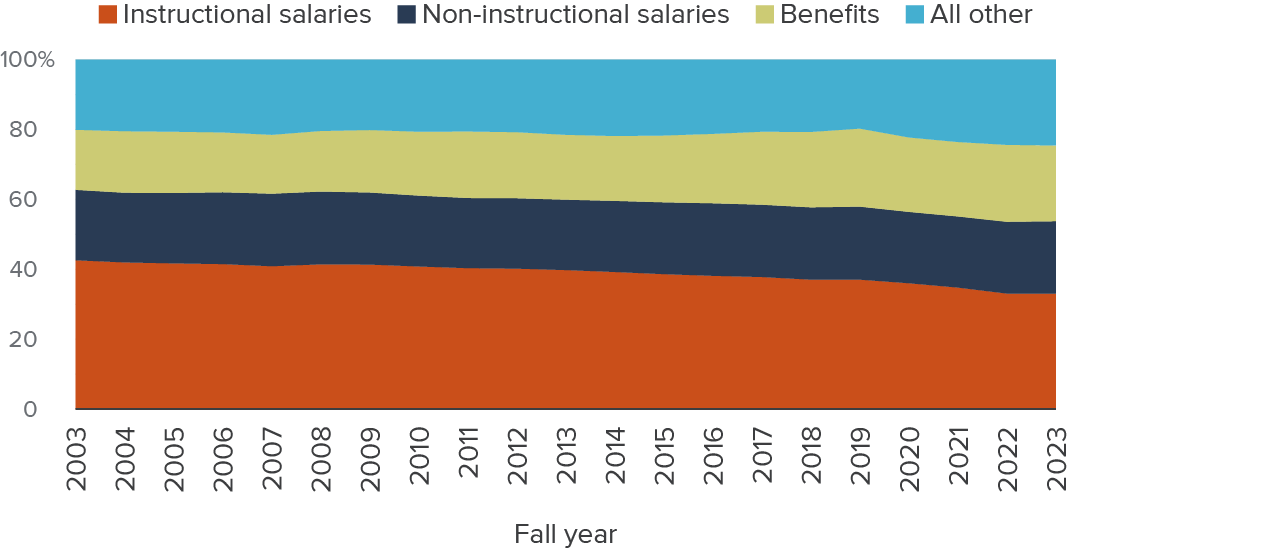
Roughly 80% of California’s school spending goes toward salaries and benefits—and teachers are by far the largest single staffing category. But while instructional salary spending has grown substantially in recent years—rising by nearly $2,000 per student (42%) since 2012–13—other areas have seen even sharper increases. Instructional salaries have declined as a share of overall spending (40% to 33%), while the shares of spending on benefits (19% to 22%) and other spending (21% to 25%) have increased.
Instructional salary spending has declined as share of overall spending
Share of current spending
SOURCE: California Department of Education.
NOTES: “All other” includes all other non-salary and non-benefit spending (e.g., instructional materials, equipment, professional development). Spending shares based on current spending, excluding capital funding and debt service. Average across districts, weighted by student enrollment. Excludes districts enrolling fewer than 250 students, those with zero attendance, and outliers (spending far above or far below per student spending averages per year). Charter schools fiscally included on a district’s general fund are included; others are excluded.
Since the implementation of the Local Control Funding Formula (LCFF) in 2013–14, districts with more high-need students had larger increases in funding. These districts saw relative increases in the share of fully credentialed teachers, but also in the share of less-experienced teachers; relative class sizes were unchanged.
Schools with lower shares of credentialed or fully authorized teachers disproportionately serve low-income students. Roughly a quarter of students attend schools where at least 20% of teachers are not fully credentialed or are teaching subjects outside of their formal authorizations; these schools tend to serve higher shares of low-income students.
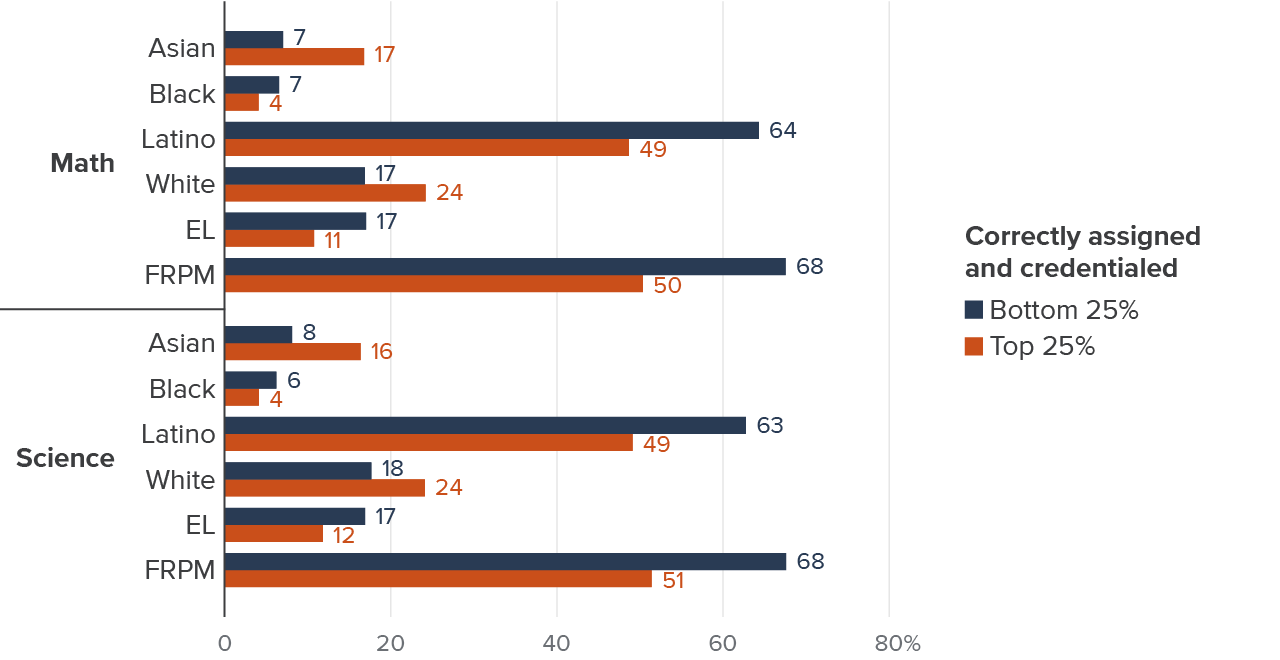
Teachers in math and science courses are less likely to be correctly assigned and credentialed. One in ten middle and high school students attends a school where less than half of math teachers and under 41% of science teachers are correctly assigned and credentialed—compared to 60% for other subjects. In the schools with relatively low shares of correctly assigned math and science teachers, two-thirds of students are low-income, compared to about half in schools with the highest shares.
Schools with staffing challenges in math and science have higher shares of low-income and Latino students
Share of student enrollment
SOURCE: California Department of Education.
NOTES: Average across traditional schools in a given quartile of clear assignment shares by subject, weighted by school enrollment. EL denotes English Learner. FRPM denotes enrolled in free and reduced-price meals, which is used to proxy low-income. Only racial groups with the largest enrollment are shown; American Indian or Alaska Native and multi-racial are excluded. “Asian” includes Asian, Filipino, and Pacific Islander. Data from 2022–23 and includes only middle and high schools.
Policy Implications
Targeted funding increases may not be enough to support teacher staffing in high-need districts. LCFF funding increases in higher-need districts have so far had little impact on many teacher staffing metrics. While prior research has found that targeted spending increases improved student outcomes, policy efforts that specifically address staffing may be needed to further boost the teaching workforce and student outcomes.
Efforts to address teacher staffing challenges should focus on specific schools that are persistently hard to staff. Many schools have teachers with substandard qualifications, particularly in math and science. Efforts tailored to specific schools—often those in lower-income communities serving higher-need students—could be more effective than broad-based strategies such as funding formula allocations.
Addressing lagging teacher salaries could help improve outcomes. Inflation-adjusted salaries have increased for the average teacher, but inflation-adjusted starting salaries are no higher than they were in the early 2000s. More teachers are also at the lower end of the pay scale. Raising starting salaries could help strengthen recruitment and retention, though this would have to be balanced against other budget priorities.
Topics
K–12 Education Poverty & Inequality