
Table of Contents
- Key Takeaways
- Introduction
- Recent Funding Changes Led to More Teacher Spending, but Larger Growth in Other Areas
- Teacher Staffing Metrics Have Fluctuated in Recent Decades
- Disparities in Teacher Staffing Metrics Vary Depending on How They Are Measured
- Conclusion and Policy Implications
- Notes and References
- Authors and Acknowledgments
- PPIC Board of Directors
- Copyright
Key Takeaways
California’s education spending has risen substantially in the past decade, and much of the additional funding has gone toward teacher salaries and benefits. Lagging academic performance and disparate outcomes across demographic groups, however, have amplified concerns about teacher staffing. In this report, we provide new perspectives on instructional spending and teacher staffing metrics over the past several years by tracking trends in district staff spending and student-teacher ratios, as well as teacher credentials and experience. We find:
- Substantial growth in school spending has had a modest effect on teacher staffing. State school spending increased substantially after major education reforms a decade ago, and federal emergency funds further boosted revenues during the pandemic. Teachers account for a major share of district budgets, but while instructional spending (on teachers and other classroom staff) has grown substantially, non-instructional areas have seen even faster increases. →
- High-need districts have received additional targeted funding, with mixed effects on staffing outcomes. Teachers in high-need districts were more likely to have full credentials but were more likely to be novices than those in districts that enrolled fewer high-need students; relative class sizes were unchanged. →
- Inflation-adjusted salaries have increased for the average teacher, but starting salaries are no higher than they were in the early 2000s. Greater shares of teachers are also at the lower end of the pay scale. Further, salaries for teachers are lower than other college-educated workers and have grown more slowly. →
- Schools with lower shares of credentialed or fully authorized teachers disproportionately serve low-income students. Statewide, there are small differences in teacher staffing metrics across demographic groups, on average. But roughly a quarter of students attend schools where at least 20 percent of teachers are not fully credentialed or are teaching subjects outside of their formal authorizations; these schools tend to serve higher shares of low-income students. →
- Teachers in math and science courses are less likely to be correctly assigned and credentialed. One in ten secondary school students attends a school where at least 50 percent of math or at least 59 percent of science teachers are incorrectly assigned and credentialed to teach the course. In the schools with the lowest shares of correctly assigned math and science teachers, two-thirds of students are low-income, compared to just over half in schools with the highest shares. →
Policy efforts to improve teacher staffing should focus on schools that are persistently hard to staff, particularly in math and science. Raising starting salaries could help strengthen teacher recruitment and retention, though this would have to be balanced against other budget priorities. Also, more comprehensive staff-level data would make it easier to understand where district staffing challenges are the greatest and design targeted interventions.
Introduction
In most years, roughly 80 percent of school spending goes toward staff salaries and benefits. Teachers are by far the largest single staffing category. Research has documented the central role teachers play in student performance in both the short- and long-run (e.g., Backes 2025). Seeking to boost student performance, policies and strategies aimed at improving teacher preparation and district staffing levels have been ubiquitous in education policy discussions both in California and across the nation. In recent years, California has invested over $1 billion in additional funding to address these issues. The state also increased targeted funding in 2021 with the explicit goal of raising staff counts in districts with large numbers of high-need students.
And yet, California’s schools face growing academic, socioemotional, and fiscal challenges. Whether measured on national or state-level exams, the state’s students have not recovered from the pandemic, scoring below 2015 math and reading levels on the 2024 exams (Ugo and Assan, 2025). Gaps across student groups and performance levels have also widened, with scores for the lowest-performing 10 percent of students falling even further behind the highest-scoring 10 percent over the last decade (Lafortune and Ugo, 2025).
Amid these academic concerns, teacher staffing remains a key issue. Many schools report trouble filling positions with qualified and experienced educators. Staffing difficulties are particularly pronounced in math, science, special education, and bilingual education. There are disparities in access to credentialed and experienced teachers between more and less affluent schools and across racial and ethnic groups (Carver-Thomas, Leung-Gagné, and Jeannite 2024). There are also notable differences within school districts: affluent schools are more likely to offer higher salaries and have teachers with more education and experience (Lafortune 2019).
These staffing challenges have important implications for student learning. A substantial body of research identifies a connection between student performance and teacher quality using a range of metrics. Teacher experience is often found to be the strongest predictor of student success. Different analyses have found mixed results on the impacts of other teacher staffing metrics, including credentials, advanced degrees, teacher turnover and salaries.
In this report we examine trends in teacher spending and district staffing metrics with an added focus on districts that received targeted funding for high-need students under the Local Control Funding Formula (LCFF). We focus mainly on factors we can measure in available data: spending, salaries, experience, credentials, and student-teacher ratios. We primarily use aggregated data on teacher staffing levels, qualifications, and spending. Understanding these dynamics is key to improving education policy and addressing lagging performance and stubbornly persistent gaps.
We begin by analyzing trends in school funding and changes in the allocation of education spending over time. Next, we examine teacher staffing metrics, from class sizes to teacher credentials, assignments, and experience. We review statewide trends, then focus on disparities across demographic groups. We then further narrow our focus to the schools and subjects with the most severe challenges.
Recent Funding Changes Led to More Teacher Spending, but Larger Growth in Other Areas
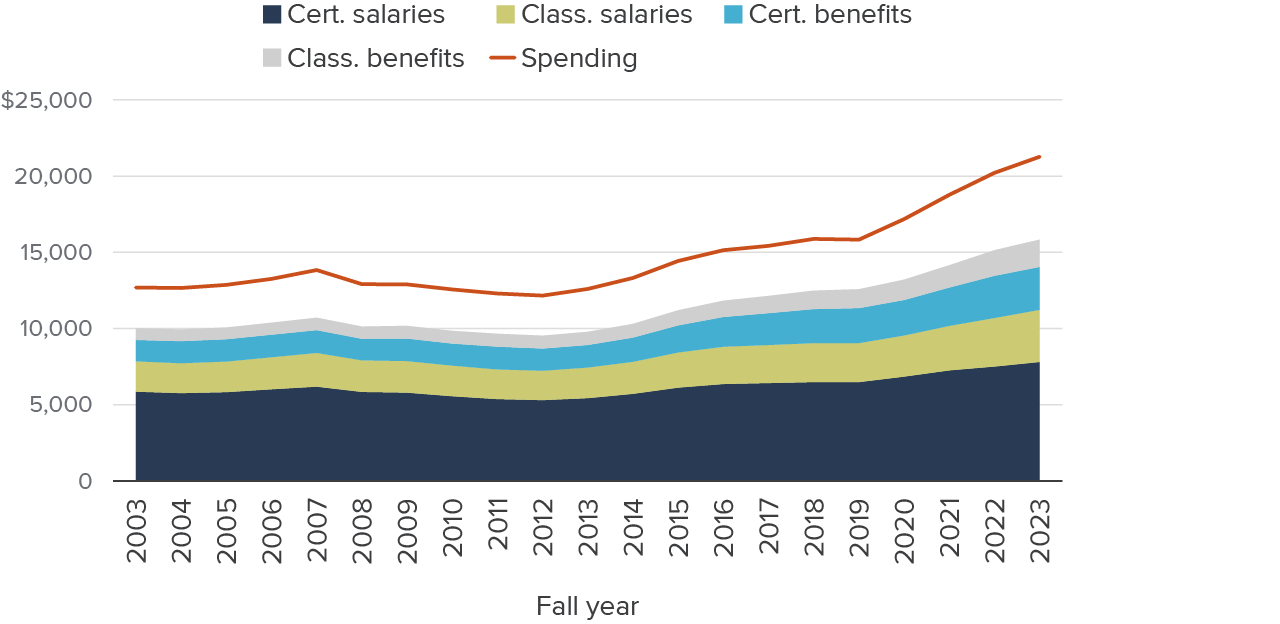
California’s school spending has surged in the past decade due to rising income tax rates, economic growth, and massive increases in federal funding in response to the pandemic. Figure 1 below shows the education spending trends over the last two decades and the distribution of funds across various spending categories. This surge began as the state economy rebounded from the Great Recession, which had a significant negative impact on education funding. Between 2007–08 and 2012–13, spending fell by 12 percent, from roughly $13,840 per student to $12,160 in inflation-adjusted dollars. In the 11 years after the trough in spending in 2012–13, spending increased nearly 75 percent in California. Most of this increase has come since the pandemic, with spending increasing from $15,830 to $21,270 per student from 2019–20 to 2023–24.
This increase was largely driven by two factors. First, the state education budget increased substantially during this time, bolstered by both an improved state economy and increased revenues from income and sales tax increases passed by voters via Proposition 30 in 2012. Second, federal and state stimulus funding during the pandemic significantly increased education spending starting in 2020–21; federal funds typically account for between 6 to 9 percent of education revenues in California in most years, but they accounted for 23 percent of K–12 funding in 2020–21 and 11 percent in 2021–22 (Lafortune and Guinan 2024). As these funds expire, overall spending may fall, depending on the change in base state funding in the coming years.
Spending Has Shifted toward Benefits and Non-Instructional Salaries
Teaching is, of course, a core function of the education system. Substantial shares of district budgets go to staffing, and recent funding increases corresponded to a substantial increase in spending on staff salaries and benefits: over $6,000 more per student from 2012–13 to 2023–24 ($9,530 to $15,830). We can separate this spending along two dimensions: salaries versus benefits, and certificated (teachers, counselors, librarians, and any other staff required to hold a teaching credential or other specialized certification) versus classified (including teaching aides, paraprofessionals, clerical staff, custodians, and bus drivers).
This reveals differential increases in spending since 2012 (Figure 1). First, benefit spending has roughly doubled, mainly due to state pension reform and rising benefit costs. Second, increases for classified staff have been more pronounced than increases for certificated staff. Spending on salaries in both categories increased by roughly $1,500 per student in this period, but the starting levels were very different. In 2012, spending on certificated salaries was $5,300 per student, while spending on classified staff salaries was $1,930 per student. There has been a proportional shift to spending more on benefits and salaries for non-credentialed staff. Importantly, this is not primarily driven by higher individual salaries, but by higher staffing levels.
Spending per student has increased substantially since 2012—overall, and in all major staffing categories
Spending per student
SOURCE: California Department of Education.
NOTES: Average spending per student, across districts, weighted by student enrollment. “Cert.” stands for “certificated,” and includes those with a certification, including teachers, counselors, administrators, librarians, and nurses. “Class.” stands for “classified,” and includes support and other staff roles, such as aides, administrative assistants, maintenance and janitorial staff, and bus drivers. Excludes districts enrolling fewer than 250 students, those with zero attendance, and outliers (spending far above or far below per student spending averages per year). Charter schools fiscally included on a district’s general fund are included; others are excluded.
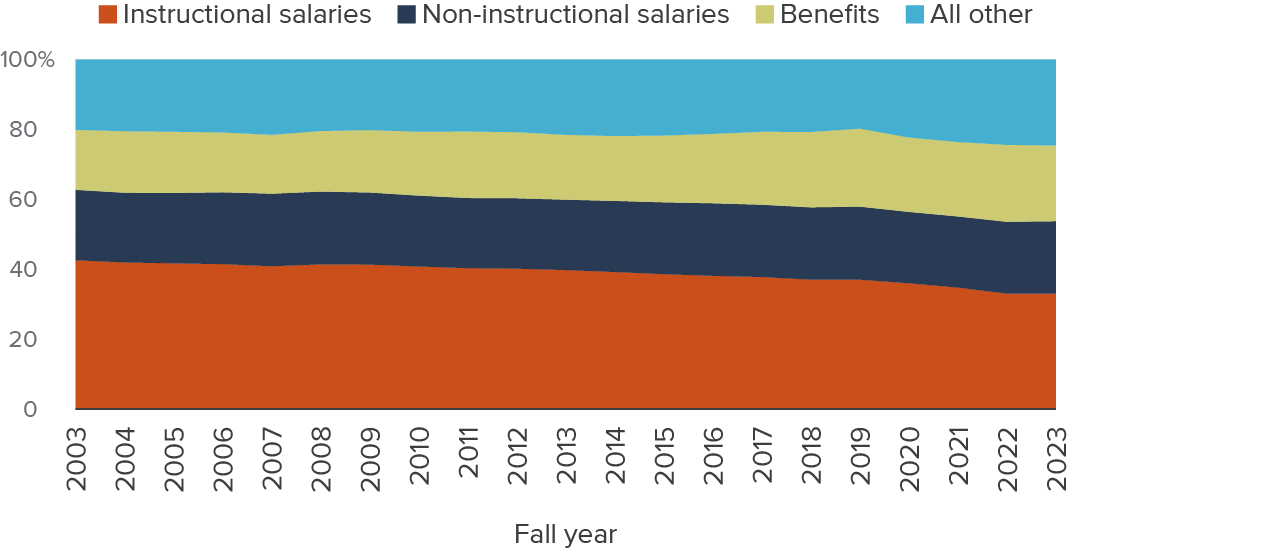
Next, we group spending into instructional and non-instructional salaries, benefits, and all other (Figure 2). Instructional salaries include teachers, other educators with a teaching certification (e.g., librarians), and salaries of classified staff that act in instructional roles (e.g., teachers’ aides). Non-instructional salaries include all other staff salary spending. Other spending includes all other spending, including instructional materials, maintenance and operations, and outside contracts.
Here, the shift toward spending proportionally less on teachers and other certificated staff is more apparent. As a share of spending, total salary spending has declined from roughly 62 percent of spending in the early 2000s to less than 54 percent in 2024. This is entirely driven by spending on instructional salaries, which has shrunk from nearly 43 percent in 2003 to 33 percent in 2023. About two-fifths of the total decline occurred in the four years since the onset of the pandemic.
Instructional salary spending has declined as share of overall spending
Share of current spending
SOURCE: California Department of Education.
NOTES: Spending shares based on current spending, by fall year. Average across districts, weighted by student enrollment. Excludes districts enrolling fewer than 250 students, those with zero attendance, and outliers (spending far above or far below per student spending averages per year). Charter schools fiscally included on a district’s general fund are included; others are excluded.
Non-instructional salaries have held steady at 20 to 21 percent of the budget since 2003. Benefits spending has risen slightly as a share of the budget, increasing immediately following the Great Recession and climbing steadily over the following decade, from 17 percent in 2003 to 22 percent by 2024.
The residual increase—roughly 4 percent over the past decade, and 5 percent since 2003—comes from other spending. Part of this increase occurred during the pandemic, which may partly reflect increased reliance on contracted staff, additional support services, and the purchase of new technology and materials with stimulus dollars (Slovick et al. 2024). This spending varies significantly across districts, reflecting the flexibility allowed by California’s funding system.
This modest but meaningful shift toward non-instructional spending does not mean that less is being spent on teachers and other instructional staff. Rather, it indicates that while more money is being spent on teacher salaries, a smaller portion of each additional dollar invested in recent years has gone toward teachers. What should we make of this change? It is perhaps unsurprising that districts chose to increase spending on programs and services that may have been cut during the Great Recession, especially after being given greater spending flexibility under LCFF. Additionally, districts may have been reluctant to spend one-time pandemic stimulus dollars on ongoing expenses like staff.
Spending Trends Were Similar in High-Need Districts that Received Additional Targeted Funding
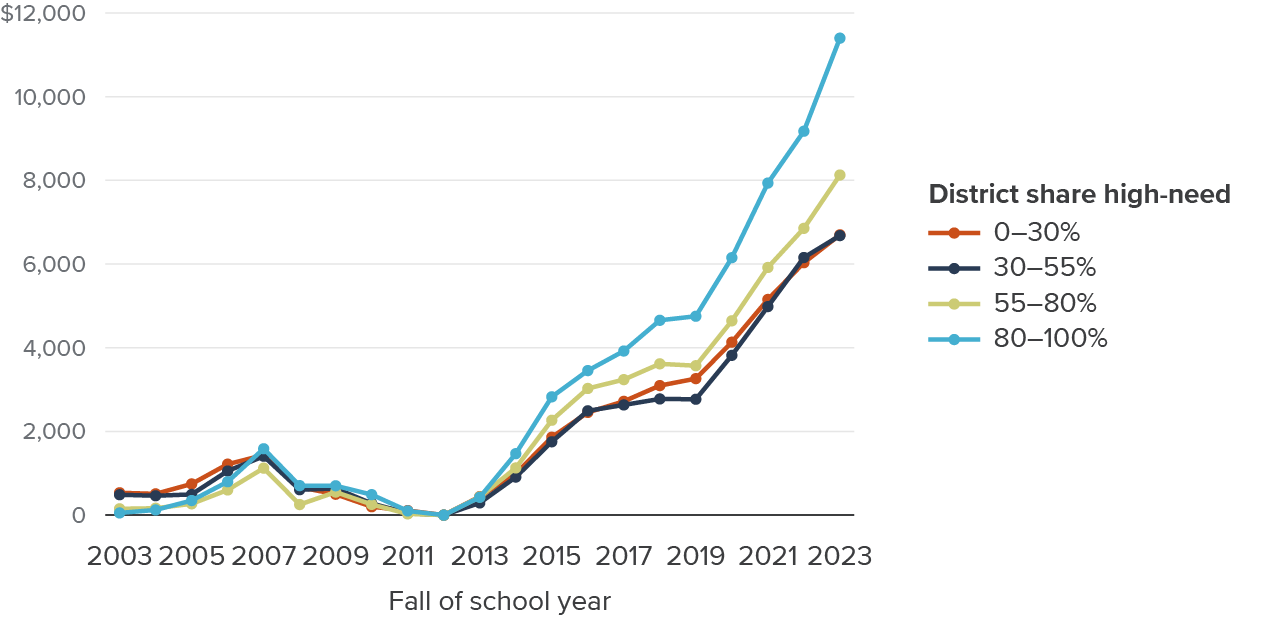
In 2013 the Local Control Funding Formula (LCFF) replaced a system of roughly flat grants and a complicated array of restricted programs known as “categoricals” with a simplified system that allocated additional funding to districts based on the number of high-need students they serve (Technical Appendix Figure B1). LCFF also increased district flexibility, on the grounds that greater local control could help meet the diverse needs of the roughly 1,000 districts in California. This meant that as state revenues rose over the subsequent decade, funding increased more sharply in high-need districts (Figure 3). From 2012 to 2023, spending in districts with more than 80 percent high-need students rose by over $11,000 per student. In districts with less than 55 percent high-need students, funding increased by roughly $7,000 per student.
Faster increase in spending for higher-need districts
Spending per student, relative to 2012
SOURCE: California Department of Education.
NOTES: Spending per student excludes capital, debt service, and other non-TK–12 student spending In inflation-adjusted (2024$) dollars. UPP is the “unduplicated pupil percentage” of high-need students in a district. Average across districts, weighted by student enrollment. Excludes districts with enrollment less than 250 students, those with zero attendance, and spending outliers far above or far below per student spending averages per year. Charter schools fiscally included on a district’s general fund are included; others are excluded.
How did funding increases and increased flexibility affect spending on teachers and staff, and other key teacher metrics like experience and credentials? To isolate the impacts of LCFF from the subsequent one-time funding allocated during the pandemic, we examine the relative changes in various spending and teacher staffing metrics (see technical appendix Figures B2–B11). We compare metrics across districts with greater and lower shares of high-need students. Districts are grouped into buckets. First, those with high-need enrollments below 30 percent, then others with shares between 30 and 55 percent. Districts where more than 55 percent of students are high-need receive additional targeted funding through the LCFF’s concentration grant (Technical Appendix Figure B1). We split these districts into those where 55 to 80 percent of students are high-need and others where high-need shares are 80 percent and above. We estimate the average relative change in spending between these districts and those with fewer high-need students, averaged over the entire decade from 2013 to 2023. We describe this method in greater detail and provide additional tables and figures in Technical Appendix B.
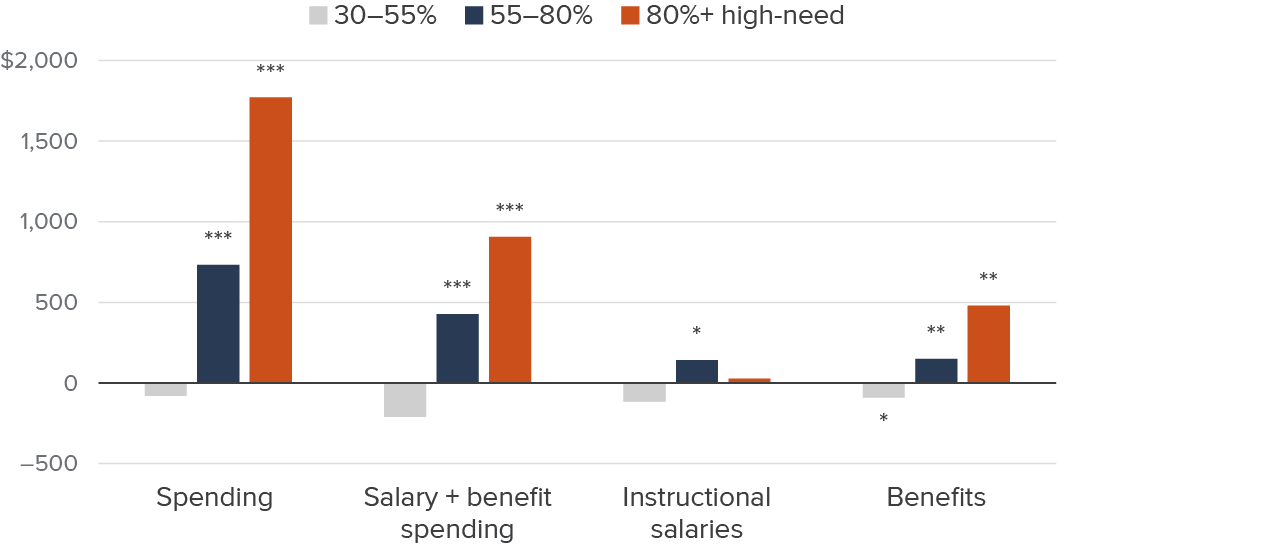
Figure 4 shows comparisons across several spending outcomes. Again, the numbers reported below are changes relative to districts that are less than 30 percent high-need. Differences are averaged over all LCFF years (2013–14 to 2023–24). First, we can see that under LCFF, there have been significant increases in spending overall and on staff salaries and benefits. For the highest-need districts, annual per student spending increased by an average of $1,771 more over the past decade than in lower-need districts; increases in spending on staff salaries and benefits were roughly $906 higher. For 55 to 80 percent high-need districts, relative spending increases were not quite half as large: $732 per student (spending) and $427 per student (salary + benefit spending). Meanwhile, there has been no significant relative change for districts with more moderate need (high-need share between 30% to 55%).
Salary and benefit spending has increased in high-need districts—but not instructional salaries
Relative change in spending
SOURCE: California Department of Education; Authors’ calculations.
NOTES: Differences-in-differences estimates for post-LCFF period, relative to lowest-need districts (0%–30% UPP) reported. Vertical axis shows current spending (excluding, most notably, capital and debt service) in inflation-adjusted dollars per student. Stars (*, **, ***) denote statistical significance (10%, 5%, 1%). See Technical Appendix B for full detail. Excludes districts with enrollment less than 250 students, those with zero attendance, and spending outliers far above or far below per student spending averages per year. Charter schools fiscally included on a district’s general fund are included; others are excluded.
However, when we look only at instructional spending we see no statistically significant increase for the highest-need districts (80%+), and only a very small increase ($142 per student) for those that are 55 to 80 percent high-need. Conversely, benefit spending increased more sharply in higher-need districts ($481 more per student in those 80%+ high-need).
Teacher salaries have grown slowly, and remain lower than wages in other professions
In addition to overall funding trends, pay rates for individual teachers are a key concern—particularly for districts, which struggle to recruit and retain staff. Low salaries are often cited as a major reason for leaving the teaching profession. At a minimum, teachers in California are required to earn a bachelor’s degree in order to obtain a teaching credential. Earnings for college graduates who majored in education are lower than those for most other majors (Cuellar Mejia et al. 2025). More broadly, Allegreto (2025) finds that California teachers tend to earn less than people in other professions with similar levels of education and experience. Further, most district salary schedules tie pay increases to credits earned through graduate degrees or other learning experiences, and educational costs like college tuition and student loans can be high. Other living expenses like rent, utilities, and groceries put even more pressure on budgets. The relatively low pay and potentially high costs facing teachers contribute to district staffing challenges—and, in turn, impact the educational experiences of the state’s students.
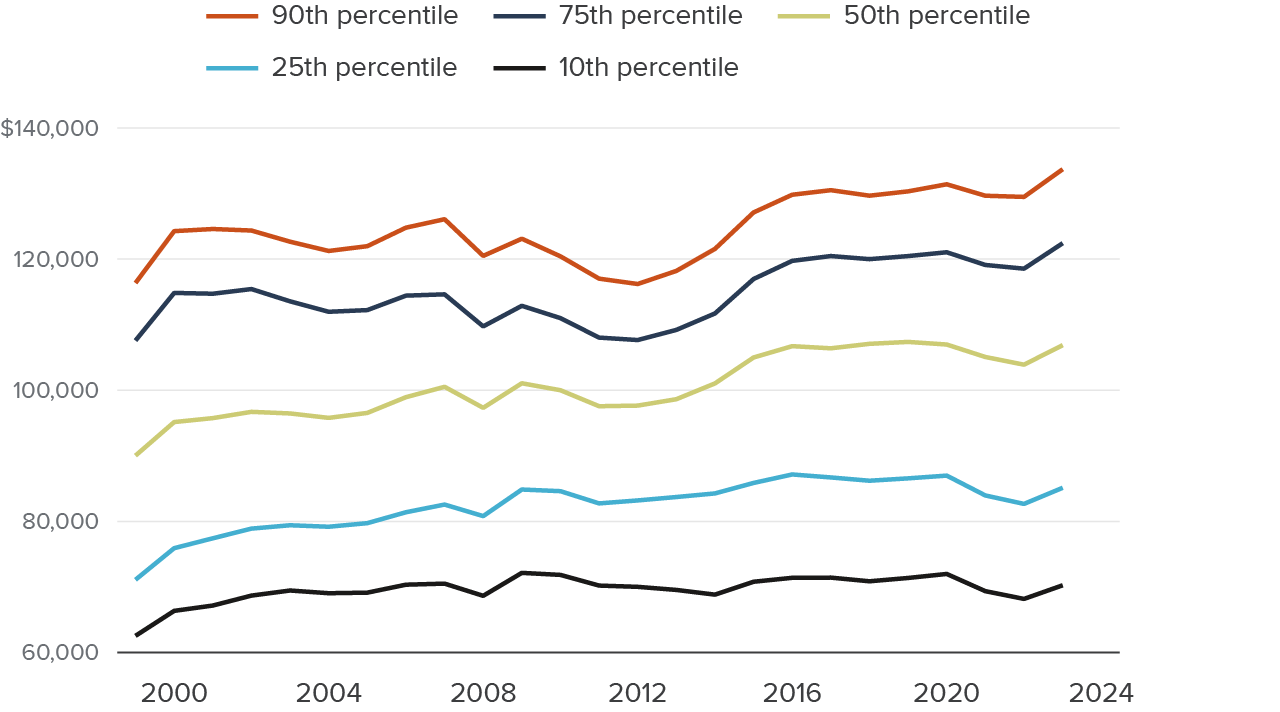
According to state data on district salary schedules, the average teacher salary in California is just over $100,000 (Figure 5). The share of teachers earning the minimum salary in their districts—about $66,000, on average, in 2024—has more than tripled since it was at its lowest in 2011. There is substantial variation in teacher pay along many dimensions. Regional differences in the cost of living play a role, as do differences in education and experience among individual teachers. Salaries declined substantially after the 2007 financial crisis but recovered after state funding increased in 2013. The largest swings in salary levels were at the top of the distribution—teachers with salaries in the top 25 percent saw major declines and growth in their pay during and then after the recession.
Salaries have grown modestly, with the largest increases concentrated at the top of the scale
Annual salary (2024$)
SOURCE: California Department of Education.
NOTE: Statewide percentiles, excluding bonuses and non-salary schedule payments. Adjusted for inflation to 2024$.
The state’s teaching workforce has a wide range of experience, education, and other credentials that are reflected, in part, by differences in salaries. We also see that differences in pay are larger at the lower end of the salary distribution but taper off near the high end. Over time, the distribution of salaries has largely remained stable, though salaries near the top have grown slightly faster in recent years. This could reflect higher salaries in general or a compositional shift of the teacher workforce toward higher levels of experience and credentials. We also find mixed evidence of salary increases in higher-need districts following LCFF: while average salaries increased faster in higher-need districts following LCFFs introduction (Technical Appendix Figure B10), starting salaries did not (Technical Appendix Figure B11).
Pay rates for new teachers influence students considering whether to enter the profession and the ability of districts to increase staffing levels. Median starting salaries were about $62,000 in 2023–24 and have not gone up and down over the past two decades as much as pay rates higher up in the distribution (Technical Appendix Figure C16). Though a growing share of teachers have been earning their district’s minimum salary, many are able to increase their pay through additional years of work and earning college credits for various learning or professional development experiences. Teachers with a year of credits on top of their required bachelor’s degree earn about 10 percent more than the minimum, while teachers with two additional years earn about 30 percent more. These substantial returns to added schooling have remained stable year to year.
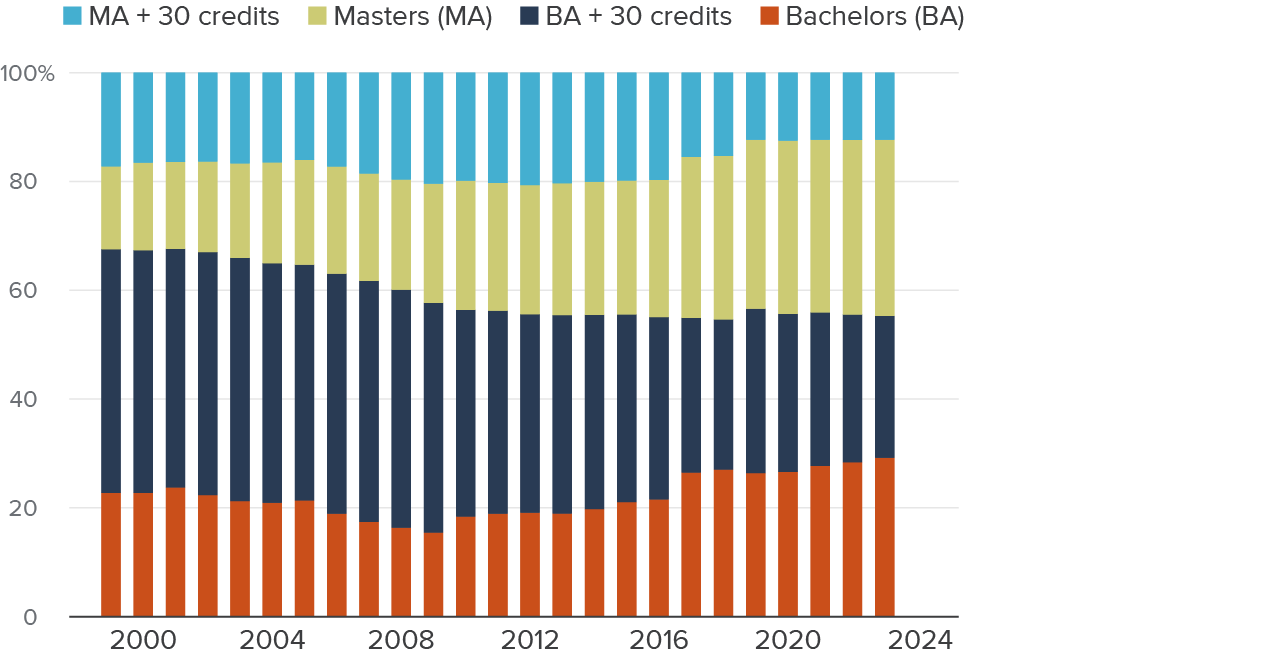
The implications of the trends in teacher education levels shown in Figure 6 below are mixed. The last several years have seen steady increases in the share of teachers with master’s degrees, but fewer teachers are earning the additional credits often explicitly tied to pay increases in district salary schedules. For teachers with both bachelor’s and master’s degrees, the shares earning an additional 30 credits (roughly two years of college coursework) have fallen in most of the years since the 2007 recession.
Greater shares of teachers now hold master’s degrees, but fewer now earn additional educational credits after starting
Share of all teachers
SOURCE: Certificated Staff Data Files. California Department of Education. 1999—2023.
NOTE: A bachelor’s degree is one of several requirements for a teaching credential in California. Teachers can earn additional credits through coursework and other training or professional development. These credits are often tied directly to increases in pay on district salary schedules. For both teachers with bachelors degrees and masters degrees, “+30 credits” indicates 30 or more additional credits (semester hours) earned.
Since salaries are a key factor in teacher recruitment and retention (Hendricks 2014; Hough 2012), adjustments to pay rates may be one way to improve teacher staffing metrics. Wages that are competitive—both across the wider labor market for college-educated workers and across districts with different demographics and challenges—could help increase staffing counts, attract experienced and credentialed teachers with subject-matter expertise, as well as reduce disruptive turnover.
Teacher Staffing Metrics Have Fluctuated in Recent Decades
As school spending and teacher salaries have fluctuated in recent decades, so too have staffing metrics. While most teachers are fully credentialed, recent years have seen slight increases in the share of teachers with substandard authorizations. Student-teacher ratios—class sizes, roughly—have fallen due to a combination of declining enrollment (Lafortune and Prunty 2023) and new teacher hires. The addition of new teachers has contributed to smaller district shares of experienced staff. Figures 7–9 below show trends in these metrics.
It is worth noting that prior to the pandemic, annual data were reported at the staff level with detailed information on experience, credentials, and demographics; recent data, though, only include aggregated counts at the school level or higher. While past data allowed for detailed examinations across multiple staff characteristics (e.g., experience, credentials, education, course assignments, race)—recent data cover only school or district averages of teacher experience and shares of teachers who are new or have only taught for one or two years—characterized throughout this report as novice teachers. Research is mixed but generally finds better student outcomes as teachers gain experience up to the first five years, with additional—albeit smaller—improvements for several years after that (Kini and Podolski 2016).
The Great Recession Had a Significant Impact on Teacher Staffing Metrics
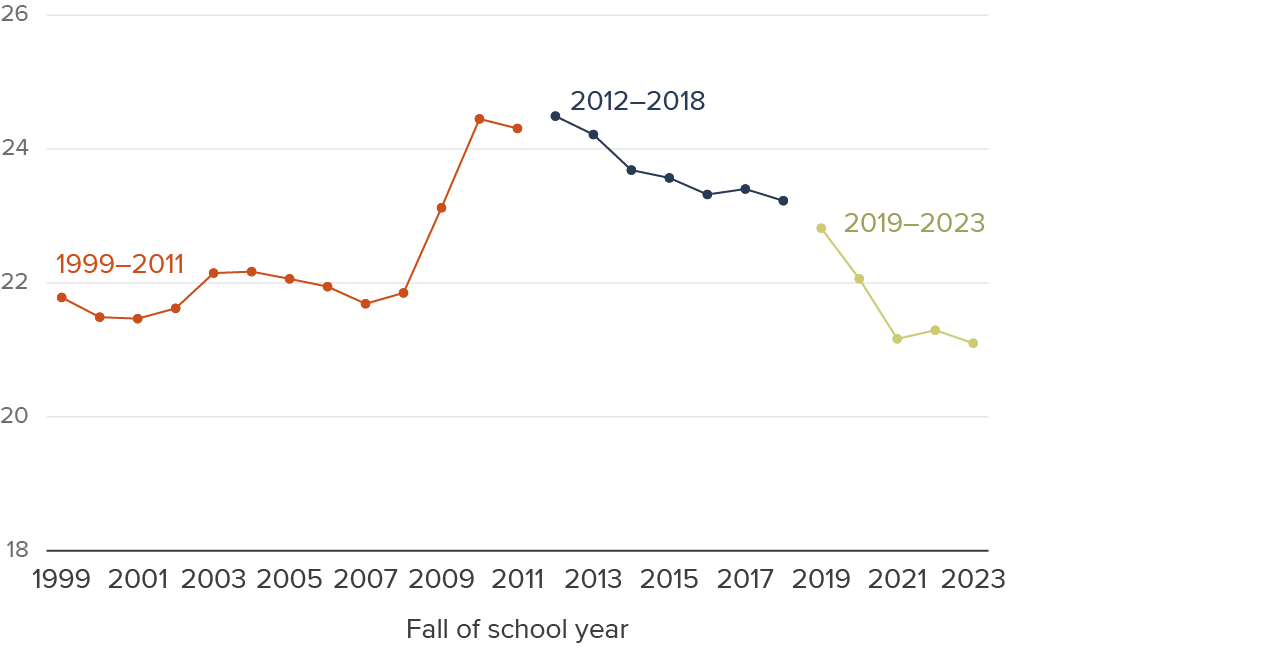
The number of students per teacher increased substantially following the Great Recession, amid widespread teacher layoffs (Kraft and Bleiberg 2022). Nevertheless, overall ratios have been fairly consistent over time: between 21 and 25 students per teacher (FTE), with current levels slightly below pre-recession levels (Figure 7).
Student-teacher ratios have largely returned to mid-2000s levels after increasing sharply during the Great Recession
Students per teacher
SOURCE: California Department of Education.
NOTES: Average students per teacher FTE in each district, weighted by student enrollment. Different colors denote different data file conventions across years, which may not be exactly comparable. Excludes non-classroom-based teacher assignments.
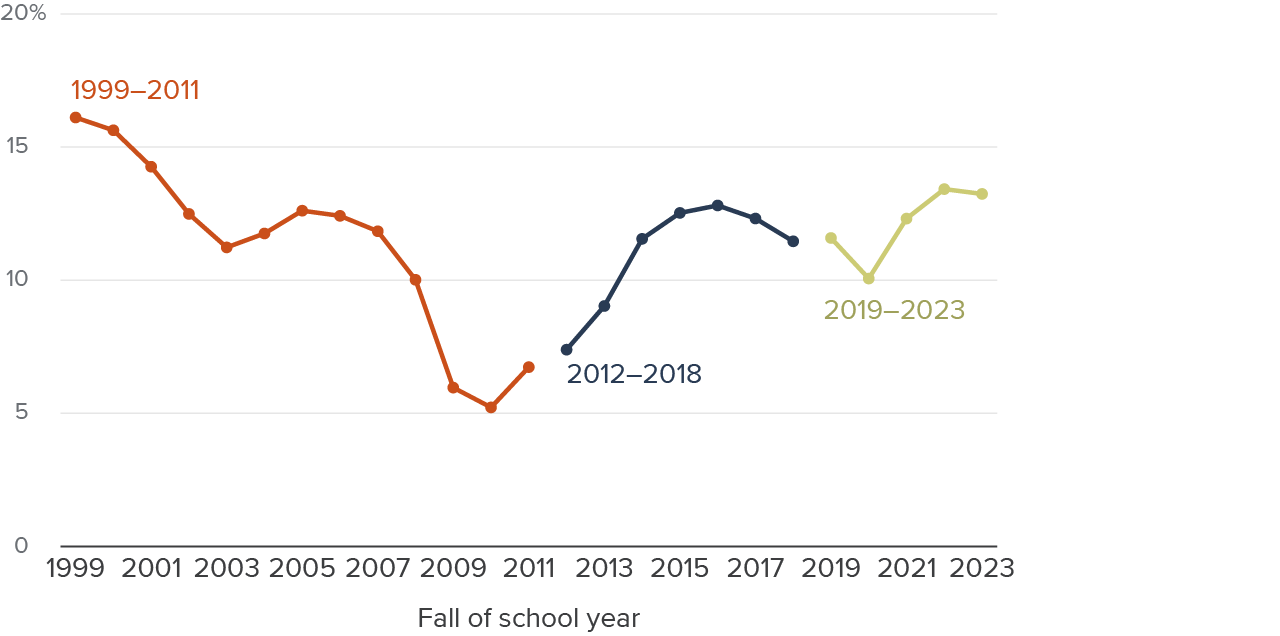
Changes in the share of novice teachers roughly mirror the trend in staffing levels. Due to staff layoffs and reduced hiring, the share of inexperienced teachers—second-year teachers in particular—fell significantly during the Great Recession. Statewide, the number of classroom teachers fell by over 30,000 (Technical Appendix Figure C1). Then, as the budget recovered in the early 2010s and hiring resumed, the share of novice teachers increased (Figure 8). Notably, this increase has not abated as state and federal funding increased in recent years: after small declines just before and in the first year of the pandemic, the share of novice teachers was nearly 14 percent in 2023–24, higher than at any point since 2001. District averages in teacher experience—here using total years—show similar trends (Technical Appendix Figure C2). Average teacher experience rose most quickly during the recession, from roughly 12.5 to 14 years. Average experience levels have remained high ever since.
The share of students taught by novice teachers has climbed in recent years
Share novice
SOURCE: California Department of Education.
NOTES: Average share of novice teachers (%), weighted by student enrollment. Different colors denote different data file conventions across years, which may not be exactly comparable. Excludes non-classroom-based teacher assignments.
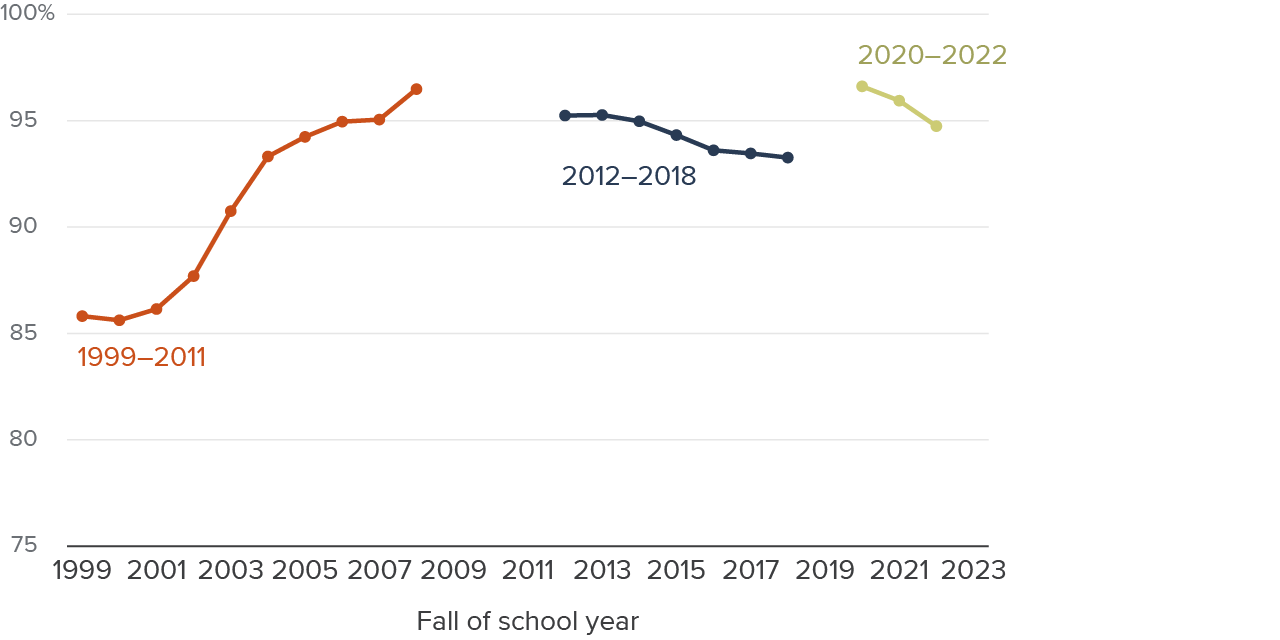
Figure 9 reports the share of fully credentialed teachers by year. After a notable increase in the early 2000s, this has remained around 95 percent, with only small declines initially after LCFF was enacted in 2013. The share peaked at about 97 percent during the pandemic and has fallen slightly since to 95 percent.
More than nine in ten students are taught by fully credentialed teachers
Share fully credentialed
SOURCE: California Department of Education.
NOTES: Average share fully credentialed teachers, weighted by student enrollment. Different colors denote different data file conventions across years, which may not be exactly comparable. Excludes non-classroom-based teacher assignments.
LCFF Funding Has Had Inconsistent Effects on Teacher Staffing Metrics in High-Need Districts
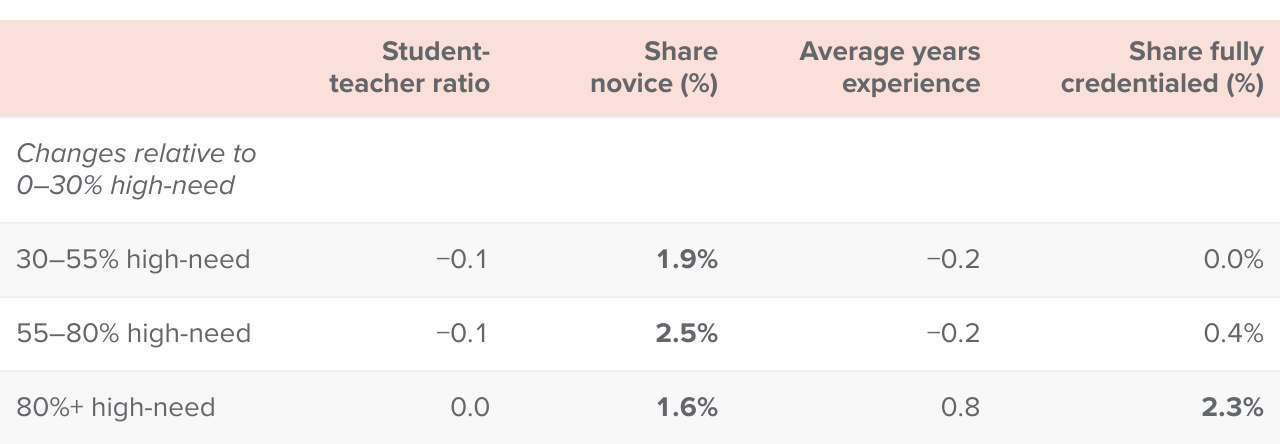
We now look at the impact of targeted LCFF funding on teacher staffing metrics in high-need districts relative to districts with few high-need students (Table 1). First, changes in student-teacher ratios are small and statistically insignificant (less than 0.25 students per teacher, on average). These are very small changes in the context of the literature on class sizes, which generally (but not consistently) finds positive effects for more substantial reductions. Second, we see a relative increase in the share of novice teachers in higher-need districts of roughly 2 percentage points. Given the pre-LCFF share of roughly 7 percent, this amounts to a substantial 20 to 35 percent increase. However, we see no significant relative changes in average years of teacher experience.
Notably, this is not solely due to an increase in new teacher hires in the initial years of LCFF. In fact, we find that these differences emerged gradually and continued to increase after the full implementation of LCFF and during the pandemic (Technical Appendix Figure B8). The share of novice teachers grew substantially following LCFF implementation, as funding increased and hiring resumed following the Great Recession, and has continued to grow in higher-need districts even after the pandemic. Finally, we see a modest increase in the share of fully credentialed teachers in the highest-need districts, by about 2 percentage points.
Relative changes in staffing metrics across districts of varying need under LCFF
SOURCES: California Department of Education; authors’ calculations.
NOTES: Bold indicates statistically significant estimates at the 5 percent level. Percentage point changes shown for share novice and share fully credentialed. Estimates via linear regressions correspond to equation (1) in Technical Appendix B. Standard errors clustered by district. Student-teacher ratio is given by dividing district student enrollment by the total count of full-time equivalent teachers. Novice teachers are defined as those in their first or second year of teaching.
These results show that substantial per student investments in the highest-need districts in California have led to small and inconsistent relative changes in teacher spending and staffing. Instructional salaries (Figure 4) and student-teacher ratios (Table 1) show no statistically significant relative change. The share of credentialed teachers has risen modestly—but so has the share of novice teachers. Given the stronger link in the research literature between experience and student outcomes than between credentials and student outcomes, these changes may indicate a very small relative decline in teacher quality in higher-need districts—although this may be a short-term outcome, assuming new and novice hires stay on long enough to gain experience.
Where then, is this spending going if not to improving teacher quality (or quantity)? As discussed earlier, the shift toward higher benefit spending and higher spending on non-instructional staff and services is even more pronounced in higher-need districts. Indeed, this may reflect local preferences in higher-need districts for additional support staff, services, and resources. Prior research finds that higher LCFF spending in higher-need districts has had positive impacts on student outcomes (Johnson 2023; Lafortune, Herrera, and Gao 2023). Still, the fact that we observe minimal changes in teacher staffing metrics and instructional spending despite large spending increases suggests that the weighted funding formula under LCFF has not led to differential improvements in teacher quality or class size for high-need students. However, the reform may have improved student-staff ratios in support and other non-instructional areas. More research is necessary to understand the impacts of these staffing patterns on student outcomes.
Notable state investments outside of LCFF aim to improve teacher workforce pipelines
These trends coincide with significant new investments in the teacher pipeline in recent years. In the past decade, the state has invested more than $1.6 billion in mostly one-time programs designed to attract, train, and retain high-quality teachers (for a non-exhaustive list, see Technical Appendix D). Through these efforts, the state has seen a modest increase in the number of newly prepared teachers (Carver-Thomas, Leung-Gagné, and Jeannite 2024).
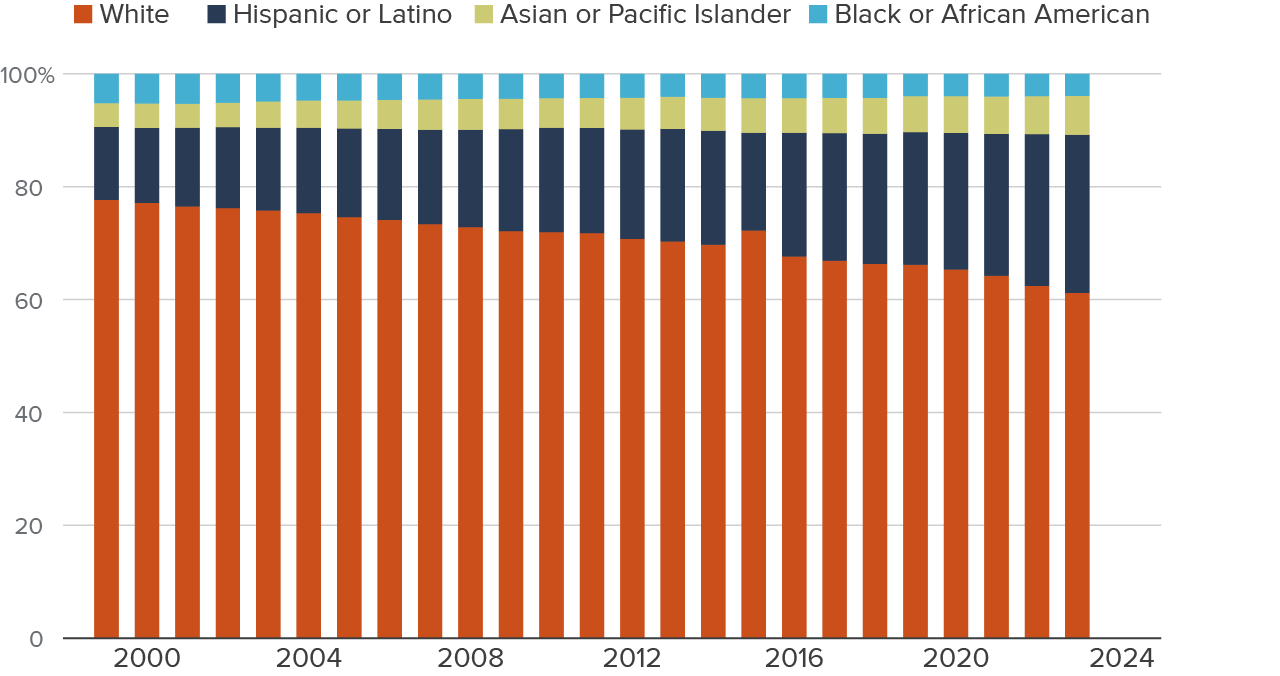
Bolstering the teacher pipeline is also meant to expand access to the profession and diversify the workforce, a strategy found to have promising results. Prior research has found that some students perform better with a teacher of the same race; the evidence is strongest and most consistent for Black students (Egalite 2024; Redding 2019). While recent data show that most teachers are white, that share has fallen steadily from about 78 percent in 1999 to just above 60 percent in 2023–24. The share of Black teachers is small and shrinking, but Asian American and Latino teacher shares are trending upward. Latino teachers make up about 20 percent of the workforce, while the share of Asian American teachers is almost 8 percent (Figure 10). About three in four teachers are female—a share that has remained virtually unchanged since 2003.
While most teachers are white, the share of Latino teachers has grown substantially in recent years
Share of all teachers
SOURCE: Certificated Staff Data Files. California Department of Education.
However, attracting fully qualified teachers to the workforce remains a problem. The share of teachers with limited, temporary, provisional, or intern credentials (“substandard”) tripled between 2013 and 2023, making up more than half of all new California teaching credentials issued in 2023 (Carver-Thomas, Leung-Gagné, and Jeannite 2024). Notably, about 10 percent of recently hired teachers went through a residency pathway, in part due to recent state investments. These pathways may allow for improved recruitment of a more diverse teaching force, and are viewed as highly effective by participants and eventual employers (Yun and Fitz 2025).
Research has found positive effects of some programs—notably, the Teacher Residency Grant Program, Golden State Teacher Grant, and National Board Certified Teacher (NBCT) Incentive Program—on teacher recruitment and preparation (Carver-Thomas, Leung-Gagné, and Jeannite 2024). Conversely, the LAO notes that there is limited evidence on the effect of these recruitment and retention programs on existing teacher shortages (LAO 2025).
Disparities in Teacher Staffing Metrics Vary Depending on How They Are Measured
Disparities in teacher quality, staffing levels, credentials, and other characteristics are often measured across schools and districts. Research has found that schools with more high-need students tend to have fewer fully credentialed and appropriately assigned teachers—particularly in math and science (Carver-Thomas, Leung-Gagné, and Jeannite 2024). Gaps also exist across schools in the same districts, with smaller class sizes but lower-paid, less-experienced, and fewer fully credentialed staff at less-affluent schools (Lafortune 2019). How significant are these gaps? In this section, we use data from 2022–23 from the Teacher Assignment and Monitoring Outcomes (TAMO) data via the California Department of Education (CDE) to characterize access to teachers of varying characteristics across schools and subject areas.
Using the TAMO data, we continue to examine student-teacher ratios, experience, and credentials. We also consider an additional teacher staffing metric: clear teaching assignments. While holding a teaching credential represents an important baseline qualification, a clear assignment indicates that the teacher is fully authorized to teach the course subject and, in some cases, particular student groups like English learners or students with disabilities.
Disparities in Teacher Staffing Metrics Are Small on Average
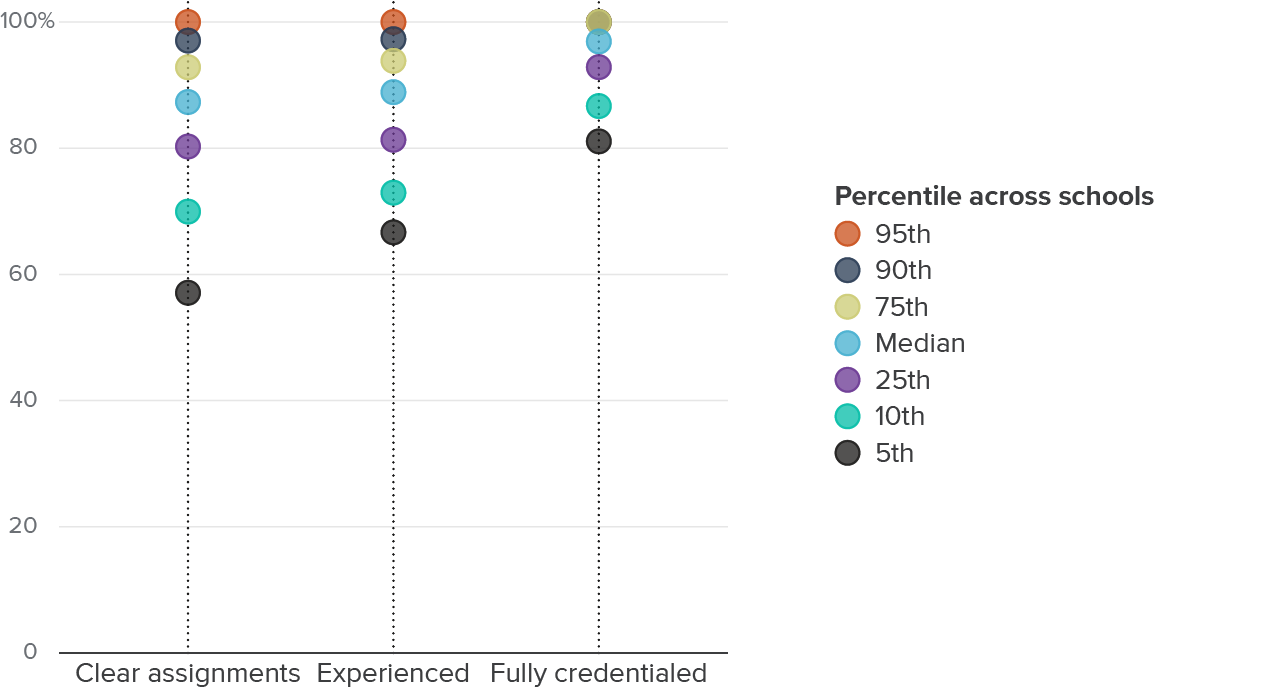
There is notable variation in teacher staffing metrics across the state. The student-weighted distributions across metrics show, for example, that the median student is at a school where nearly 89 percent of teachers have three or more years of experience, 97 percent have a full credential, and roughly 87 percent are in clear assignment (Figure 11). But one in four students attends a school where fewer than 80 percent of teachers are in a clear assignment. There are significant outliers—dozens of schools where less than half of teachers are fully credentialed, and hundreds where less than half are in clear assignments. There is also variation in student-teacher ratios: while most are around 20 to 23 students per teacher, nearly 5 percent of schools have ratios at or below 17—and about 5 percent of schools have 27 or more students per teacher (Technical Appendix Figure C3). Given the wide range of teacher staffing metrics, we need to consider which students are enrolled in schools with better or worse teacher staffing metrics.
Teacher experience and credentials vary substantially across schools
Percent of FTEs
SOURCE: California Department of Education.
NOTE: Distribution across traditional schools in 2022–23 data weighted by school enrollment.
Prior research that finds larger differences in teacher experience and credentials across student groups is largely focused on comparing schools or districts with different demographics. These comparisons miss the important nuance that many high-need students attend schools with lower overall shares of high-need students and also that schools with many high-need students often serve substantial numbers of students that are not themselves high-need. We use student-weighted school averages in order to examine school staffing metrics experienced by the average student in each subgroup. To the extent that there are differences across classrooms within schools, though, we cannot measure these in the recent data.
We first examine student-teacher ratios across student subgroups (Figure 12). Ratios are slightly smaller for high-need student groups than for other students. For example, student-teacher ratios were 21.7 in 2022–23 for low-income students, who are proxied by enrollment in the Free and Reduced-Price Meals (FRPM) program. In comparison, average student-teacher ratios are 22.2 for non-FRPM students. Differences are also small for English learner (EL) students and across racial and ethnic groups—within one student per teacher of the statewide average. Though these subgroup differences are generally minor, California notably has some of the highest student-teacher ratios in the country: the statewide average across all schools is 21.8 students per teacher, compared to the national average of 15.1 (Digest of Education Statistics 2023).
Student-teacher ratios are slightly lower for high-need student groups
Student-teacher ratio
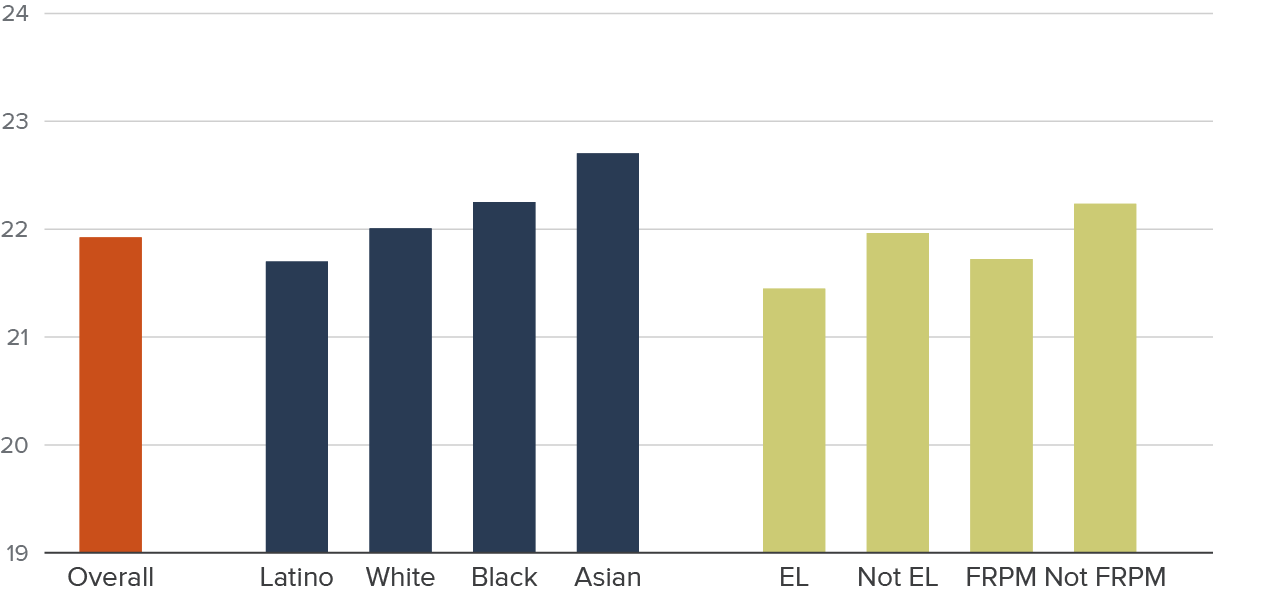
SOURCE: California Department of Education Teaching Assignments and Monitoring Outcomes; Authors’ calculations.
NOTES: 2022–23 average across students of a given subgroup classification, weighted by student subgroup enrollment. EL denotes English Learner. FRPM denotes eligibility for free and reduced-price meals. Only racial groups with the largest enrollment are shown; American Indian or Alaska Native and multiracial students are excluded. “Asian” includes Asian, Filipino, and Pacific Islander. Only traditional schools are included. See Technical Appendix A for additional detail on data sources.
Next, we look at the difference in the share of FTEs across teacher staffing metrics for each student group compared to all other students (Figure 13). Differences in the share with clear teaching assignments are modest across student groups. Low-income (FRPM) students are only slightly less likely to have teachers with clear assignments (83% vs 86%), and there are no differences for EL students. There is greater variation by race and ethnicity. The school share of teachers with a clear assignment is lower for the average Black or Latino student—4 and 1.5 percentage points lower, respectively. Asian American students have the highest share, 4 percentage points greater than non–Asian American students, and there is a very small difference (0.5%) between white and non-white students.
We see similar trends when we consider the share of teachers who have any credential, with differences that are generally smaller. The overwhelming majority of teachers are fully credentialed across all student groups (Technical Appendix Figure C8).
Low-Income, EL, Black, and Latino students attend schools with slightly worse teacher staffing outcomes
Difference in FTE share compared to all other students
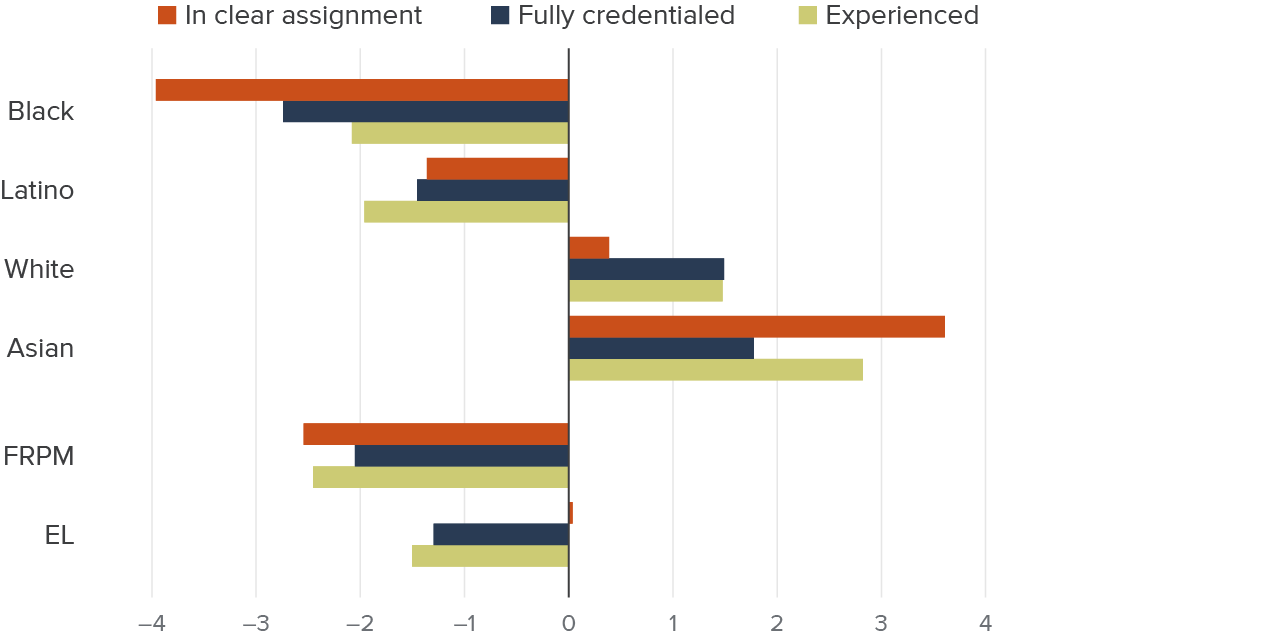
SOURCE: California Department of Education.
NOTES: Percentage point difference in share of FTEs across schools, weighted by student subgroup enrollment, for students in subgroup compared to all other students. Average Data from 2022–23 and includes only traditional schools. EL denotes English Learner. FRPM denotes enrolled in free and reduced-price meals. Only racial groups with the largest enrollment are shown; American Indian or Alaska Native and multi-racial are excluded. “Asian” includes Asian, Filipino, and Pacific Islander “Experienced” teachers are those with three or more years of experience.
Though student-teacher ratios were slightly smaller for high-need students, their teachers are slightly less likely to be experienced. EL students have 85 percent of their teachers with three or more years of experience, compared to 87 percent for non-EL students. For low-income students, the share of experienced teachers is 86 percent (vs. 88% for non-low-income) (Technical Appendix Figure C9). Importantly, these differences are relatively small. Recall, though, that experience is defined here as having taught for three or more years, which reflects only a small portion of the distribution of teacher experience. The vast majority of teachers have three or more years of experience (Figure 8), while across districts, average teacher experience is roughly 14 years (Technical Appendix Figure C2).
Schools with the Greatest Staffing Challenges Tend to Serve Higher Shares of High-Need Students
Most schools—and thus, most students—have high shares of fully credentialed, experienced teachers in clear assignments. However, the data also reveal that there are many schools where teachers are much more likely to be inexperienced or without a suitable certification for their teaching assignment. Past research indicates that there are a significant number of these “hard-to-staff” schools in California (e.g., Carver-Thomas et al. 2022). Here, we compare the characteristics of these schools to others with better staffing metrics to describe an alternative view of student group disparities in access to high-quality teaching.
Table 2 compares the demographics of schools at either end of the distribution of several metrics: student-teacher ratio, experience, credentials, and clear assignments. Schools in the top quartile of clear assignments have over 93 percent of teachers in a clear assignment, while the lowest quartile have less than 80 percent. Schools with the highest shares of clear assignments serve fewer low-income students (57% vs 69%), but EL shares are equal to those in districts with the lowest shares clear. The schools with the most credentialed teachers (100% fully credentialed) and those with the most experienced teachers (at least 94% experienced) serve lower shares of low-income and EL students than those with the lowest shares of each metric. Student-teacher ratios are opposite of the trend here with schools that had the lowest ratios serving more low-income and EL students. Finally, schools with the worst teacher staffing metrics generally have higher Black and Latino student enrollment and lower white and Asian American student enrollment than others.
Demographics of schools that have the best and worst teacher staffing metrics
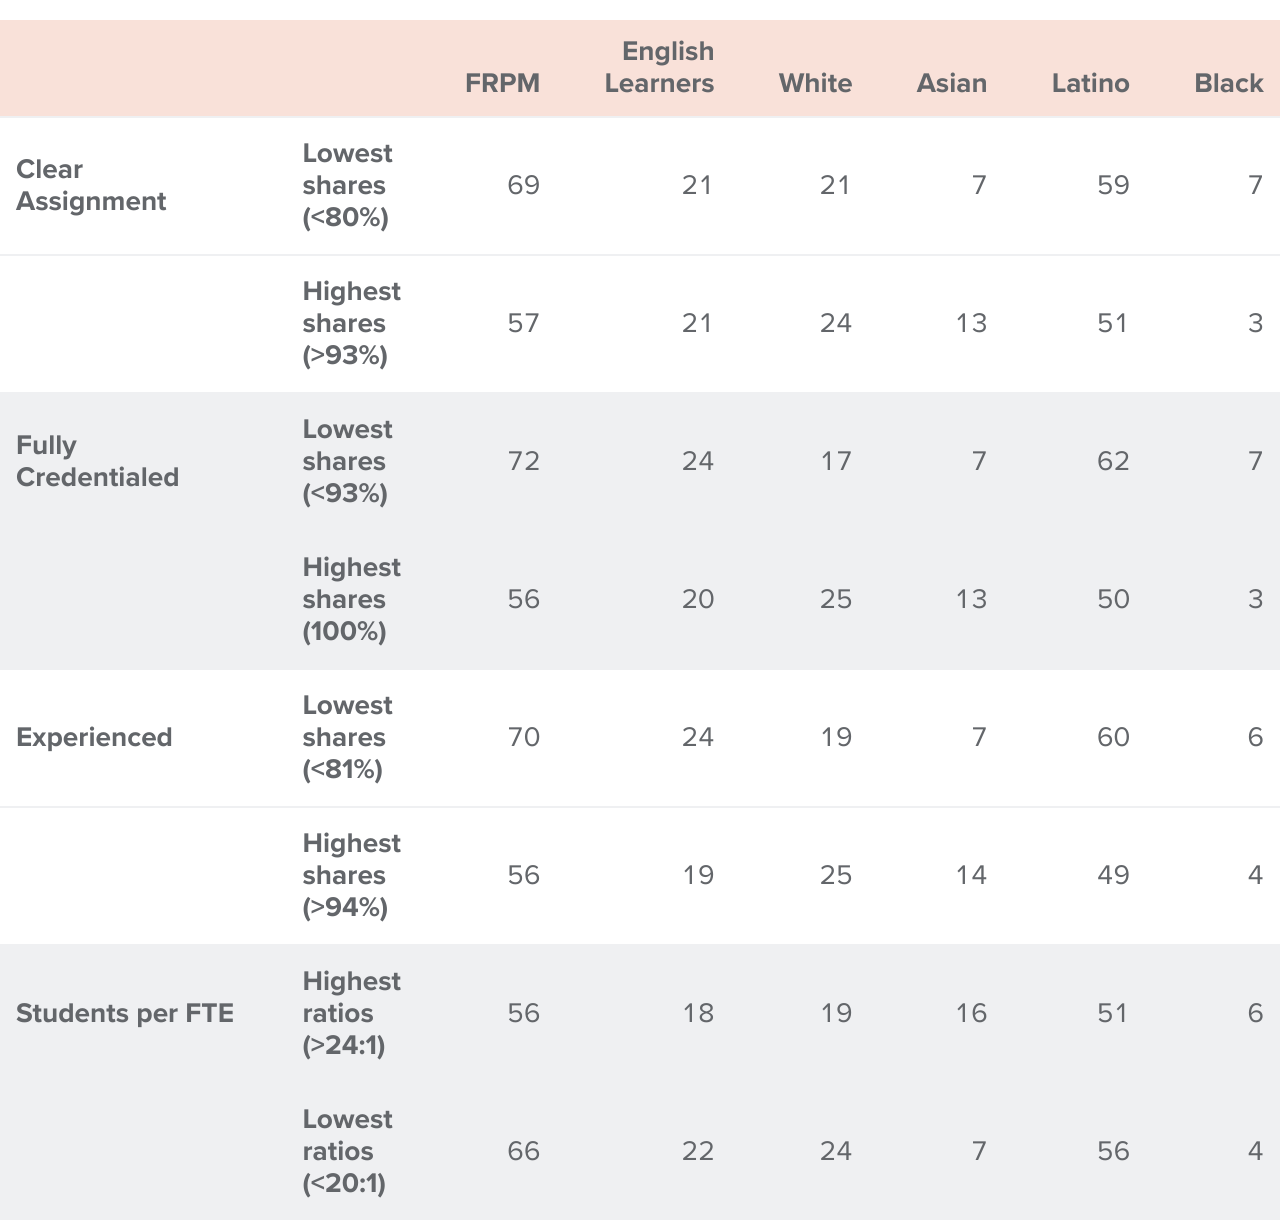
SOURCE: California Department of Education.
NOTES: 2022–23 average across traditional schools where “highest shares”/”highest ratios” denotes the top quartile and “lowest shares”/”lowest ratios” denotes the bottom quartile of the school-level average of each teacher characteristic, weighted by enrollment within quartile. FRPM denotes free and reduced-price meal enrollment, which is used to proxy low-income. Only racial groups with the largest enrollment are shown; American Indian or Alaska Native and multi-racial are excluded. “Asian” includes Asian, Filipino, and Pacific Islander “Experienced” teachers are those with three or more years of experience.
Overall, these data paint a nuanced picture. Student group differences in teacher staffing metrics are quite small on average. Gaps are slightly larger when we compare averages across schools with high and low shares of high-need students (Technical Appendix Figures C11–C12). We see the greatest disparities, however, when we compare schools with the best and worst staffing metrics. These hard-to-staff schools serve greater proportions of low-income students and English learners as well as more Black and Latino students.
Teacher Staffing Challenges Are More Significant in Math and Science
Policy and research discussions of teacher shortages often note that staffing challenges—and inequities across students and schools—vary by subject (McVey and Trinidad 2019). In this section, we consider teacher staffing metrics and student group disparities across some subject areas. Prior research has shown that teachers who are certified to teach a given subject have a greater positive impact on student outcomes (Sancassani 2023; Clotfelter et al. 2010). The median student in middle or high school attends a school where 83 to 86 percent of teachers have clear teaching assignments.
Figure 14 reports the distribution of clear assignments by subject: math, science, English language arts, and all other courses. We only report results for middle and high schools here because the vast majority of elementary school teaching assignments are not subject-specific—the lower grades typically have a single teacher for the full school day (Technical Appendix Figure C13). While the median student has about the same share of teachers with clear assignments across subjects, the top quartile have 96 percent clear assignments for science classes, compared to 68 percent in the bottom quartile, a 28 percentage point difference. Slightly smaller gaps between the top and bottom 25 percent of schools are seen in math and English (23 and 21 percentage points, respectively), and a much smaller gap for all other subjects (15 percentage points).
Incorrect teacher assignments are most frequent in science and math classes. One in ten students attend schools where 41 percent or fewer science teachers are in clear assignments. In math, that number is 50 percent of teachers. Again, these data suggest that the typical student has similarly qualified teachers across subjects, but staffing difficulties are far more prevalent in some subjects.
One in ten secondary school students attend schools where less than half of the math or science teachers have clear assignments
Percent of FTEs
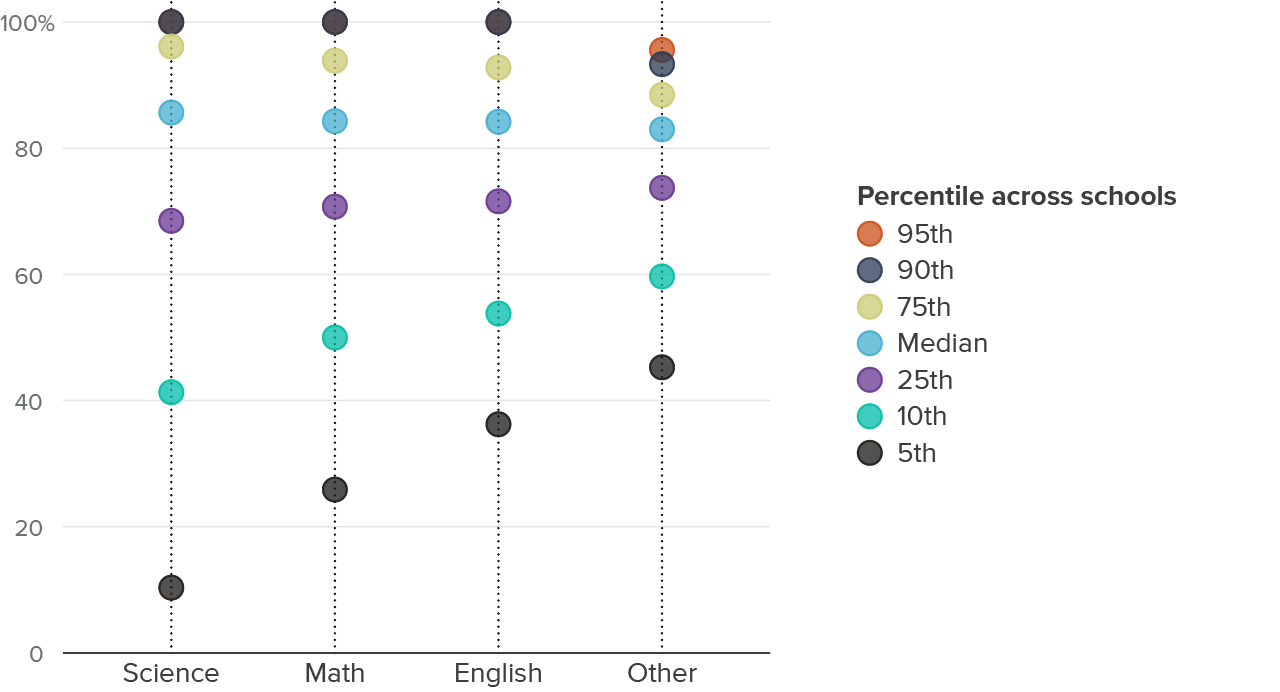
SOURCE: California Department of Education.
NOTES: Weighted by enrollment. Data from 2022–23 and includes only middle and high schools. Excludes non-traditional schools.
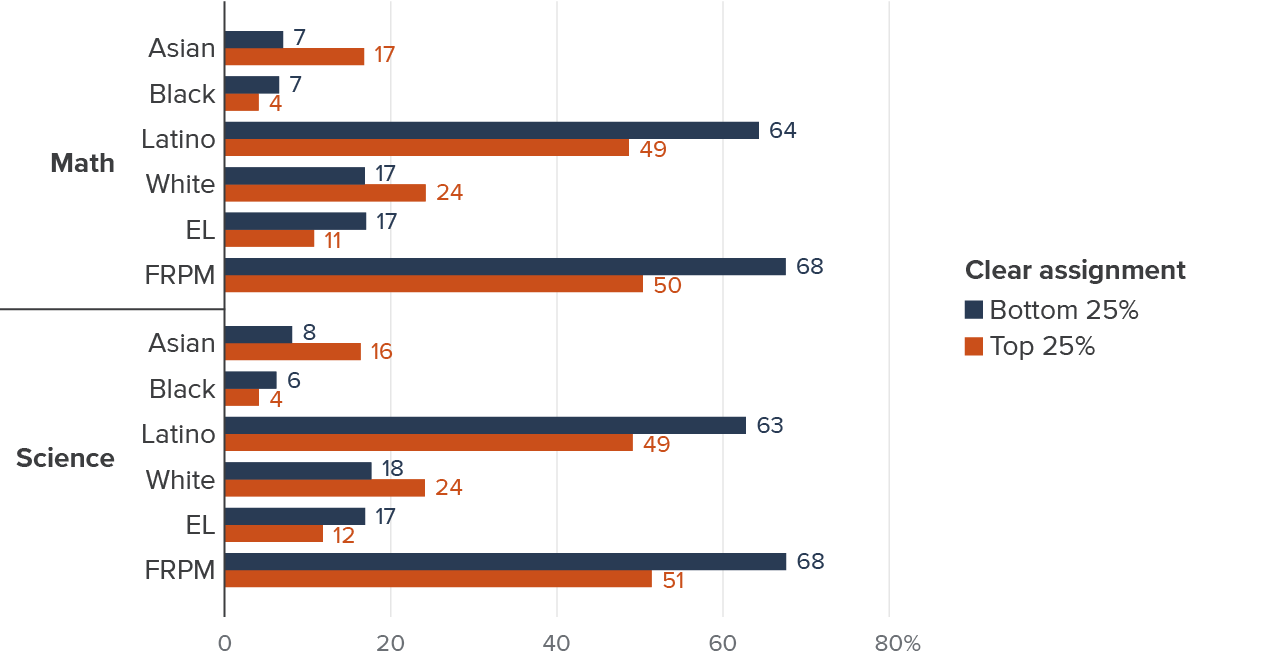
When we turn again to the schools that are “hard to staff” in math and science, we find significant gaps in student demographics (Figure 15). Schools with the fewest clear assignments in math have substantially higher shares of low-income students compared to those with the most clear assignments (68% vs 50% low-income). Similarly, schools in the lowest quartile have a larger percentage of EL students (17% vs 11%). The bottom quartile schools in math tend to have higher shares of Latino (64% vs 49%) and Black students (7% vs 4%), and lower shares of white (17% vs 24%) and Asian American students (7% vs 17%). The same patterns in high-need and racial composition can be seen when looking at quartiles of clear assignments in science courses.
The “hardest-to-staff” schools in math and science have higher shares of low-income and Latino students
Share of student enrollment
SOURCE: California Department of Education.
NOTES: Average across traditional schools in a given quartile of clear assignment shares by subject, weighted by school enrollment. EL denotes English Learner. FRPM denotes enrolled in free and reduced-price meals. Only racial groups with the largest enrollment are shown; American Indian or Alaska Native and multi-racial are excluded. “Asian” includes Asian, Filipino, and Pacific Islander. Data from 2022–23 and includes only middle and high schools.
Overall, this analysis shows that average differences in teacher characteristics may mask important gaps across schools. While high-need students have access to similarly qualified math and science teachers on average, the schools with the fewest clear assignments disproportionately serve high-need populations and students of color.
Conclusion and Policy Implications
California’s education spending has risen substantially in the past decade, bolstered by growing revenues, economic recovery from the Great Recession, and significant additional state and federal investments during the pandemic. Most of this additional spending has gone toward staff salaries and benefits—including teachers, pupil support staff, administrators, aides, and other educators and operational staff. Teachers are a significant part of this spending; however, spending on instructional salaries has been declining as a share of overall spending. Increased investments in support staff and other non-teacher roles—and rising operational costs, most notably benefits—have grown in importance, especially in higher-need districts.
Statewide student-teacher ratios and teacher credentials have improved modestly over the past decade. Yet the share of inexperienced teachers has also risen, in part reflecting new hires in the early years of LCFF. This may also reflect increased difficulties retaining teachers, though we lack the data to make definitive statements about retention. Teacher salaries have increased, with notable gains above the level of inflation in the first few years of the LCFF. Since then, salary levels have roughly kept pace with inflation. However, after adjusting for inflation, average starting salaries are at the same level as they were in the early 2000s, while salaries for those with similar levels of education have grown over the same time period.
When we examine the relative changes in teacher spending and staffing trends across districts that received varying amounts of targeted funding under the LCFF, we find a limited impact on instructional spending or any observable teacher staffing metrics. Instead, we find larger increases in benefit spending, non-teacher salaries, and other operational and materials expenses.
Statewide, nearly all students are taught by a fully credentialed teacher with at least a few years of experience. A lower share of teaching assignments are “clear,” but the proportion remains high, at roughly 87 percent statewide. Teacher staffing metrics do vary slightly across student subgroups. On average, higher-need student groups are in schools with lower student-teacher ratios—but slightly lower shares of teachers that are fully credentialed, in a clear assignment, or experienced. While overall shares of credentialed teachers have increased—arguably due to recent state investments—the relative impact of LCFF and other changes on staffing metrics for high-need districts are less clear.
On average, schools with higher shares of low-income students are less likely to have fully credentialed and appropriately assigned teachers. And “hard to staff” schools—those with lower shares of fully credentialed and correctly assigned teachers—generally serve much higher shares of low-income students. In particular, math and science stand out as more challenging to staff, with lower shares of appropriately assigned teachers and demographic gaps across schools with the lowest and highest clear assignment rates.
Several considerations and policy implications emerge from our findings:
- LCFF funding increases in higher-need districts have so far had little impact on many teacher staffing metrics. We see little relative change in teacher staffing metrics in higher-need districts under LCFF. The evidence suggests a shift toward non-teacher staffing and other services. There is, however, prior research that finds improved student outcomes due to LCFF spending. Given the strong evidence detailing the importance of teacher quality, though, policy efforts to address staffing in more specific and comprehensive ways may be needed to further improve the teaching workforce.
- Disparities in access to qualified teachers are larger when we compare schools rather than student groups. Differences across student groups are small on average. At the same time, there are larger gaps when we look at differences across schools of varying demographics. As a result, efforts to improve teacher assignments, credentials, and experience may have a limited effect on overall student outcome gaps, but have greater potential to reduce gaps between schools and districts with different demographics.
- Efforts to address teacher staffing challenges should focus on specific schools that are persistently hard to staff. Most schools are staffed by fully credentialed and appropriately assigned teachers. But there are still many schools with teachers on substandard qualifications, particularly in math and science. Efforts that are tailored to specific schools—often, in lower-income communities serving higher-need students—could be more effective than broad-based, statewide solutions, like funding formula allocations.
- Addressing lagging teacher salaries could help improve staffing metrics. While recent increases have made up for declines in the years following the Great Recession, starting teacher salaries have not grown in inflation-adjusted dollars since the early 2000s, though recent increases have made up for real declines in the years following the Great Recession. Over the past decade, salaries and salary spending on teachers have grown more slowly than overall spending, and starting teacher salaries have not kept up with the growth in earnings for college-educated workers in general. Efforts to improve teacher staffing and bolster retention—especially at hard-to-staff schools—may require offering higher salaries. But absent additional funding, higher salaries would require tradeoffs such as larger class sizes, fewer non-classroom staff, or other reductions in student services.
- Comprehensive staff-level data would allow a more nuanced understanding of staffing trends. Prior to the pandemic, staff-level data allowed researchers to identify credentials, experience, and teacher demographics in more nuanced and comprehensive ways—and to link these characteristics to the classroom. Yet researchers have limited ability to study these teacher staffing metrics, retention, and/or their link to student outcomes in more recent California data. Records that measure experience at a more granular level, consider varying credential types, track retention from year-to-year, and link these to classroom assignments would bolster future research and policy efforts.
Ultimately, teacher staffing decisions, challenges, and disparities have important implications for student learning. Research identifies a link between teacher quality and student outcomes. While, our findings suggest that given small average differences in teacher staffing levels and characteristics across student subgroups, many schools face persistent teacher staffing challenges—and these schools are disproportionately high-need. Policies focused on helping these schools could have more substantial impacts.
Topics
K–12 Education Poverty & Inequality