
Half of students met the state standard in English, while over a third met the standard in math.
- Results from the 2025 Smarter Balanced assessments (SBAC) show that 49% of all students met or exceeded state standards in English Language Arts, while 37% did so in math.
- Proficiency rates have risen slightly since 2022, the first year of testing after pandemic declines disrupted years of steady gains; current growth shows signs of returning to pre-pandemic rates. See the data appendix for long-term trends and other additional information.
- About 33% of students tested met or exceeded state standards on the California Science Test (CAST) which includes biology, physics, and astronomy.
Proficiency rates have increased steadily, but remain below pre-pandemic levels
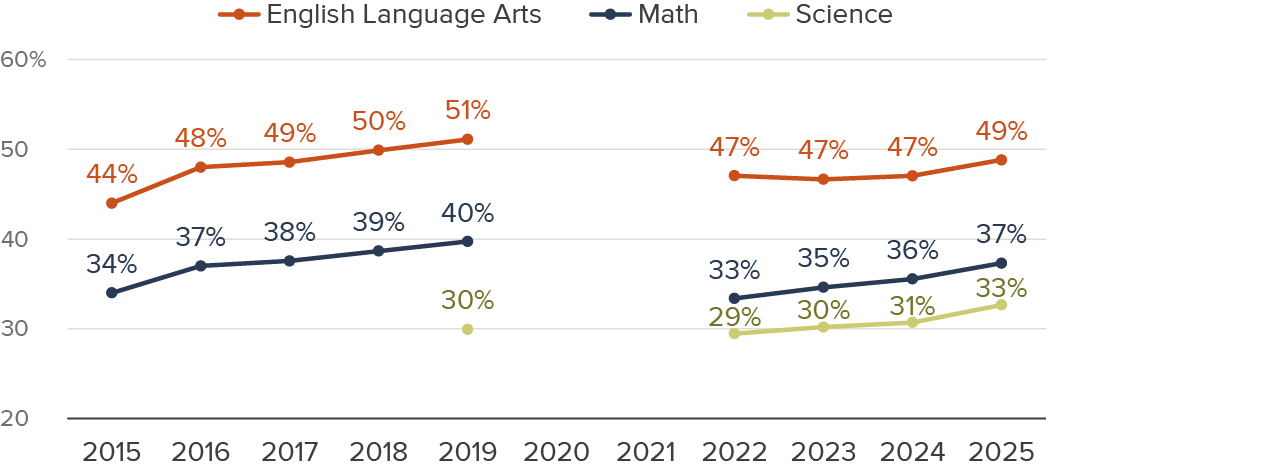
SOURCE: California Department of Education. California Assessment of Student Performance and Progress (CAASPP).
NOTES: SBAC tests were fully administered in spring 2022 for the first time since the start of the pandemic. The 2020 tests were cancelled outright. The 2021 tests were optional, and fewer than one in four students took them, so proficiency rates are not shown for that year. Share proficient indicates the share of students scoring at the achievement levels Standard Met or Standard Exceeded.
Achievement gaps persist across race/ethnicity, gender, and English language acquisition.
- Proficiency rates were highest among Asian students: 62% in English and 57% in math. Rates were slightly lower among white students, with 62% meeting the standard in English and 51% in math. On average, Black and Latino students saw rates of 33% and 39% in English, respectively, and 20% and 26% in math.
- Gender gaps are mixed. More female students met the state standard in English—53% compared to 45% of male students. In math, though, 35% of girls were proficient compared to 39% of boys.
- Disparities persist between students who were ever English Learners (ELs)—some of whom were reclassified as English proficient—and those who were never classified as ELs. There is an 18-percentage point gap in English (37% vs. 55%), and a 16-percentage point difference in math (26% vs. 43%).
Test performance varies widely across income levels and regions.
- Low-income students face various challenges, which may be reflected in their performance on the state tests. English proficiency rates for low-income students (38%) were roughly half of those for students from moderate- to high-income households (68%). Gaps were even larger in math: 26% of low-income students met the state standard, compared to 58% of students with higher family incomes.
- Math proficiency rates for low-income Black and Latino students were 17 percentage points lower than rates for those with higher incomes; math proficiency gaps between low- and higher-income Asian and white students were about 25 percentage points. In English, proficiency rates were 19 to 24 percentage points lower for low-income students across racial and ethnic groups.
- Proficiency rates also vary across regions. Students in the Bay Area and parts of Southern California had the highest scores, while those in Los Angeles and the Central Coast scored closer to the state average. Proficiency rates were below the state average in the Central Valley and the northernmost areas.
California student performance is slightly behind other large states.
- On the 2024 National Assessment of Educational Progress (NAEP), a nationwide standardized test, 29% of California fourth-graders and 28% of eighth-graders were proficient in reading. Math proficiency rates were 35% and 25% in grades 4 and 8, respectively.
- California’s NAEP scores have long been below the national average, but large performance gains between 2003 and 2019 helped move the state’s proficiency rates closer to those in other large states like Texas, Florida, and New York.
- California’s 2024 NAEP results—like those in most other states—indicate stalled pandemic recovery; concern has grown about the widening gap between California’s highest- and lowest-performing students.
Two decades of achievement gains have brought California closer to other states
Share of proficient, 4th grade reading
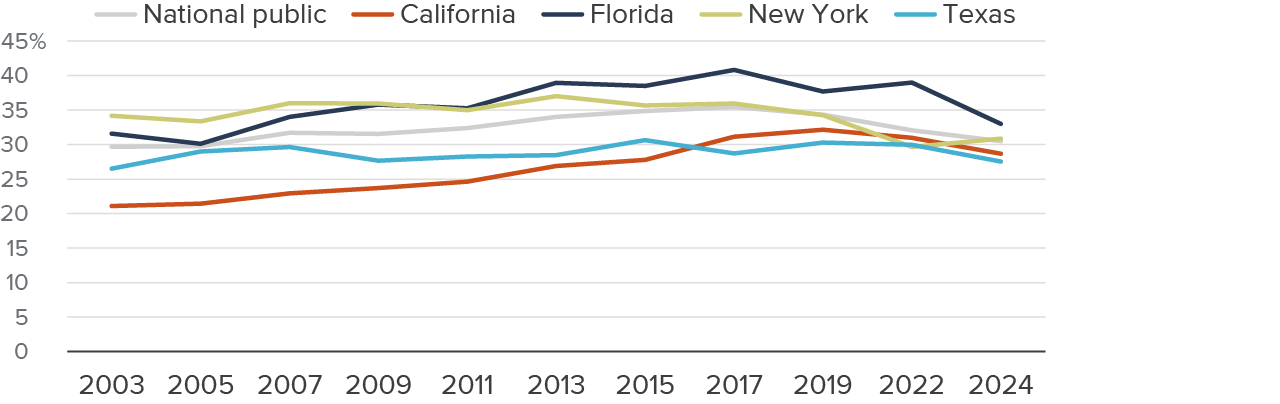
SOURCE: National Assessment of Educational Progress (NAEP).
NOTES: Proficiency rates are the combined shares of students who scored Proficient or Advanced on the exam. The NAEP is administered every two years; it was postponed in 2021 due to the pandemic.
Learning recovery and closing longstanding gaps remain key challenges.
- Although proficiency rates have improved on the latest exams, the share of students meeting the state standard is still lower than it was in 2019. For scores to return to pre-pandemic levels, students will need to make even more progress than they would in a typical year; achieving this goal could be particularly difficult for students in higher grades who may have missed foundational material and have less time remaining in the K–12 system to catch up.
- Longstanding achievement gaps persisted into another year. Despite evidence that outcomes have improved for high-need students over the decade since the Local Control Funding Formula overhauled the state’s school funding system, the gap between the highest- and lowest-scoring students has grown.
- While test scores are a key metric, they do not capture the full picture of the student experience. Chronic absenteeism rates remain above historical trends, and a rising number of students report mental health distress.
Topics
K–12 Education Poverty & InequalityLearn More

K–12 Test Scores Show Overall Improvement but Highlight Challenges in Upper Grades

New K–2 Reading Assessment Offers Opportunities and Challenges

Recent Test Results Show Widening Gap between High- and Low-scoring K–12 Students
