

It is clear that the expansion of the social safety net during the pandemic had a mitigating effect on poverty, despite high levels of unemployment and economic uncertainty. According to the most recent California Poverty Measure (CPM), the statewide poverty rate fell from 16.4% in 2019 to 11.7% in fall 2021. However, poverty rates varied from 5.1% to 21.3% across counties and legislative districts. Our interactive maps provide geographic breakdowns that can give local policymakers and leaders a better understanding of poverty, housing costs, and the role of safety net programs in their regions.
The CPM, a collaborative effort by PPIC and the Stanford Center on Poverty and Inequality, reflects both the varying cost of housing and the key role of safety net resources in helping low-income families make ends meet. Our CPM interactive maps show poverty rates that reflect differences in housing costs across California’s 58 counties, 52 US congressional districts, 40 state senate districts, and 80 state assembly districts. (Additional detail about these areas can be downloaded.)
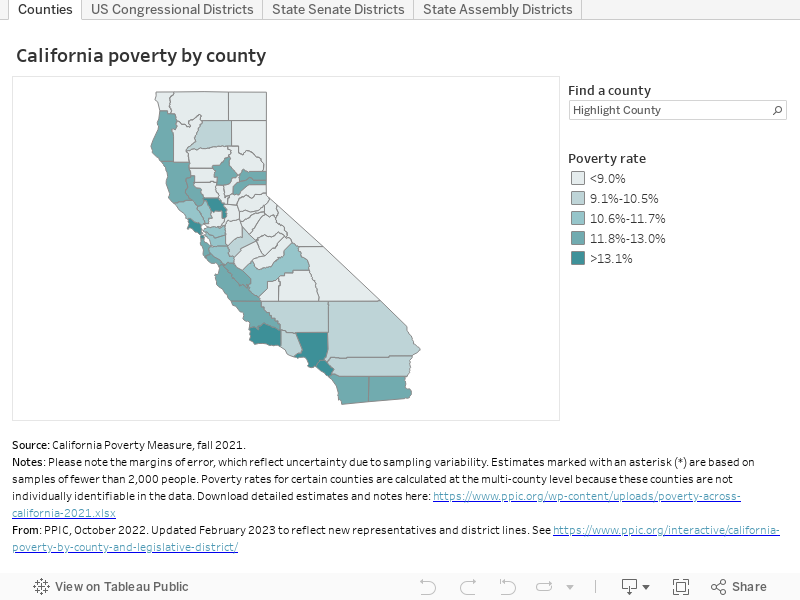
The overall picture involves large declines in poverty across the state, but also wide regional variation in poverty. Rates range from 9.3% in the Central Valley and Sierra region to 13.7% in Los Angeles County.
The lowest-poverty legislative districts tend to be in the Bay Area, while the highest-poverty districts are in Los Angeles County. Across state assembly districts, poverty ranges from 5.1% in the 16th District, in Alameda and Contra Costa Counties, to 21.3% in the 54th District, in Los Angeles County. Across state senate districts, rates range from 7.1% in the 5th District, in the Sacramento Area and Central Valley, to 19.5% in the 26th District in Los Angeles County. Similarly, poverty rates range from 7.7% in three congressional districts—the 14th in the Bay Area, the 9th in and around Stockton, and the 3rd, which includes parts of Yuba, El Dorado, and Sacramento Counties—to 19.7% in the 34th Congressional District, in Los Angeles County.
These maps shed light on the impact of safety net programs as well as varying housing costs, key factors that shape the experiences of people living in poverty across the state. A better understanding of California’s regional differences can inform the poverty-reduction efforts of local, state, and federal stakeholders.
Topics
California Poverty Measure coronavirus Health & Safety Net Political Landscape Poverty & Inequality recessionLearn More

Poverty Varies Widely across California’s Regions
A Look at Demographic Differences in Poverty across Regions in California

Post Title