
Table of Contents
- Key Takeaways
- Introduction
- An Overview of Wealth in California
- Assets: How Much Do Californians Own?
- Debt: How Much Do Californians Owe?
- How Is Wealth Distributed across California Households?
- How Does California Policy Encourage Wealth-building?
- Conclusion
- Notes and References
- Authors and Acknowledgments
- PPIC Board of Directors
- Copyright
Key Takeaways
Household wealth—or the value of what you own minus what you owe—has the capacity to ensure near-term stability, allow investments in the future, and build long-term security for retirement. It is foundational to economic security and mobility. California households tend to have higher wealth levels than those in other states. At the same time, the state’s costs of living are also high, and access to the benefits of wealth is unevenly distributed. A common understanding of wealth in California is crucial to helping policymakers, practitioners, and other stakeholders envision strategies that support economic security and mobility for all Californians. Our analysis of assets and debts across California households finds:
- Households in California typically have more wealth than those in other states, despite holding more debt. Estimated median household net worth in California is $288,000, compared to $180,000 elsewhere. Although this difference reflects high home values in the state, Californians also tend to have more liquid assets than households in the rest of the US. →
- Variation across households is substantial, and those near the bottom of the distribution often have minimal wealth. Those near the top of the wealth distribution (80th percentile; estimated $1.3 million) have net worth over 100 times higher than those near the bottom (20th percentile; estimated $12,000). Latino and Black/other households disproportionately have low wealth, as do those with lower levels of educational attainment. Wealth is higher among older households, who have had time to build assets and pay down debts. →
- Demographic groups hold different portfolios of assets . . . Checking and savings accounts, retirement accounts, home equity, and vehicle equity are the most common assets, and become larger and more common with age and higher levels of education. Homeownership rates and equity are low among Latino households, driven largely by their younger age profile and lower education levels. In contrast, Black/other homeownership rates are low even after we account for factors like age, income, and education levels. →
- . . . and different types of debt. Three in four households owe some money on unsecured debts (those without collateral), like credit cards, student loans, and/or medical bills. Older households are less likely than others to hold any unsecured debt, as are white, Asian, and immigrant households. Latino households are more likely to carry credit card debt and Black/other and Latino households are more likely to carry education-related debt than white and Asian households. →
Introduction
Economic security and mobility depend not just on having enough income to cover immediate needs but also on having enough financial resources set aside to outweigh debt—that is, wealth. These resources are key to covering unexpected expenses and changes in income, and to investing in plans for the future such as education or starting a business. The concept of wealth encompasses everything from bank accounts, to home equity, to retirement accounts and other financial assets. It also takes into account debts—both those secured by a tangible asset, such as a house or vehicle, and those that are not, such as credit cards and student loans. While the term wealth may evoke the idea of considerable financial resources, it is a basic aspect of economic security for all families.
Wealth creation is of particular concern in California, where high costs of living, high poverty rates, and a shortage of housing all exacerbate the challenges of building up assets. But while Californians keenly feel the barriers to building wealth, many have only a broad sense that the experience is shared, and relatively little research has explored this important component of economic well-being in the state.
The median household in California has more wealth than the median household in most other states. Yet this fact masks the reality that more than 40 percent of households lack the financial reserves to meet their basic needs for a few months if their income drops, as we show in this report. And even those with savings and incomes that place them firmly in the middle class find it increasingly difficult to afford home ownership in California—traditionally, a cornerstone of household wealth accumulation (LAO 2025; Baldassare et al. 2024). Moreover, about one in five households in California (21%) report being unable to afford monthly bills (Baldassare et al. 2024).
In California—as in the US—the gap between households with the most and least wealth is large, far exceeding that between those with high and low incomes. Low-wealth households also tend to have very few financial reserves in an absolute sense, meaning their net worth is close to zero. High levels of economic inequality are concerning for a number of reasons, including their negative impacts on the economy (Noel et al. 2019; Peterson and Mann 2020; Buckman et al. 2021; Bell et al. 2019; Benner and Pastor 2015), potential to reduce economic opportunity and mobility (Jacobs and Hipple 2018; Haroon and Harrison 2024), and erosion of support for and participation in democracy (Solt 2008; Gustavsson and Jordahl 2008; Pastor and Veronesi 2018). High levels of wealth inequality also often track racial/ethnic lines.
With these contexts in mind, this report provides basic facts about wealth and its distribution in California, using data from the Census Bureau’s Survey on Income and Program Participation (SIPP). First, we describe different types of assets—such as home equity, bank accounts, and retirement savings—and how the holding and amounts of these assets vary across different characteristics (e.g., age, education, and race/ethnicity). The second section focuses on the other side of the wealth equation—household debt, primarily unsecured debts like credit cards, student loans, and medical debt—and also examines demographic variation. We then take a deeper dive into the distribution of wealth, examining differences across wealthy, middle-class, and low-wealth households in California. Finally, we provide an overview of some of the ways that state and local policy is currently directly involved in helping more Californians benefit from the security and future-focused benefits of wealth, including homeownership support, small business incubators, and financial navigation services.
Overall, we aim to equip readers with a key set of numbers around the net financial reserves households have available, with the goal of establishing a shared understanding that can underpin policy discussions related to economic mobility and security in California.
An Overview of Wealth in California
Wealth, or net worth (we use the two interchangeably in this report), refers to what you own minus what you owe. It describes the net resources that households have in reserve at one point in time, and differs in important ways from income, which describes the flow of resources over a period of time, most often from employment or Social Security benefits (Aladangady et al. 2023a).
Measures of wealth gauge assets or debts at fixed values despite the fact that they are usually changing, whether fluctuating (as with stocks) or changing steadily over the long term (as with home values and mortgage amounts). Meanwhile, income can be a fixed number for a period of time (often a year) but is a flow of resources that may be saved or spent. Income, rather than wealth, is typically the resource that households draw on to pay for costs of living like housing, food, and utilities. Income is also how we determine if a person is experiencing poverty and cannot afford basic needs; a similar threshold of adequacy has not been determined for wealth.
One result of these differences is that although households with higher net worths generally have higher annual incomes, and vice versa, one does not guarantee the other. Further, households with low net worth in California typically have lower net worth than annual income. Meanwhile, high net worth households typically have 12 times as much net worth as income, according to our estimates (Technical Appendix Figure B1). In other words, the ratio of income to wealth is not constant from low- to high-wealth households.
In California, the median household has a net worth of about $288,000, meaning half of California households have less than that and half have more. This is about 60 percent higher than households in the rest of the nation ($180,000), reflecting Californians’ typically higher-value assets (Figure 1). At the median, California household assets are $494,000, compared to a median of $311,000 in all other states (this comparison is only among households that have positive assets, as nearly all do). Three in four households also hold some debt, which is an estimated $103,000 in California and $74,000 in other states (among households with any debts). About 7 percent of households in California have negative net worth, meaning their debts outweigh their assets.

Notably, although California households typically have higher net worth than those in other states, this difference is heavily reflective of home values and does not necessarily translate into quickly accessible savings. Still, Californians typically have $20,200 available in liquid assets, compared to $11,600 in the rest of the US.
Assets: How Much Do Californians Own?
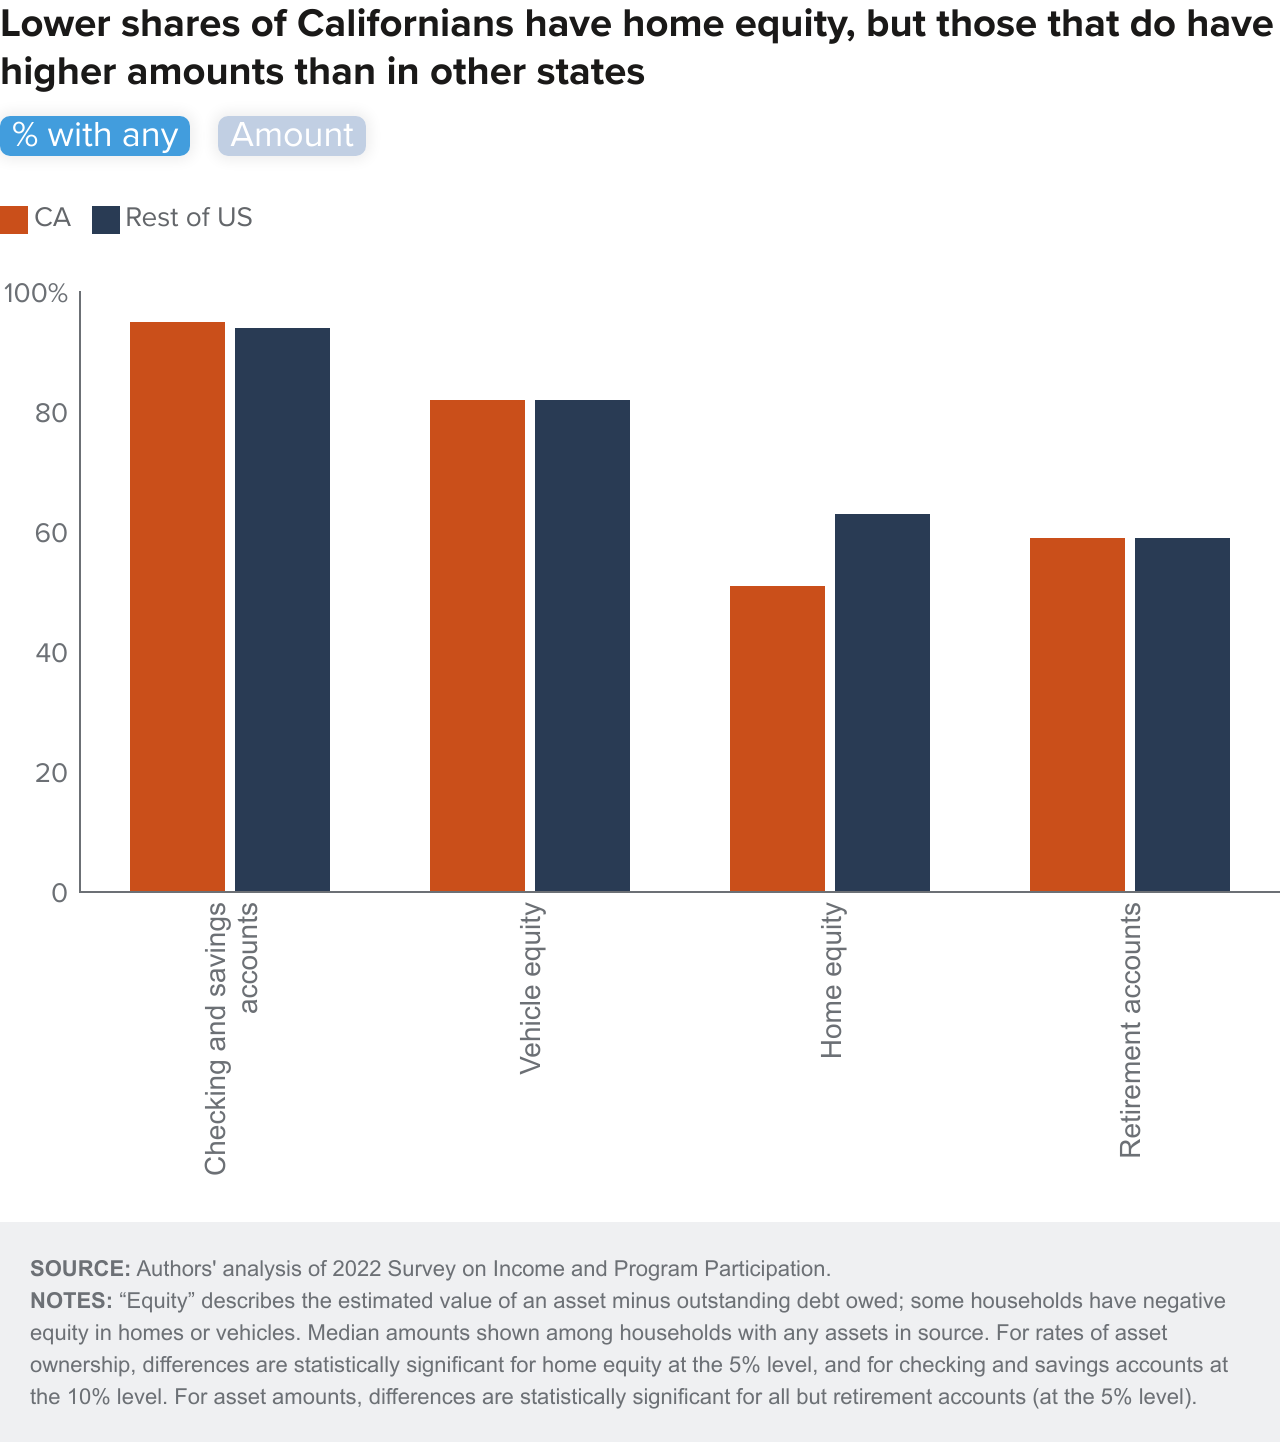
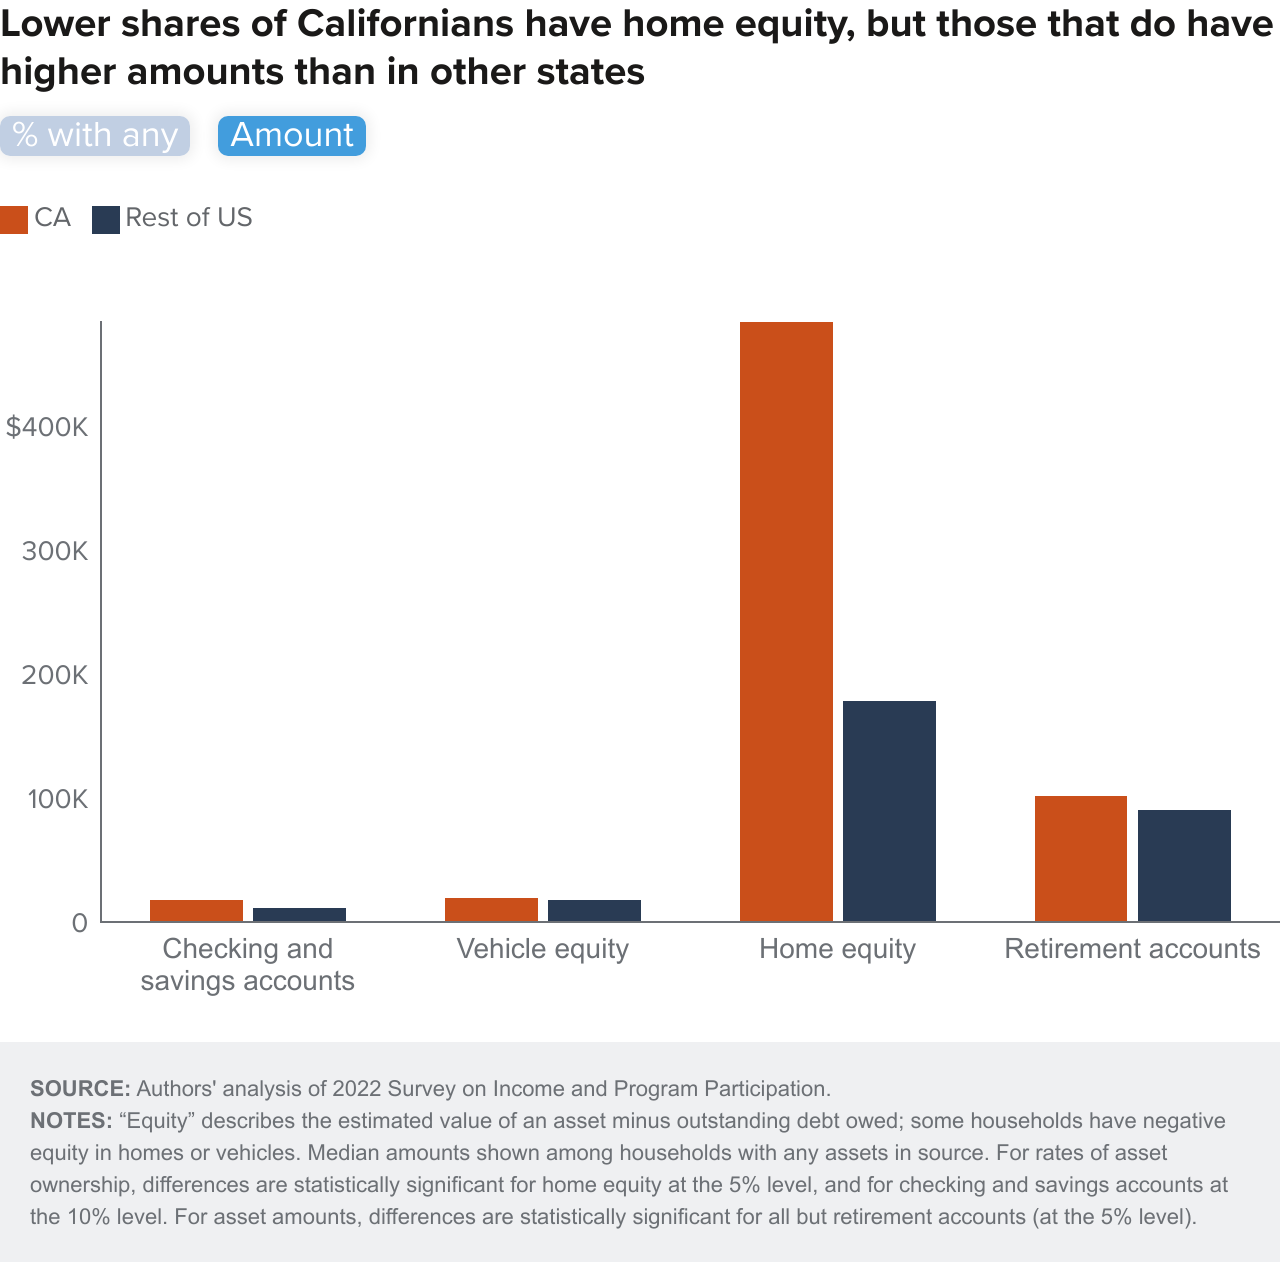
Nearly all California households (95%) hold assets in the form of checking and/or savings accounts, similar to the rest of the US. Other common asset types include home equity, retirement savings, and vehicle equity (Figure 2); at least half of California households have these types of assets. Here, we discuss the full values of assets in retirement, checking and savings, and other financial accounts; for assets that are often still being paid off, like real estate and vehicles, we present equity, or the estimated total value minus money still owed.
Homeownership is less common in California than the rest of the nation, reflecting the state’s high housing costs (Shoag et al. 2023). Just half of California households own their primary residence, compared with 63 percent in other states. Consistent with both high housing prices and higher asset values overall, home equity amounts for California households are almost three times more than in other states (we estimate $485,000 vs. $178,000), and home equity typically makes up a larger share of net worth in California than it does elsewhere (56% vs. 44%). It is less common for California homeowners to own their homes free and clear (32%) than it is for homeowners in other states (41%).
Bank account amounts tend to be higher in California than in the rest of the country, while retirement accounts look roughly similar. A large share of households own their vehicles outright (64%), similar to in other states (60%).
Other types of assets are less common in both California and the rest of the US. A third or less of California households have financial investments like stocks, bonds, and mutual funds (33%), business equity (16%), or rental properties (10%) (see Technical Appendix Table B1). Each of these asset types is more common in California than the rest of the country, and as with major assets, values tend to be higher. (When comparing to individual states, rather than the rest of the nation as a whole, California ranks lower than at least a handful of states in certain asset values and median net worth.)
How do Californians build up assets? Moving beyond simple savings is key. The vast majority of wealth-building happens passively, primarily as those with assets held in small businesses, retirement accounts, financial investments, and homes see their value increase (Mann and Chaganti 2023).
Employment. Earned income is foundational to seeding assets, but high costs of living in California can make saving a challenge even for those with higher earnings. Starting a business is another route for work to set a base for wealth-building and is particularly common among women and Black and immigrant families (Klein 2021). Entrepreneurs in California tend to be wealthier than employees (Headd 2021; Cuellar Mejia 2024).
Retirement accounts. Even at lower earnings levels, workers have access to tax-advantaged saving for retirement. Employers may offer and/or fund employee-managed retirement accounts or manage employee pension funds, and workers can establish after-tax accounts. Workers may also qualify for income from social security in retirement, depending on their work histories. When measuring wealth, it is important to keep in mind that only individually managed accounts are typically considered personal assets; in contrast, pensions and social security are recorded as income when received.
Homeownership. Middle-class California households often build the lion’s share of their wealth through homeownership. However, the additional costs associated with owning a home, such as property taxes and insurance, exacerbate the financial challenges of homeownership for many, and homeowners are more likely in California than elsewhere to spend more than half their income on housing (Johnson and McGhee 2024). Returns to homeownership are lower for those with low incomes; they are also lower for Latino and Black families, but particularly for Black families (Killewald and Bryan 2016). High housing costs, a supply shortage, and disparate access to credit mean that this pathway to wealth is not broadly shared (Shoag et al. 2023; Fulford et al. 2022).
Other. Financial investments in particular have outweighed savings as a means of growing wealth for all generations since WWII (Bauluz and Meyer 2021) and contribute especially to the growth of wealth among those with the highest net worth, whose assets extend well beyond homeownership (Kuhn et al. 2020).
Family transfers also build wealth passively, through direct gifts and indirect support (Adermon et al. 2018; Benetton et al. 2022; Boar 2020). One result of this type of wealth-building is that adults typically have wealth levels highly correlated with those of their parents and grandparents (Pfeffer and Killewald 2018). At the same time, intergenerational transfers, whether through inheritance or gifts, explain a small portion of wealth gaps across racial/ethnic groups (Sabelhaus & Thompson 2024).
Asset Portfolios Vary across Key Groups
In this section, we present differences in asset holdings and value, with a focus on homeownership and retirement savings. We examine several demographic dimensions: age, because the growth and role of wealth varies through the life cycle; educational attainment, because the returns to higher education are so high in California; and race/ethnicity, because nationally, racial wealth gaps are well-documented and in part reflect past policies and practices that helped white families build wealth and prevented other racial/ethnic groups from doing so (Killewald et al. 2017; Mann and Chaganti 2023; CA DOJ 2023). We also briefly discuss nativity and gender, both salient characteristics in net worth variation.
Age. Asset portfolios vary by age, because wealth tends to grow over the course of a lifetime. In theory, people gain assets and see returns on investments over time and then spend down those assets when they retire (Edwards 2022).
Homeownership in particular becomes more likely with age, though the average age of purchasing a first home is substantially higher in California—49 years old—compared to the rest of the US—about 35 years old (Shoag et al. 2023). California households where the head is 65 or older are substantially more likely to have home equity (65%; Figure 3) than younger households (56% or less). They also have higher home equity amounts ($578,000 vs. $467,000 or less).
Other assets tend to be most common among middle-aged households (ages 35–64). Households in this group are more likely than older households to have private retirement accounts (63% vs. 51%)—although households with heads age 65 and up have more money in those accounts. Middle-aged households are also more likely than older households to hold other financial investments, and more likely than both younger and older households to own vehicles, businesses, and real estate (Technical Appendix Table B3).

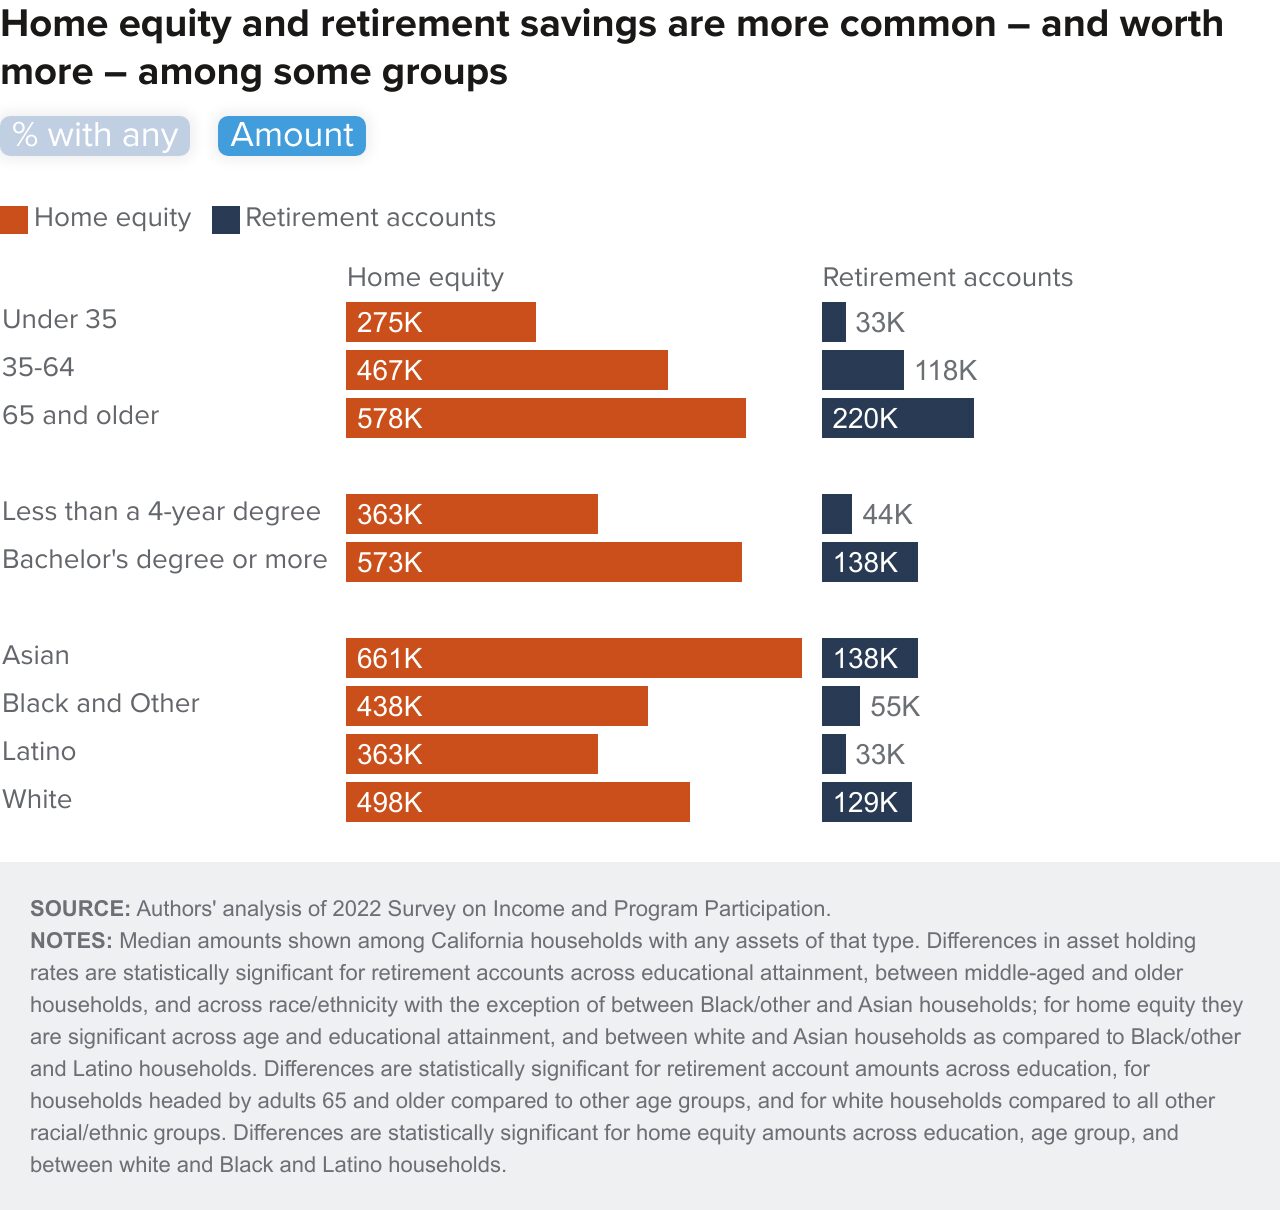
Educational attainment. Four-year degree holders earn higher incomes and are more likely to have jobs with benefits such as employer-sponsored retirement accounts (Cuellar Mejia et al. 2025). Consistent with the high value of a college degree in California, households with higher levels of educational attainment have more and higher-value assets across the board. Six in ten (61%) households in which someone holds a four-year degree own their homes, compared to 40 percent of households in which no one does (Technical Appendix Table B4). Three in four (75%) with a four-year degree holder have retirement accounts, compared to 40 percent of those without, and these accounts are typically more than three times as large for degree-holders ($138,000 vs. $44,000).
Ownership of other assets is also disparate (Technical Appendix Table B4). For example, nearly half (48%) of more highly educated households have financial investments, worth $68,000 at the median, compared to 16% of households without a four-year degree holder ($13,000). Households with lower educational attainment are also much more likely to be unbanked: about 9 percent have no checking or savings account, compared to 1 percent among those with a degree-holder. Notably, the state’s wide racial wealth gap is fed in part by uneven access to and completion of four-year degrees by race/ethnic group (Hutchful 2018).
Race/ethnicity. White and Asian households are most likely to have most types of assets and for them to be valued higher, mirroring the state’s income gaps (Thorman and Payares-Montoya 2025). This variation reflects a combination of policy history, current disparities, and for Latinos, demography. California’s Latino population is on average younger than other demographic groups, and thus less likely to have saved enough to buy homes or have substantial investments (Johnson et al. 2024; Technical Appendix Table A1).
More than half of white and Asian households own homes (59% and 56%), and typically have $498,000 and $661,000 in equity, respectively. Black/other and Latino households own homes at lower rates (41% and 40%), and have less in equity compared to white and Asian households ($438,000 and $363,000). Retirement accounts are typically worth twice as much among white and Asian households as among Latino and Black/other households ($130,000 or more, compared to less than $60,000). However, white households are most likely to have retirement accounts (69%), with Asian and Black/other households in the middle (61%), and Latino households least likely (42%).
Asset ownership in other categories follows similarly disparate patterns (Technical Appendix Table B2). Latino and Black/other households are much more likely to be unbanked (9% and 8%, respectively, have no money in a checking or savings account) than white or Asian households (2% and 3%). Further, only 15 percent of Latino households have financial investments outside of retirement accounts, compared to 33 percent of Black/other, 41 percent of white, and 45 percent of Asian households. Disparate financial investments in particular contribute to racial/ethnic wealth gaps, since they generate high returns.
Nativity. Foreign-born households in California (those with a head of household who immigrated to the US) are less likely than US-born households to have home equity (44% vs. 54%), retirement accounts (46% vs. 65%), and financial investments (26% vs. 36%); they are similarly likely to have business equity (26% and 28%; Technical Appendix Table B5).
Our data does not allow us to explore asset and debt portfolios among California immigrant households from different countries even though these differences are important. For example, the state’s agricultural sector has long relied on Mexican and Central American laborers to formally or informally work at low wages, while many recently arrived immigrant workers are highly educated, and coming to California from Asia to work high-paying jobs. The estimates of asset holdings by nativity presented above combine immigrant households with both high and low wealth levels.
Gender. Households headed by women (50%, in California) are as likely as those headed by men to have most types of assets—with the exception of financial investments outside retirement accounts (29% of women vs. 37% of men)—but tend to have less net worth ($255,000 vs. $339,000). Retirement account values in particular are lower for woman-headed households ($77,000 vs. $122,000; Technical Appendix Table B8). Wealth differences by gender are intertwined with differences by household composition; for example, woman-headed households are more likely than those headed by men to consist of one adult with children or simply one older adult. When we hold age, race/ethnicity, nativity, education and marital status constant, we do not find significant differences for households headed by women (Technical Appendix Table C2).
Debt: How Much Do Californians Owe?
Debt plays a multidimensional role in wealth-building. Borrowing can be key to building long-term wealth through homeownership, starting a business, or acquiring education—all often known as “good debt” (Mann and Chaganti 2023; McKay et al. 2022). Yet families also take on debt because they are unable to afford the cost of something upfront—medical care, a large purchase, a vehicle, a sudden expense—and end up paying substantially more than the cost of the item in the long run because of interest—also known as “bad debt.” Bad debt not only reduces wealth in the near term, it can also reduce capacity to save for the long term and impact job choices (Rutledge et al. 2018 and 2016). But it is sometimes unavoidable.
In this section, we focus on so-called “unsecured debt”—that is, debt that is unattached to a tangible asset that has value, like a house or vehicle—because secured debt is incorporated into the value of the assets described above as equity. Some unsecured debt can be considered good or necessary—e.g., student loans and medical debt; while other types can be considered bad—e.g., credit card balances, payday loans, or past-due fines and fees. Ideally, we would explore debt in the same level of detail that we do assets. However, too few households hold specific types of debt and as a result we are not able to examine debt amounts by type across groups; instead, we focus on how common it is to have certain types of debt.
Three in four households in California and the rest of the US hold some form of debt, but only about half owe money on unsecured debts (Figure 4). California households are slightly less likely than those in other states to hold any type of unsecured debt (50% vs. 53%).
Credit card debt is the most common type of unsecured debt for households in California and in other states: 41 percent owe money on a credit card or to a retail store ($6,000 at the median in California, similar to in other states). Student loan debt is less common among households (17% in both California and elsewhere) but runs much higher in dollar value (around $25,000).
Undergraduate students in California are substantially less likely to take on student loans than those in the rest of the US (23% vs. 39%; Zhou 2024), and it may be that California households with education-related debt owe less in outstanding loans than households in the rest of the country (our data does not allow for a precise estimate).
Medical and other unsecured debt is much less common in California than elsewhere (10% vs. 17%). “Other debt” is a broad umbrella that can include things like fines, fees, and payday loans. That California households are less likely than those in other states to hold these debts likely reflects the state’s embrace of Medicaid expansion under the Affordable Care Act, which has been linked to several improvements to financial well-being including lower debt, fewer bankruptcies, and better credit scores (Guth et al. 2020). Still, about one in ten California adults report struggling to afford the costs of medical care for themselves or their family in the past 12 months.


Type of Debt Varies across Households
Debts, like assets, tend to shift over the course of life in ways that reflect family resources, changing income, career trajectories, and life events. In this section, we look at debt across some key demographic groups: age, education, race/ethnicity, nativity, and gender.
Age. Overall, households headed by adults over 65 have considerably less debt of any kind, which likely reflects the longer time horizon they have had to pay down their debts and build up savings. In total, one in three older households (33%) has some unsecured debt, compared to 55 percent of middle-aged and 60 percent of younger households (Figure 5). Education debt in particular is much lower among older households: 4 percent of older households and 17 percent of middle-aged households have some student loans, compared to 31 percent of those under 35. Credit card debt is also less common for older households than others (29% vs. 45%). Medical/other debt may also be less common (6% of older vs. 12% of middle-aged and younger households; Technical Appendix Table B3), and older households are less likely to report having trouble paying medical bills (6% vs. 11%; Technical Appendix Figure B2).
Educational attainment. Unsurprisingly, households in which someone holds a four-year degree are much more likely than others to have student loan debt (23% vs. 10%), and their debt in this area is substantially larger ($35,000 vs. $13,000). There do not seem to be differences in having credit card debt or medical/other debt based on whether any household members have a four-year college degree or not. However, California households without four-year degrees are more likely to report difficulty paying for healthcare (12% vs. 7%), and if they have problems paying medical bills, to be unable to meet other basic needs because of the cost of medical expenses (38% vs. 28%; Technical Appendix Figure B2).
Race/ethnicity. Latino households are much more likely than are white and Asian households to report having unsecured debt (59% vs. about 45%), particularly from credit cards and retail stores (50% vs. about 35%); Black/other households fall in between. These differences likely reflect lower income and asset levels for both Latino and Black/other households. But even accounting for differences in income and other characteristics, Latino households are more likely than others to hold credit card debt, and Black and other households are more likely to have unsecured debt, particularly from education (Technical Appendix Table C1). About one in five Black/other (22%) and Latino (19%) households have outstanding student loans, compared to 16% of Asian and 13% of white households.
Medical and other debt may also play a bigger role for Latino and Black/other families, who are more likely to report difficulty paying medical bills (13% and 12%, respectively, compared to 9% and 6% among white and Asian families). Further, about 40 percent of these families reported being unable to afford other basic needs due to medical debt, compared to 28 percent of white and 33 percent of Asian families in similar situations (Technical Appendix Figure B2).
Nativity. Immigrant households are slightly less likely to hold unsecured debt (47% vs. 52% of US-born households; Technical Appendix Table B5). This is the case even accounting for other differences in circumstances (see Technical Appendix C for details). Across types of unsecured debt, only student loan debt varies by nativity; 13 percent of immigrant households hold student loan debt, compared to 19 percent of US-born households.
Gender. Households headed by men and women are equally likely to hold different types of unsecured debts and have comparable values (Technical Appendix Table B8).


How Is Wealth Distributed across California Households?
California has a high level of income inequality—but wealth is even more unevenly distributed. Those near the top of the wealth distribution (80th percentile; $1.3 million) have net worth over 100 times more than those near the bottom (20th percentile; $12,000). By comparison, households at the same high point in the income distribution have just four times the annual income of those at the same low point (Thorman and Payares-Montoya 2025). Households near the bottom of the wealth distribution not only have little wealth in comparison with those at the top, they have little or nothing to draw upon at all (Figure 6).

Both California and the US as a whole have wide gaps between rich and poor. In aggregate, the wealthiest 1 percent of households hold 37 percent of all wealth in the US; the bottom 50 percent hold 0.9 percent (Blanchet et al. 2022). California’s version of wealth inequality is characterized by higher net amounts for wealth throughout the distribution than in the rest of the nation, particularly among the wealthiest households. At the median, 80th, and 90th percentiles, household wealth is 60 percent or more higher in California than the rest of the US; the smallest gap of these is at the median, on the order of $100,000 (median net worth is $288,000 in California, and $180,000 in other states). High real estate values and higher incomes in California likely contribute to differences at the top of the wealth distribution. California is also home to more billionaires than any other state, even though New York has more billionaires per capita.
Households in the top 25 percent of the wealth distribution—both in California and the rest of the nation—are much more likely to hold every type of asset (except vehicles). They are also much more likely to hold home- and business-related debts and less likely to hold unsecured debt—meaning their borrowing tends to pay off in the form of ownership of assets that can grow in value (Technical Appendix Table B6). They also have more variety in their asset holdings than households with less wealth. While more than 90 percent own their homes, home equity typically makes up just 40 percent of their net worth, compared to homeowners in the middle of the wealth distribution (between 25th and 75th percentiles), for whom home equity accounts for 70 to 85 percent of net worth (Technical Appendix Table B7).
Regionally, wealth varies widely across California, in keeping with varied homeownership rates and property values (Johnson et al. 2022)—as well as incomes and costs of living. Our data does not allow for regional estimates of wealth, but other researchers estimate that California’s highest levels of wealth—places where median household net worth is $850,000 or higher—are found in the coastal regions of the state including the Bay Area, west Los Angeles County, southern Orange County, and northern San Diego; communities with lowest median net worth (below $25,000) are found in urban Los Angeles and the city of Fresno (Zhong et al. 2022).
As we have seen with assets and debt, wealth in California varies across groups (Figure 7). Our estimates show gaps in median net worth across key characteristics:
- Older households (over 65) have a median net worth of $614,000, compared to $54,000 among households under age 35.
- Households in which someone has a bachelor’s degree or higher have $581,000, compared to $76,000 among those without.
- US-born households have $375,000, while immigrant households have $149,000 (Technical Appendix Table B5).
- Women-headed households have $255,000, while men-headed households have $339,000 (Technical Appendix Table B8).
Since these elements vary across racial/ethnic groups, they may help explain some of the wealth disparities across these groups.

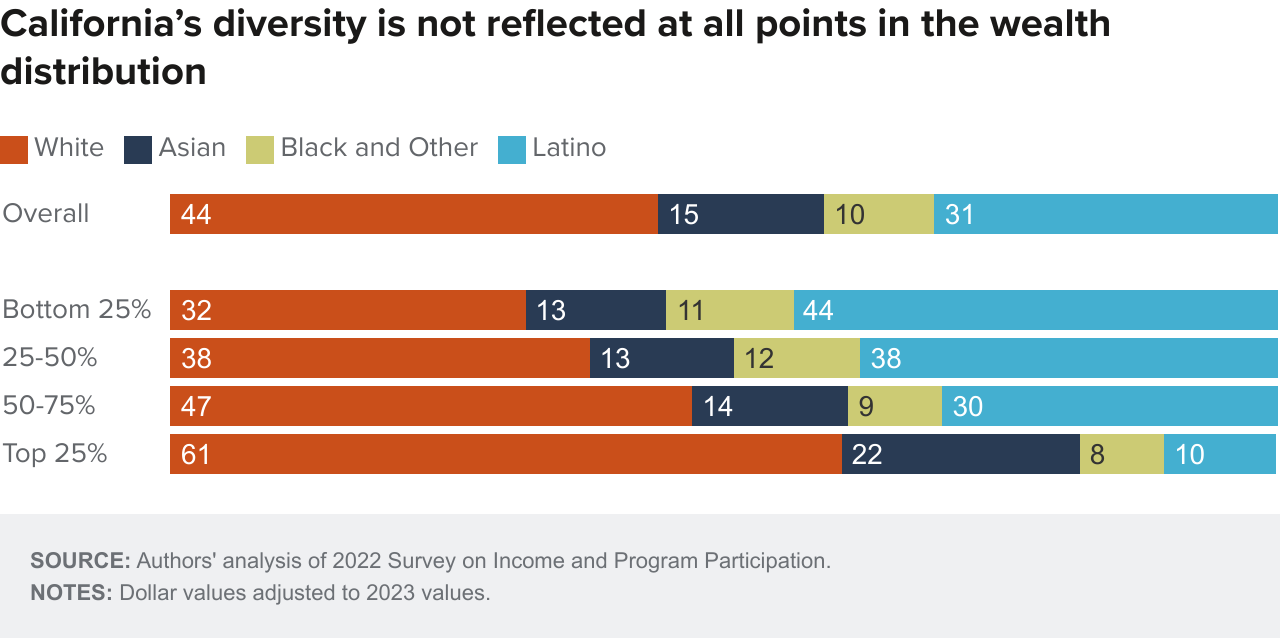
As we underscore in this report, older households and those with higher educational attainment also have more wealth, consistent with building wealth over the course of life and with the high rate of return to higher education in California. Racial/ethnic differences in wealth can be less straightforward. Latino and Black/other households are substantially more likely to be among those with low wealth (Figure 8). While 41 percent of California households are Latino or Black/other, these households make up 55 percent of those in the bottom quarter of the wealth distribution. White households make up 44 percent of all California households and 32 percent of the bottom quarter; Asian households comprise 15 percent of all households and make up 13 percent of the bottom quarter.
The wealth gap is especially large between Latino households and white and Asian households (who have similar medians, around $530,000): median net worth is nine times higher among white and Asian households than Latino households ($62,000; Figure 7). It is three times higher for white and Asian than Black/other households ($180,000).
When we control for key demographic characteristics, we find that age, education, and income explain some of the state’s wealth gap between Latino and white households (see Technical Appendix C). Comparisons around homeownership stand out. The likelihood of having any home equity is similar for white and Latino households with similar age and education levels. This suggests that the Latino-white gap may narrow as educational attainment rises among Latino households and as earnings grow over the life course. But Black/other households have lower homeownership and equity than white households even at similar age and education levels, suggesting that narrowing the Black-white homeownership gap may require addressing other systemic barriers, including those resulting from historical policy.
Although lower homeownership among Latino households seems to be explained by things like age, education, and nativity, those same factors do not account for the lower likelihood of retirement savings among Latino households. Likewise, levels of unsecured debt including credit card and education-related debt remain higher for Latino households even once we adjust for demographics and other factors.
How Does California Policy Encourage Wealth-building?
State and local policies aim to help Californians build wealth in a variety of ways. Asset-building policies often focus on encouraging and seeding savings accounts or increasing financial literacy. Policies focused on helping consumers manage debt include expanding access to credit with good terms and preventing debt for basic needs like health care. Both asset-building and debt-management policy focus on homeownership, given the primary role it can play in building household and intergenerational wealth.
In this section, we provide a high-level overview of some ways these approaches have been put into practice in California, along with a brief discussion of what the research says about how effectively they increase household wealth and/or narrow wealth gaps. Most have some evidence supporting their effectiveness but also need more robust evaluation and research to confirm whether their impacts are causal and generalizable to broader groups.
This list is not meant to be exhaustive; instead, it is intended to provide examples of policies in place currently or in recent years in California that impact wealth directly. (Indirect approaches such as investing in education, reducing the cost of living, or boosting incomes could also impact wealth.)
Financial assistance for first-time homebuyers
Research suggests that state housing finance agencies (HFAs)—such as California’s CalHFA, which administers lower-rate mortgages and helps first-time home buyers cover initial costs—have helped lower-income households enter homeownership and retain their homes at higher rates than those purchasing homes in the private mortgage market (Hembre et al. 2020). But homeownership is not guaranteed to build long-term wealth. As noted above, low-income households in particular are less likely to grow wealth as homeowners, since they are more likely to need to draw on home equity in the short-term (Newman and Holupka 2016; Beracha and Johnson 2012). Research focused on the Great Recession and the subsequent housing bust concluded that helping families retain their homes during economic downturns could be a more effective tool for sustaining wealth (Wainer and Zabel 2020). Mortgage forbearance—a temporary, permitted pause in payments—is one effective version of this; programs implemented during the COVID-19 pandemic reduced delinquency rates and allowed some borrowers to grow their liquid savings (Shi 2022; Gerardi et al. 2022).
In addition to traditional loans, governments support homebuyers with shared equity programs. Los Angeles and San Francisco, for example, offer down payment loans (City of Los Angeles and San Francisco), mortgages (Los Angeles County), and below-market rate properties (San Francisco) that require buyers to pay back a share of the equity they gain as the home appreciates in value. Evaluations find that these programs have relatively modest effects on overall wealth, but do generate returns on investment in the form of home equity for households and generate much more wealth than the household would have accumulated if they had stayed renters (Theodos et al. 2019; Acolin et al. 2021). The state has also operated a shared equity downpayment assistance program in recent years, CalHFA’s California Dream for All program, which was in high demand for two years before going unfunded in the 2024 budget.
Encouraging and seeding savings accounts
State and local programs in California incentivize and in some cases contribute to individual accounts, although these contributions are often restricted for a certain use like retirement or education. There is some evidence that supporting individual savings accounts—especially those that are focused on children—can help low-income families accumulate modest assets over the short term. At the same time, program participants can withdraw funds for non-qualified reasons, and long-term effects on retirement savings, college completion, and overall wealth are relatively small (Mills et al. 2007; Grinstein-Weiss et al. 2013; Grinstein-Weiss et al. 2015). Evidence on these programs’ effectiveness on financial outcomes comes from just a few small trial studies (Birkenmaier et al. 2022). More robust evaluations are needed to understand how they may impact savings and wealth-building across different contexts and groups.
Examples of government-promoted savings accounts aimed at helping build wealth starting in childhood include the California HOPE for Children Trust Account Program that funds and manages investments for foster children and those who lost caregivers to COVID-19, and the CalKIDS and Oakland’s Brilliant Baby programs, which both seed 529 accounts for children in low-income families.
The CalSavers program, a broad-based effort to encourage retirement savings, now automatically enrolls many California workers in pre-tax IRAs if their employers do not offer retirement savings plans. Again, well-designed evaluations of these programs would go a long way towards helping policymakers weigh the benefits and limitations of these asset-building strategies.
Increasing financial literacy
Policies to advance financial literacy have been shown to pay dividends for household wealth-building. One study found that financial education is even more important than traditional schooling for explaining differences in household wealth levels and retirement contributions (Behrman et al. 2012). Those findings were confirmed in a recent meta-analysis that reported large, causal effects of financial education programs on financial behavior (Kaiser et al. 2022). California efforts in this space include the CalMoneySmart Grant program within the Department of Financial Protection and Innovation, which provides grants to local organizations to support financial education programs for low-income families and for students navigating challenges with loan repayment. Likewise, a new financial literacy course will become a high school graduation requirement in California starting in the 2030 school year (AB 2927). Developing data resources and analytic plans to evaluate the effects of these programs on improving household net worth would help further guide policy.
Expanding access to credit
Borrowing money can be key to investing in areas like homeownership or starting a business but requires having both good credit and a willing lender. California piloted the practice of allowing rental payments to be reported to credit bureaus starting in 2021 (SB 1157), citing research that reporting on-time rental payments could help renters with little or no credit establish or increase credit scores (e.g., Turner and Walker 2019). Following a small evaluation that suggested the California pilot would also have these impacts (Esusu Financial Inc. 2023), the legislature expanded the practice in 2024 (AB 2747). Also in 2024, California took aim at the role medical debt plays in reducing credit scores and followed other states in barring it from being reported to credit bureaus (SB 1061); the federal government is following suit.
Entrepreneurs may be able to turn to state-implemented support for accessing capital. California leverages federal State Small Businesses Credit Initiative (SSBCI) funding to reduce risk for financial institutions that lend to small businesses and help entrepreneurs access capital; the Small Business Loan Guarantee Program (SBLGP) and California Capital Access Programs (CalCAPs) are state programs that expanded with SSBCI funding in the 2010s and American Rescue Plan Act funding in the 2020s (Seidman 2018). Other state-funded programs like the Small Business Technical Assistance Program supplement federal dollars for the same purpose. The California Investment & Innovation Program (Cal IIP) supports capacity at CDFIs to help entrepreneurs access capital. California also funds direct loans for entrepreneurs through the Jump Start Microloan Program; some local governments also offer loans and/or grants (e.g., Fresno, Long Beach, and San Francisco).
Much of the research on microloans and their impact on financial well-being comes from developing countries; a recent study based in Europe found access to credit had large and notable effects on income for small business owners, especially those that were credit-constrained (Delis et al. 2024). But across the board, additional research will be necessary to establish the extent to which California’s specific policies to help individuals manage debt and entrepreneurs access credit result in long-term increases in household wealth.
Reducing unsecured debt
California state and local governments aim to relieve education and medical debt by paying it down. These are measures primarily taken to address immediate financial distress, remediate credit, and remove barriers to seeking medical care, rather than to boost long-term wealth. And while paying off debt does increase net worth, it may not have any longer-term impact on wealth accumulation. Studies have found mixed results; for example, student debt relief can increase incomes and improve credit (e.g., DiMaggio et al. 2020), but medical debt relief has not been found to affect financial well-being (Kluender et al. 2024). Future research could explore the effects of both types of debt relief on wealth in the long term. For instance, California’s Office of Healthcare Workforce Development offers several loan repayment programs for students who go on to practice in medically underserved areas, and Los Angeles County recently began buying and forgiving medical debt held by county residents that is in collections. These and other programs are ripe for further study.
Conclusion
California households typically have a higher net worth than those in other states. Still, Californians overwhelmingly feel that the gap between rich and poor in the state is wide and growing, and that they want state government to address it (Baldassare et al. 2023). As we document here, the sense that the gap is wide is grounded in reality.
We find that the variation in wealth across California households is substantial, with those near the top of the wealth distribution (80th percentile) having a net worth more than 100 times that of those near the bottom (20th percentile)—in dollar amounts per household, that is $1.3 million compared to $12,000. We also find large wealth gaps across demographic groups, such that households that are older, more highly educated, white or Asian, or US-born tend to have more wealth than their counterparts. Our analysis suggests that some of the wealth gaps we observe among racial/ethnic groups may be narrowed by improvements in education and income levels (e.g., home equity for Latinos); however, in other areas more targeted efforts may be necessary (e.g., home equity for Black/others and retirement savings for Latinos).
Wealth is an essential precursor to financial security and economic mobility. First, in terms of economic security, wealth provides a critical buffer when incomes change unexpectedly because of job losses, health shocks, or other unplanned life events. Social insurance (such as unemployment and disability) and safety net programs (like CalFresh) can offer an important buffer but are not available to everyone and may not provide enough resources. When the unexpected occurs, families without savings or equity in homes or businesses may take on debt to make ends meet, which can further erode economic security. Even among those with assets such as home equity, the ability to access that resource may be challenging, especially when interest rates rise. Second, in terms of economic mobility, wealth supports investments in things like education and entrepreneurship, which can markedly improve economic opportunities (Cuellar Mejia et al. 2025).
Since wealth typically amasses over a lifetime, there are a number of stages in its accumulation where policy can step in. The state already directly incentivizes wealth-building with programs that help to expand access to homeownership, encourage savings, and manage debt. But no single policy will ensure that Californians are building assets, managing debt effectively, and/or accessing public resources well. Many state and local programs would benefit from research examining their effectiveness for building wealth in the long term.
The main goal of this report has been to provide basic numbers about wealth in California. Starting from a shared understanding of the facts is crucial as policymakers, practitioners, and other stakeholders envision strategies to support economic security and mobility for all Californians.
Topics
Economic Growth Economic Mobility Economic Trends Economy Housing Poverty & Inequality