
Key Takeaways
California is perceived as having more regulation than other places, which is often cited as detrimental to the business climate. Regulations are hard to quantify and can vary in complexity, cost, and administration and implementation, which makes it difficult to assess their impact. In this report, we present an initial foray into studying the relationships between regulation and business starts in California. We find:
- California is not an outlier nationwide in the quantity of business regulations, but it appears as an outlier for the quantity of specific prohibitions or obligations embedded in business regulations.
- States with more regulation tend to have fewer business starts, both overall and in manufacturing. While this correlation does not imply that reducing regulation would necessarily increase business growth, California stands out with its relatively higher regulation and slower rate of business starts.
- Across California cities, less correlation exists between the number of permits required and the rate of business starts; for manufacturing, however, there is more evidence that more permits are associated with fewer new manufacturing business starts.
Introduction
California is perceived as having more—or more onerous—regulation of businesses than other places; it is a factor often cited as detrimental to the business climate, making doing business here harder to sustain, less competitive (relative to other states), and thus harder to launch. While regulations directly affect businesses, consumers may pay higher prices or have fewer options, communities may miss out on business and job growth, and whole swaths of the public may lose out on the benefits from economic growth if all aspects of regulation are not considered.
Not only do concerns center on “more regulation” but also on the complexity, conflicts, and lack of clarity within regulation that make it costly to follow, both in time and money. Sometimes referred to as policy or procedural “sludge,” layers of regulation and administrative burdens can advantage those within the system and disadvantage new businesses, entrepreneurs, and those without access to insiders.
Lack of information limits our understanding of the extent to which regulations may aid or impede business in California or elsewhere; it is difficult to capture the scale and scope of regulation as well as to connect regulatory variation with business sector dynamics. To start to unpack this fundamental issue affecting California’s economy, we leverage compendia of regulations that apply to firms across US states and across California cities; we use these to describe and compare the nature of regulatory contexts in which businesses operate. We also connect these differences across places to business dynamics to establish some basic facts that can frame discussions and research regarding the potential repercussions of regulation.
States regulate a host of business activities affecting nearly all business sectors in one way or another. Some of the most common and familiar business regulations are around the workforce, such as wage setting (minimum wage rates, hours, and overtime), worker health and safety, and rights to organize. California, New York, and Washington are well-known for their higher minimum wage regulations as well as policies that allow workers to organize more easily. Other highly visible business regulations set food safety standards, like labeling of food items and health inspection of restaurants, above and beyond federal policy. Additionally, states set forth rules of the road for business in taxation, banking and insurance, environmental impacts (like emissions, water quality), and more. Local governments may impose additional regulatory requirements on businesses, often having to do with more local issues or laws, such as permitting.
Typically, regulations are imposed to achieve some social benefit. One may evaluate the merits of that goal, the best approach to achieving it, and whether the costs are justified by the benefits. Indeed, critiques of the regulatory environment often center not on the reasonableness of the goal of a particular constraint but on how it is implemented. This report considers some of the potential costs of regulation but does not consider these broader questions. Nonetheless, understanding the regulatory landscape in California (and California cities) in relation to other locations can better inform discussions of the costs, benefits, and design of regulation.
Measuring regulation is challenging, given the range of jurisdictions setting and implementing policy (local, state, and federal, for starters), the variety of activities that are regulated, the constraints regulations impose on businesses, and the fact that regulations are in text and thus not necessarily easy to quantify.
Furthermore, how a regulation is implemented, how cooperatively government interacts with businesses, how regulations are enforced, and other factors can influence the ultimate impact of regulations. In this report, we do not claim to capture all dimensions of regulation. Our focus is on what might be considered the written content of regulations—how many there are, what industries or types of behavior they cover, and how binding the regulations appear to be based on their language.
Given that understanding the extent of regulation and its impact on business may be important for policy, we view this work as a meaningful first step towards characterizing the burden of regulation and understanding the impact of regulation on businesses. Additional research is needed to explore alternative and more definitive ways to measure the impact of regulation on business outcomes.
Examples of regulations are shown in Table 1; additional examples are provided in Technical Appendix Table A2.

State Regulation Patterns
Legal code that businesses are subject to creates compliance activities and costs to launching or operating a business. But how prescriptive, stringent, or complex the code is (and perhaps how it interacts across different areas) will also weigh heavily on the cost of regulation (Coffey et al. 2020; Chambers et al. 2022). The counts of regulatory constraints embedded in regulation start to quantify the weight of regulation, reflecting the prohibitions or obligations businesses are subject to.
Critiques of California’s regulatory environment by businesses, or by those—like business organizations or economic development practitioners—who work with them, are often based on particular experiences with regulations that are onerous, confusing, or hard to comply with even if the intent of regulation is sound.
To start to unpack the variation in regulation, we first look at the number of individual pieces of regulation that businesses are subject to across states. It turns out that California is in the middle of the pack based on the number of regulations but is at the extreme high end of the distribution based on the number of constraints embedded in regulation.
The regulation data depicted in Figure 1 is based on our analysis of QuantGov’s state regulation database, which quantifies the text of millions of pieces of state regulations (see text box, earlier).
While California has a total of 1,301 regulations on businesses (similar to the median across states), each does not apply to all types of businesses. So we average the number of regulations each industry is subject to in order to obtain a more comparable measure across businesses and across states.
The average California business is subject to about eight regulations per industry, very close to the median number across states. Half of states have between about 6 and 13 regulations per industry (these are the 25th and 75th percentiles), and all states have between 1 and 27 (the minimum and maximum).
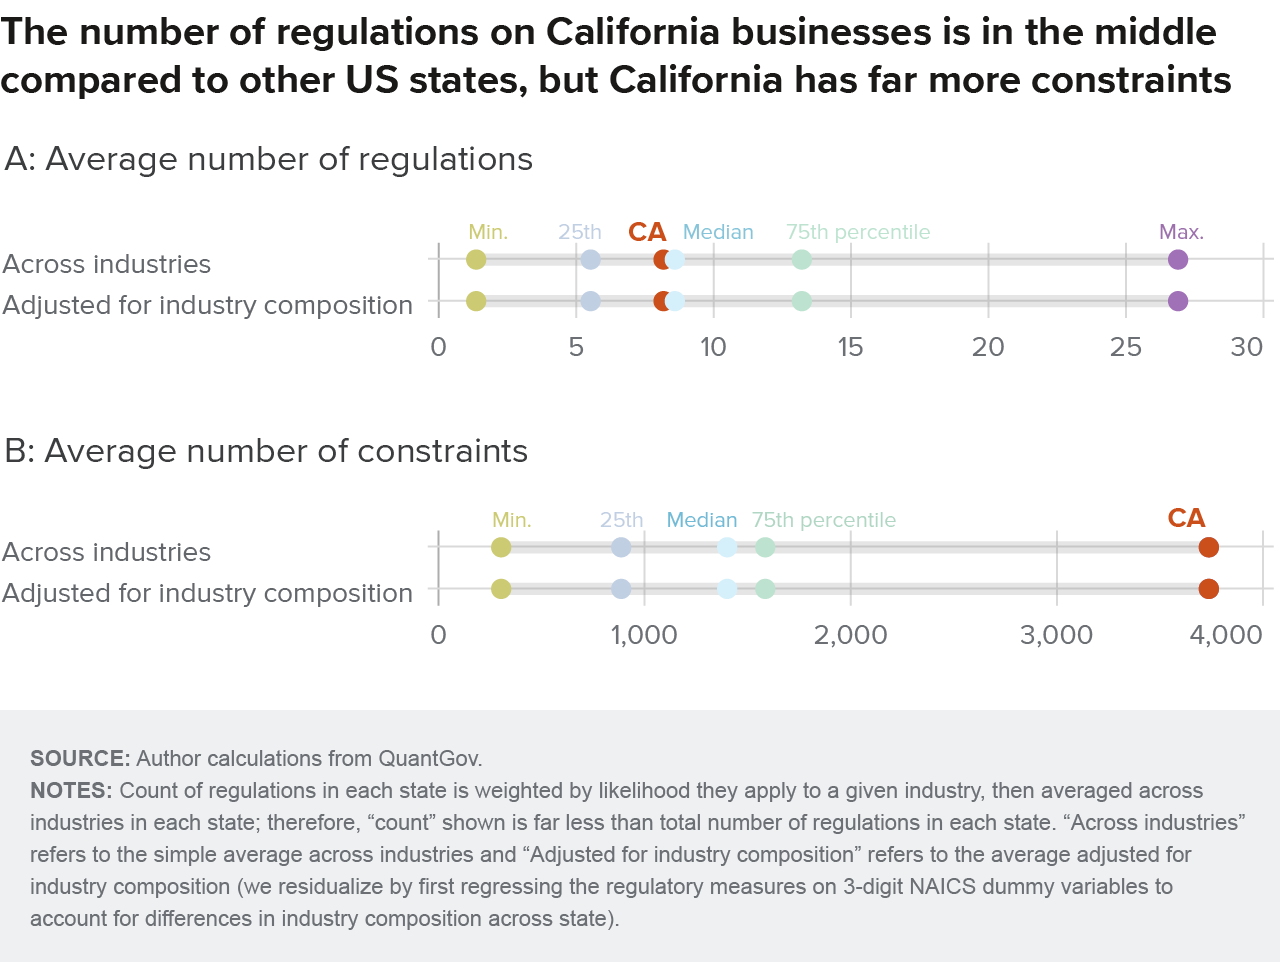
However, a very different story emerges when we look at the number of specific regulatory constraints businesses are subject to (panel B, using QuantGov’s database as described in the text box, earlier). California is the most regulated state in terms of occurrences of “shall,” “must,” “may not,” “required,” and “prohibited,” within the regulations summarized above—as evidenced by the state’s position as the highest outlier, the maximum of the distribution.
In total, there are 420,434 such regulatory constraints in California, and the average business is subject to 3,737 constraints (averaged across industries, as above). This is the highest across states, and the median across states is 1,400.
The sheer number of regulations in a state could be driven by the industries located in a specific state and not necessarily by a state’s disposition to regulation. That is, some regulations apply more to certain industries than others, whether looking at the broad count of regulations or the count of regulatory constraints. For example, it would be erroneous to classify a state as more highly regulated because more industries are present that tend to have high regulation in all states; instead, we aim to capture variation in how states regulate the same industries—a more “apples to apples” comparison of regulation across states.
A prime example of this is regulation in natural resource extraction, like coal mining or oil pumping. Businesses in this industry are subject to more regulation than others, regardless of the state, and are clustered geographically due to availability of natural resources. On average, any given industry sees two to three regulations in the environmental category (probability weighted), but an industry in natural resource extraction is subject to eight regulations.
It turns out that industry composition makes very little difference either to the overall distribution of regulations or California’s position in that distribution. The second bar in panels A and B shows that the pattern of regulation across states is essentially unchanged after controlling for industry composition (“Adjusted for industry composition” bar in Figure 1) and does not affect the conclusion that California is at the middle of the pack on regulation count but at the most extreme of regulatory constraints.
Main Categories of Regulatory Constraints in California
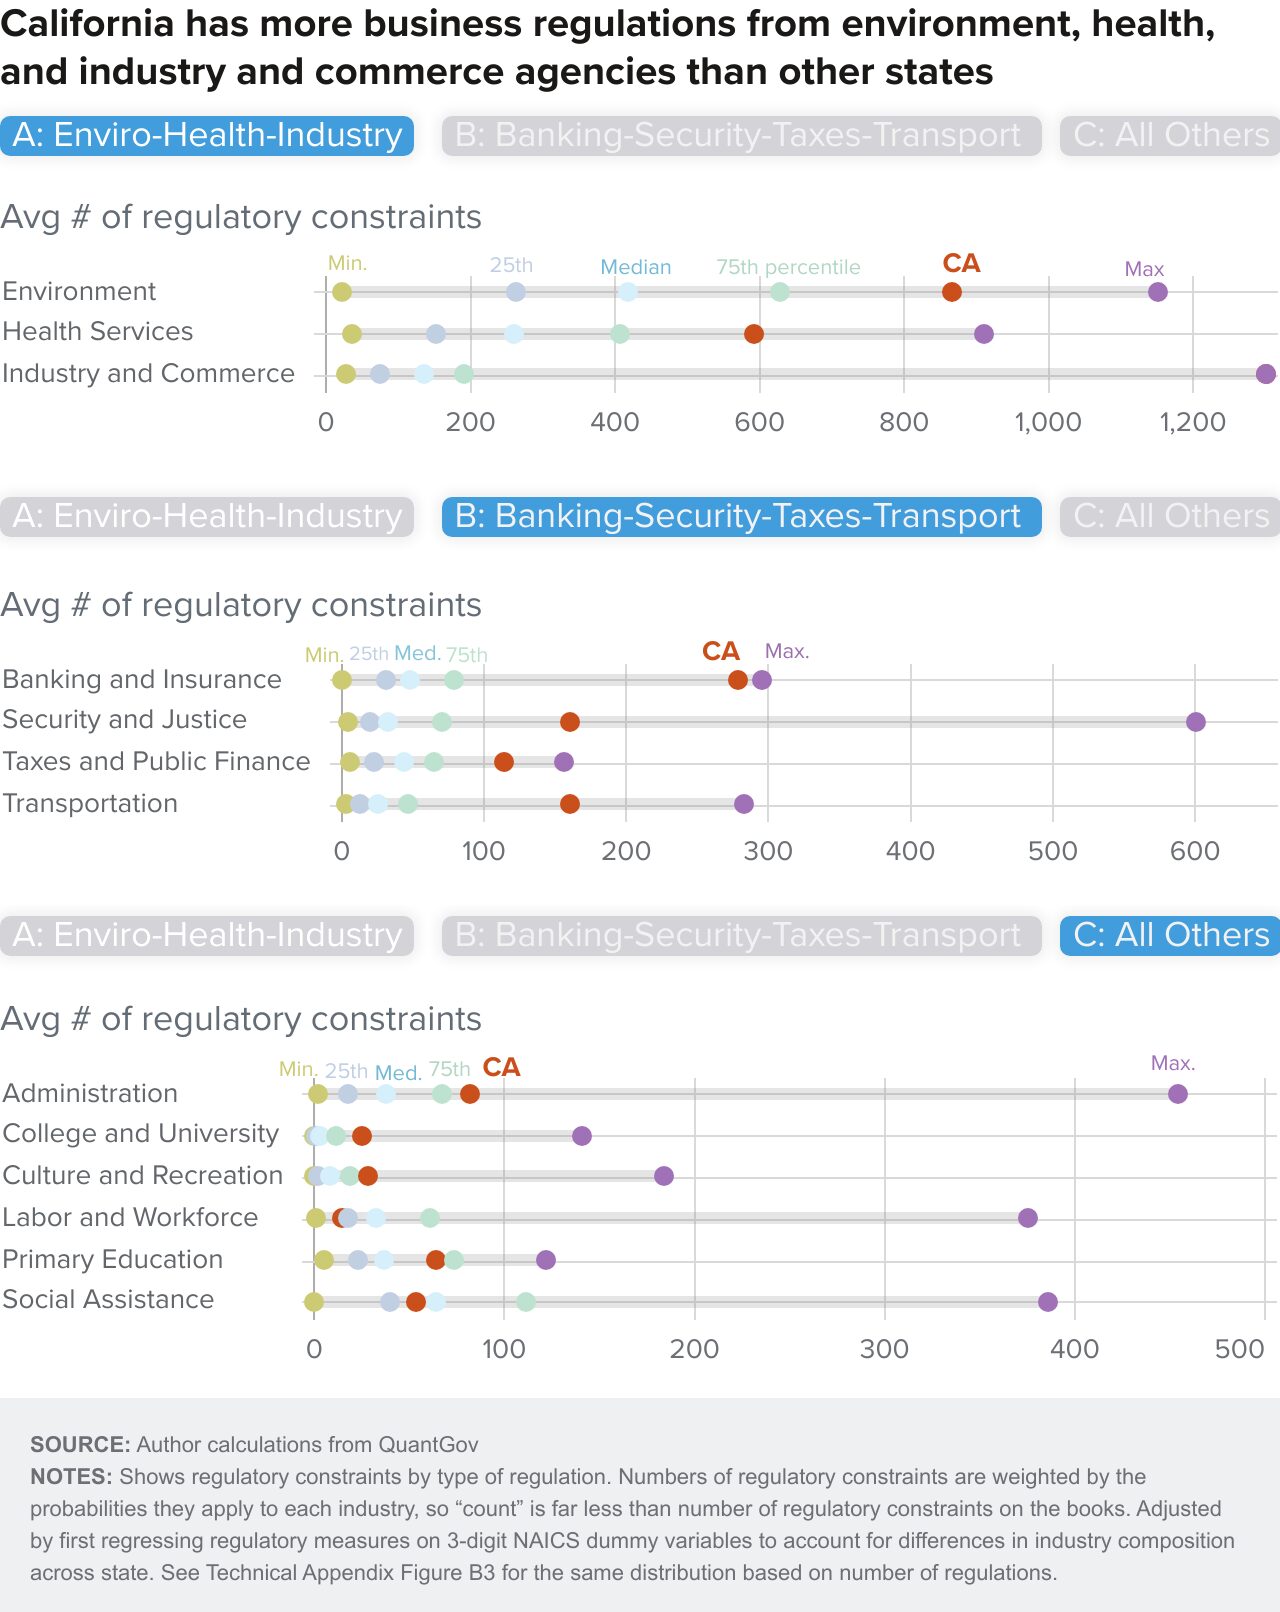
Most of California’s regulatory constraints fall in three categories: environment, health services, and industry and commerce (Figure 2). California is an outlier across states in these three areas, and states vary in how much they regulate in these areas.
The regulatory areas shown in Figure 2 classify regulatory measures by the type of agency responsible for implementation and enforcement. California is also an outlier in regulatory constraints in the banking and finance, security and justice, taxes, and transportation categories, though the numbers are relatively lower in these areas and the range across states is narrower.
These are a set of striking results for California, and it is therefore critical to discuss what we do and do not learn from this and how it comports with policy debate. As outlined above, many stakeholders—and in particular business leaders—view California as highly regulated; furthermore, the “quantification” of regulation is difficult.
The measurement of regulatory constraints depicted in Figures 1 and 2 is a sensible way to go beyond counts of regulations by providing some sense of how they bind businesses. But some of these constraints may matter more than others and be harder to comply with. Additionally, this proxy does not capture deeper concerns about the regulatory environment, like how regulations may conflict or provide unclear guidance to businesses, and how costly they are for businesses.
These concerns would require a different kind of analysis, including examination of the text of regulation, of governance issues around who is responsible for implementing or enforcing regulation, and of the costs (and benefits) of regulation. Nonetheless, the measure of regulatory constraints is a systematic approach to understanding some key aspects of the burden of regulation on business across states and industries—a critical start to analyzing regulation in California.
Regulation of California’s manufacturing sector
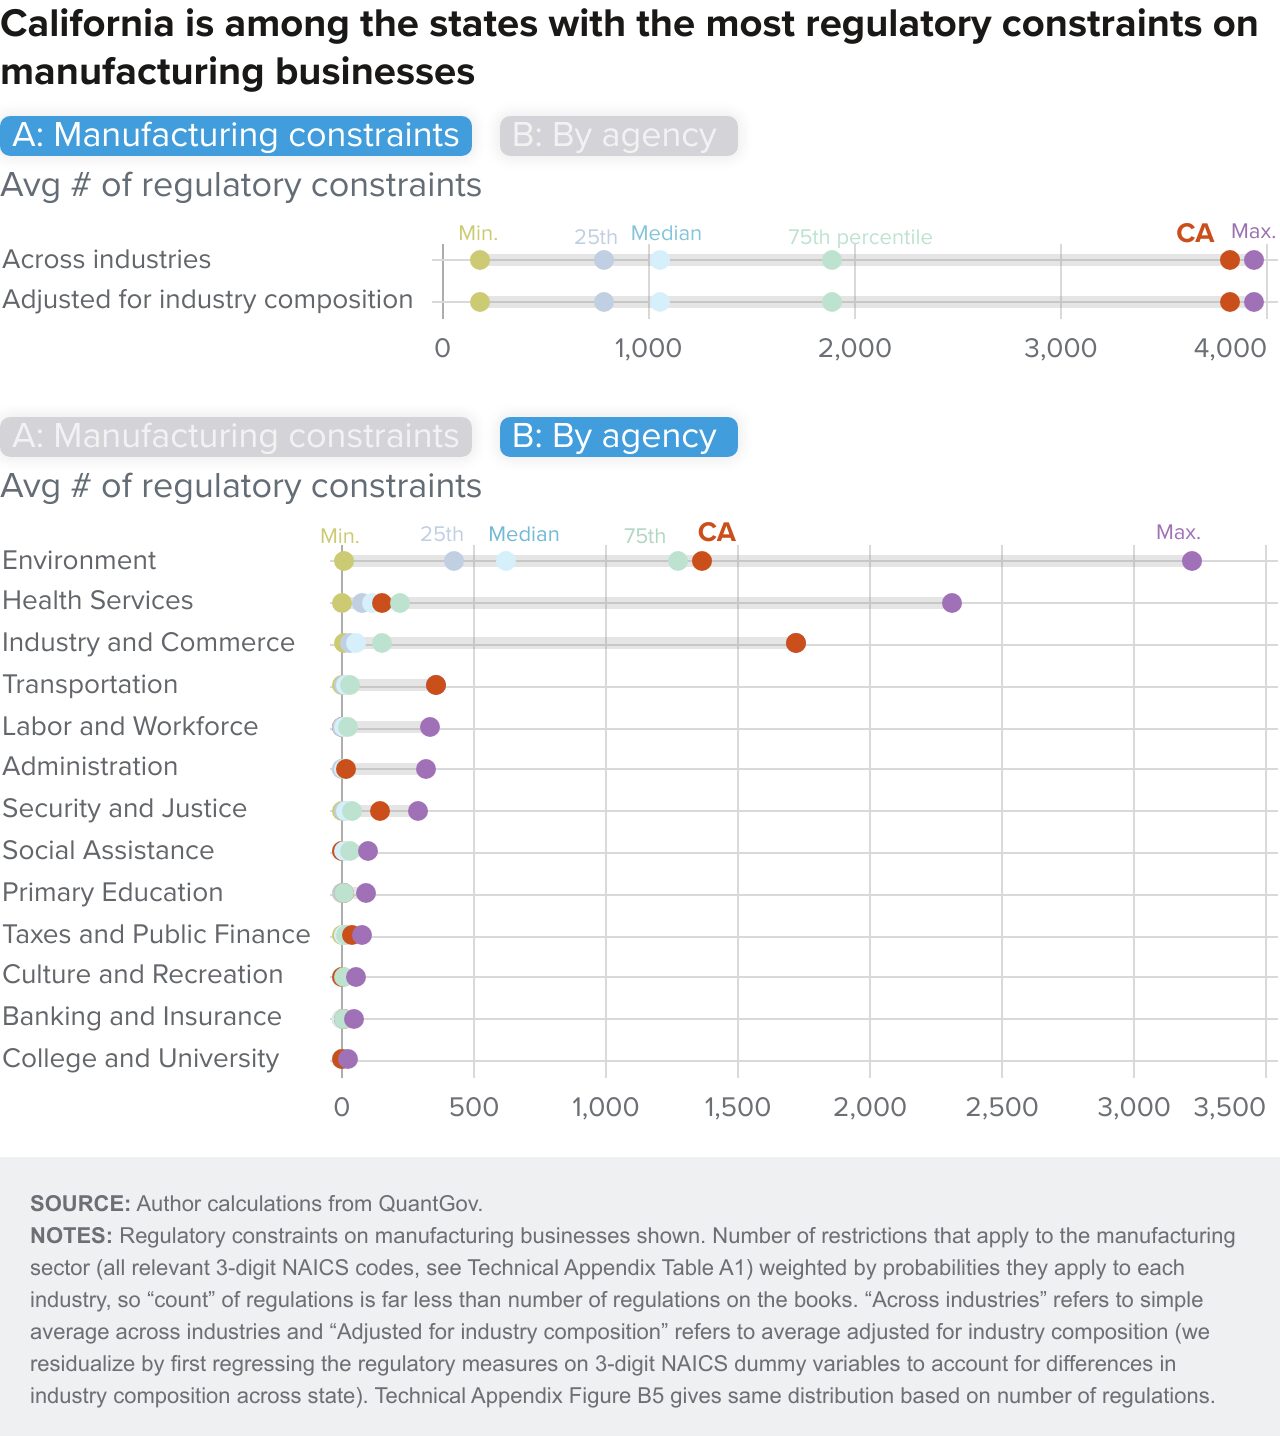
We next zoom in on regulation of the manufacturing sector broadly defined, one of California’s largest sectors and where concerns about the ability to grow in California are acute. As one justification for focusing on manufacturing, our previous study on firms that had been headquartered in California and relocated found that manufacturing firms were the most likely to leave the state; furthermore, firms that relocate tend to choose states with lower taxes and less regulation. The overall results are largely replicated for manufacturing.
California is among the most-regulated states in the manufacturing sector (Figure 3). By way of comparison, the median number of regulatory constraints nationwide for manufacturing is 1,055 versus 3,823 for California. Further, we again see the overall concentration of regulation in the environment and industry and commerce categories (and less so in health services, unlike for California businesses overall).
State Regulation and Business Starts
The scale of regulation that we have presented so far helps shape the business climate in a place (or the perception of it) as being “open for business” or as a barrier to starting a business. Indeed, prior studies of regulation have quantified the impact on delays in business opening, costs of operating, or location choice in particular places, sectors, or situations (Cordes et al. 2022; Hamilton and McCullough 2025; Holmes 1998). However, broadly speaking, does the scale of regulation in a state relate to how many businesses launch? We look at that question here.
While regulation certainly affects existing businesses, its impact on the ability to launch a new business (or new branch) is critical for economic development efforts and job growth. Indeed, if and where to start a business is likely the margin most sensitive to regulation; regulation has been connected to delayed entry of new businesses, reduced entrepreneurship, and greater burden on small businesses in various settings (Ciccone et al. 2007; Chambers et al. 2022).
We measure business starts as the number of new establishments that opened in each state as a share of all establishments (essentially the “start rate” of businesses), using the YourEconomy Time Series database (see Technical Appendix A for details). Between 2022 and 2023, over 50,000 businesses were launched in California, a rate of approximately 1 per every 33 existing businesses (Figure 4).
California has a lower business start rate than the median rate across states; it is also lower than the start rate for the next two largest states, Texas and New York. Manufacturing business starts in California were lower than other business starts, with about 2 per every 100 existing manufacturing businesses and also lower than the median across states, similar to New York and much lower than in Texas.
Business starts in California were relatively low compared to other states

SOURCE: Author calculations from YourEconomy Time Series.
NOTES: Charts show establishment start rates, which are establishment starts between 2022–2023 divided by the total number of establishments in 2022, using YourEconomy Time Series 2022–2023 data. Box plots show the median (middle of the bar), 25th and 75th percentiles (ends of bar), the furthest data points within +/- 1.5x the interquartile range from the ends of the bar (ends of line), and outliers (dots to right and/or left). Panel A uses total establishments and B uses those in manufacturing industries only.
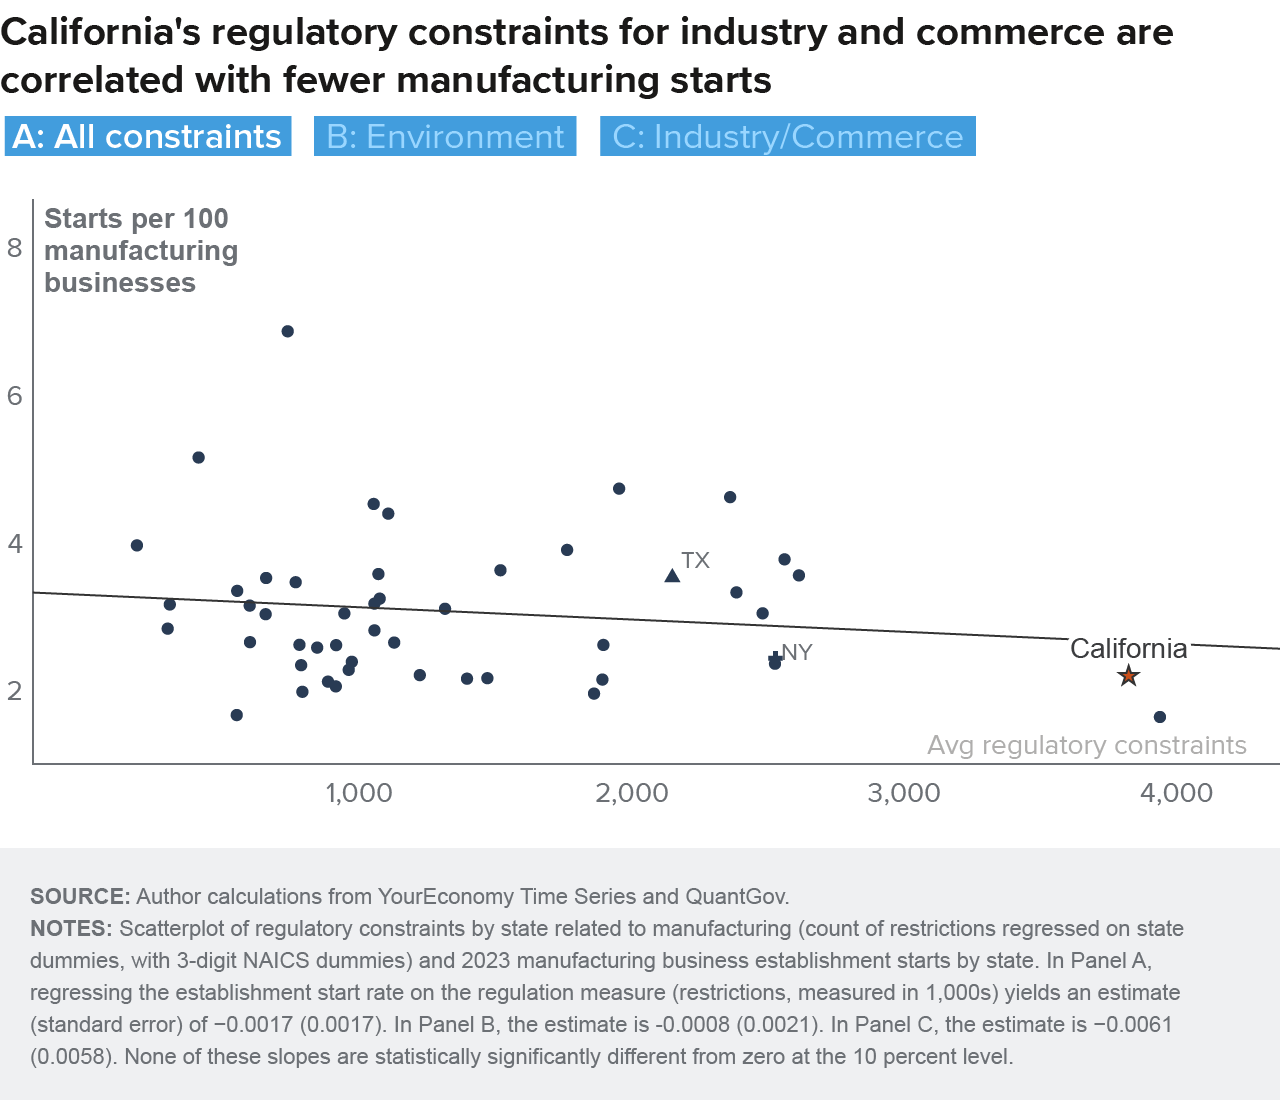
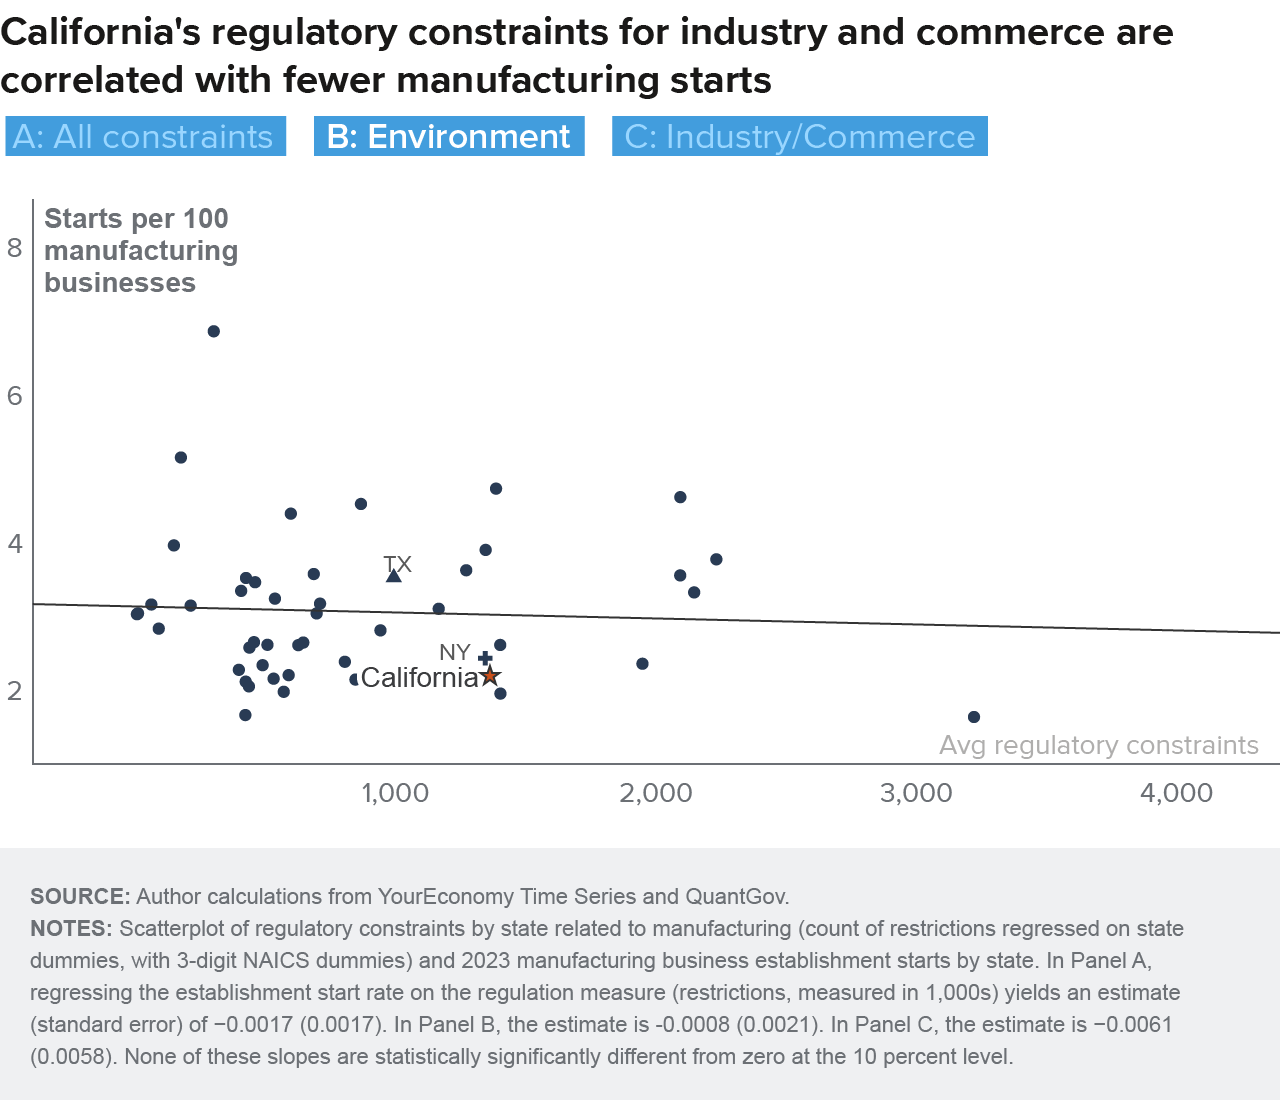
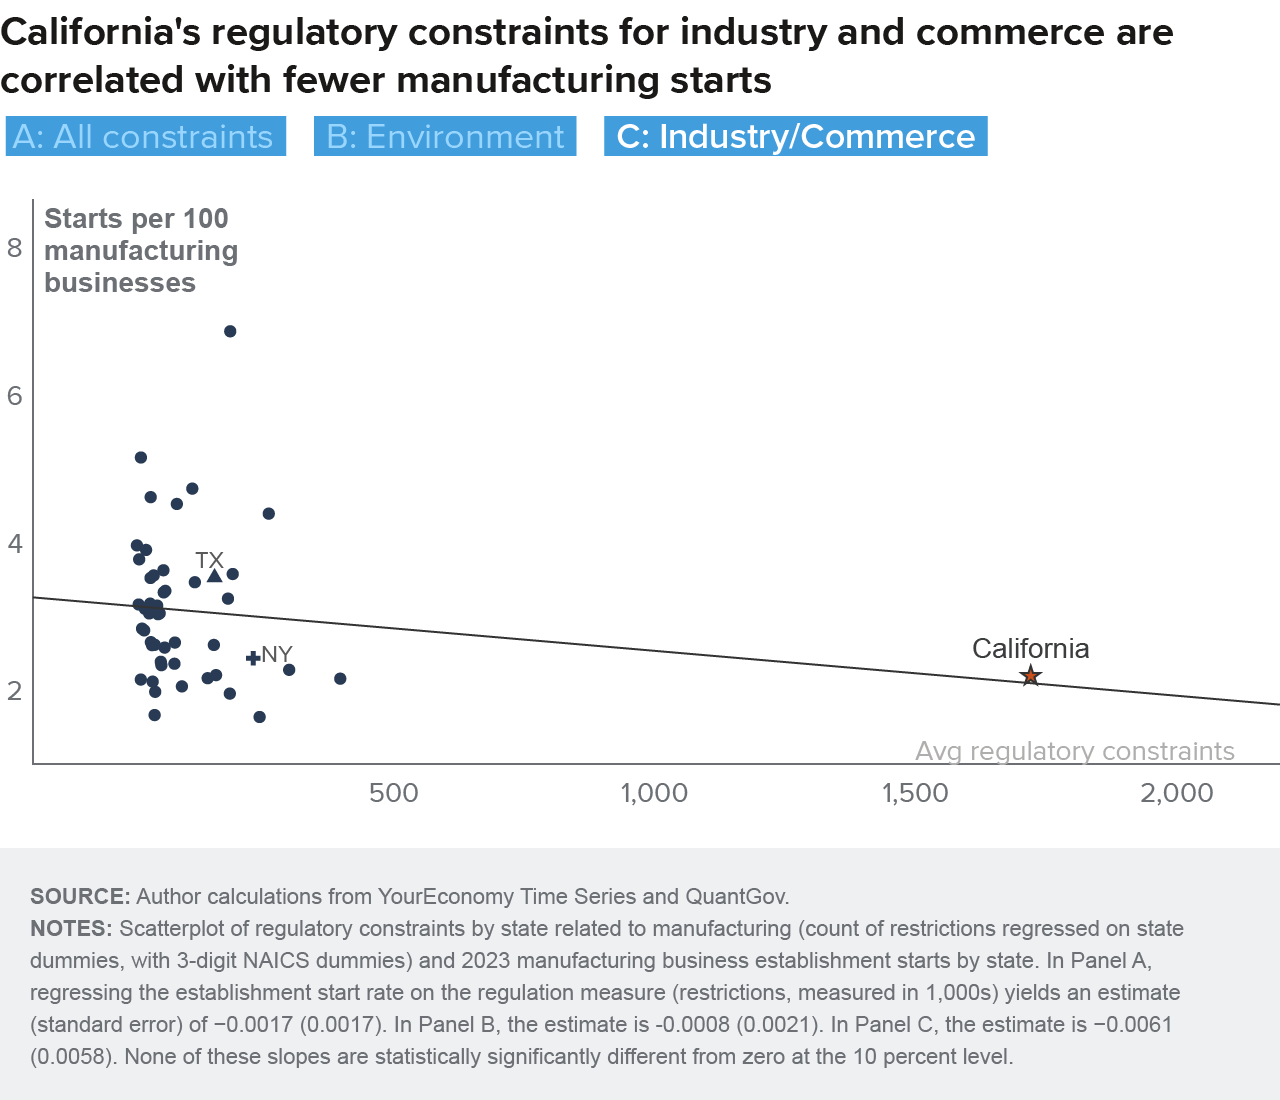
States with more regulatory constraints tend to have lower rates of business starts, both overall and within particular categories (environment and industry/commerce, Figure 5). However, this relationship is not a tight one with strong statistical significance. Compared with other states, California has relatively high regulation, and it has relatively low business starts—making it an outlier (as indicated by California sitting in the right corner of each panel).


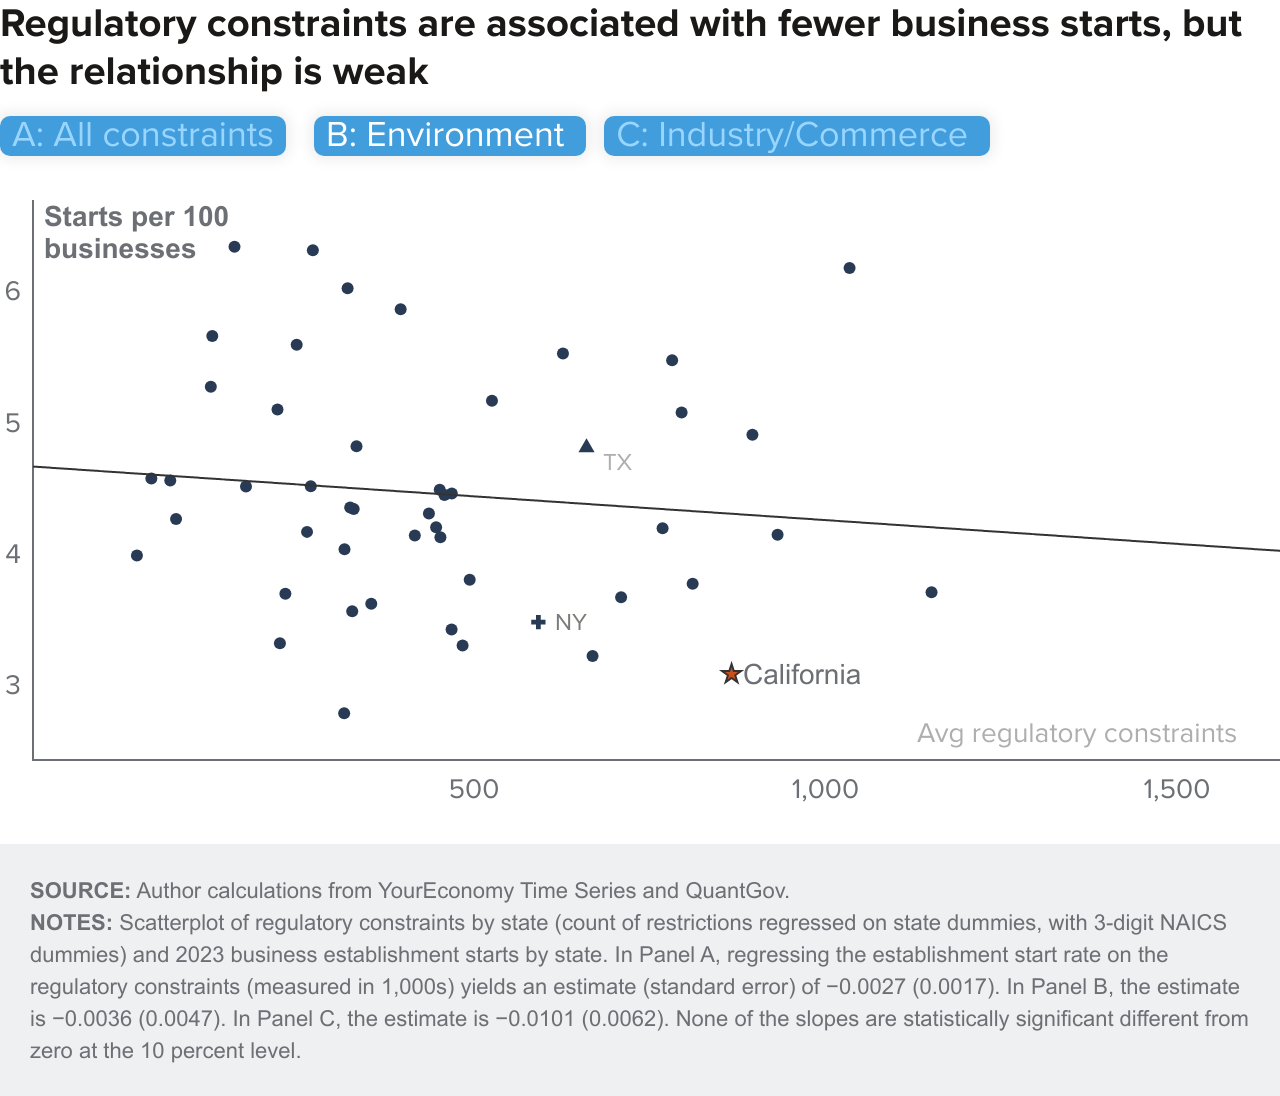

We cannot draw strong conclusions from simple correlations because other factors may affect both business starts and regulatory conditions. Factors beyond regulation drive businesses to start in one place versus another, including taxes, workforce, productivity advantages, and more.
Moreover, businesses often choose to locate in large markets (like California), which could also be correlated with more government infrastructure for regulation. The research literature on regulation has referred to this as the “fixed cost” hypothesis of regulation (Mulligan and Shleifer 2005), arguing that there are fixed costs to setting up and running regulatory institutions, and because these fixed costs can be spread over more taxpayers (or businesses) in a larger economy, larger economies will tend to have more regulations.
Mulligan and Shleifer find that higher-population US states have more pages of legislation and adopt particular regulatory laws earlier than other states (and report higher regulation in larger vs. smaller nations). Law and McLaughlin (2022) present corroborating evidence for US states and industries—with more regulation in larger industries, unrelated to industry-level factors like wages, accidents, toxic emissions, and more, using the same QuantGov data source we use. They do suggest, though, that another explanation of the role of industry size can be political salience of the industry.
Nonetheless, California’s regulatory environment could matter for the type of businesses that do or do not start here, as well as for other business dynamics. Indeed, Bailey and Thomas (2017) find an adverse effect of regulation on starts of small firms (1–4 employees) and firms overall but do not detect any impact on large firms (500+ employees). They also find that more regulatory constraints slow hiring (for firms overall and for small and large firms) and may protect incumbent firms. In general, the relationships we have highlighted here could reflect underlying mechanisms that causally link regulation with business starts—for better or worse—but such conclusions would require a structured analysis to isolate those mechanisms.
Looking at manufacturing alone, the patterns between manufacturing business starts and regulatory constraints are similar (Figure 6). States with more regulatory constraints on the manufacturing industry tend to also have fewer manufacturing starts—though the relationship is not a statistically strong one.
California jumps out as an outlier, especially on industry/commerce regulations related to manufacturing businesses as noted previously, and in the bottom half across states in manufacturing starts. Again, we caution against a causal interpretation. But California being an outlier in terms of regulation, coupled with at least descriptive evidence most consistent with a negative relationship between regulations and business starts, warrants further examination.
Local California Regulations
Businesses are subject not just to state regulation, but also to regulation set forth by their city, county, or region. Decisions about starting a business and/or where to locate or grow can be affected by local regulations as well, especially given that local regulations are often related to permitting.
Taking a similar approach to the prior analysis, we examine the extent to which places within California vary in the scale and nature of regulation on business, using a source that assembles information on permits for businesses seeking to open in California (see text box). The focus on permitting means that the local regulations we study are quite different from the state regulations discussed above.
Across the state, California businesses are subject to about eight local permit requirements on average across industries at the median (Figure 7). Most localities are close to that midpoint, with 50 percent of places between seven and nine permits. We highlight four large cities in the distribution and see that San Francisco is a bit below the median, whereas Los Angeles, San Diego, and San Jose are quite high in the distribution.
Across types (as classified by us, see Technical Appendix Table A4), we see that permit requirements are more pervasive in public safety, environment, identification/incorporation, and building and zoning. There are more regulations of these types across most localities, as well as more outlier localities at the top end. The four large cities do not particularly stand out. For manufacturing businesses, the number of local permitting requirements is distributed very similar to that for businesses overall (panel B).
Note that we do not have a measure for regulatory stringency akin to that in the state-level data, where we saw that rankings were quite different for restrictions as classified in QuantGov versus simple counts of regulations. Nonetheless, we believe that what we capture here with CalGold is more akin to regulatory constraints—not in quantity but in the scale of restrictions to which a new business is subject—because CalGold endeavors to list permitting requirements. That said, we have no information on cost or other difficulties of complying.
Distribution of permitting requirements across California localities
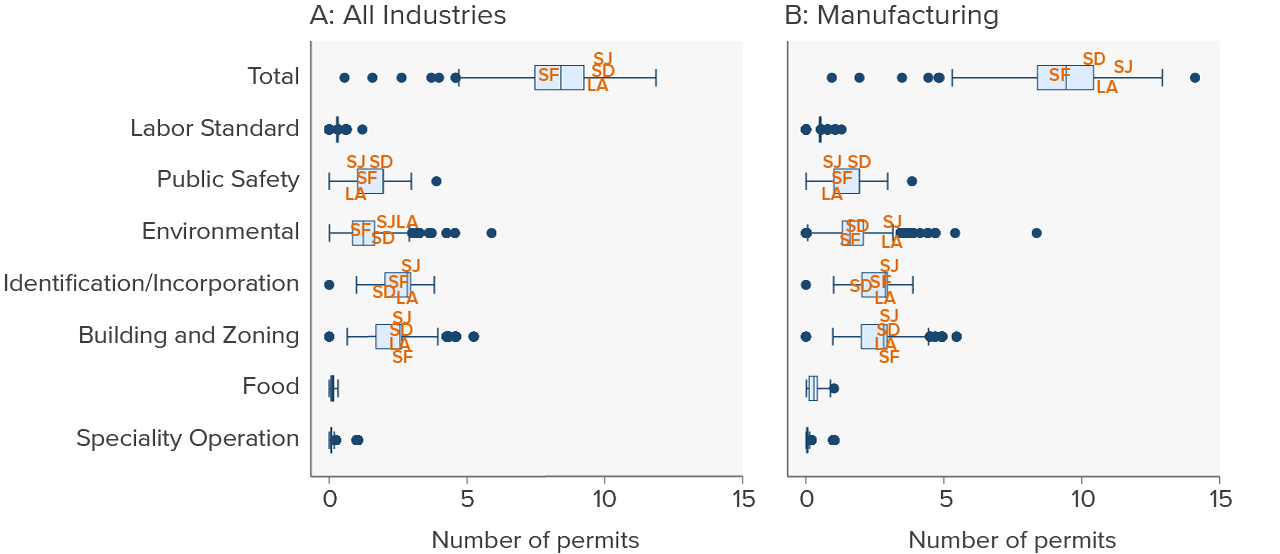
SOURCE: Authors’ analysis of CalGold data.
NOTES: Box plots show the median (middle of the bar), 25th and 75th percentiles (ends of bar), the furthest data points within +/- 1.5 times the interquartile range from the ends of the bar (ends of line), and outliers (dots to right and/or left). “Total” refers to the distribution of permits, and remaining rows describe permits by category (all are adjusted for industry composition). Approximate values are displayed for San Francisco (SF), Los Angeles (LA), San Diego (SD), and San Jose (SJ). The number in each locality is the average across CalGold business types.
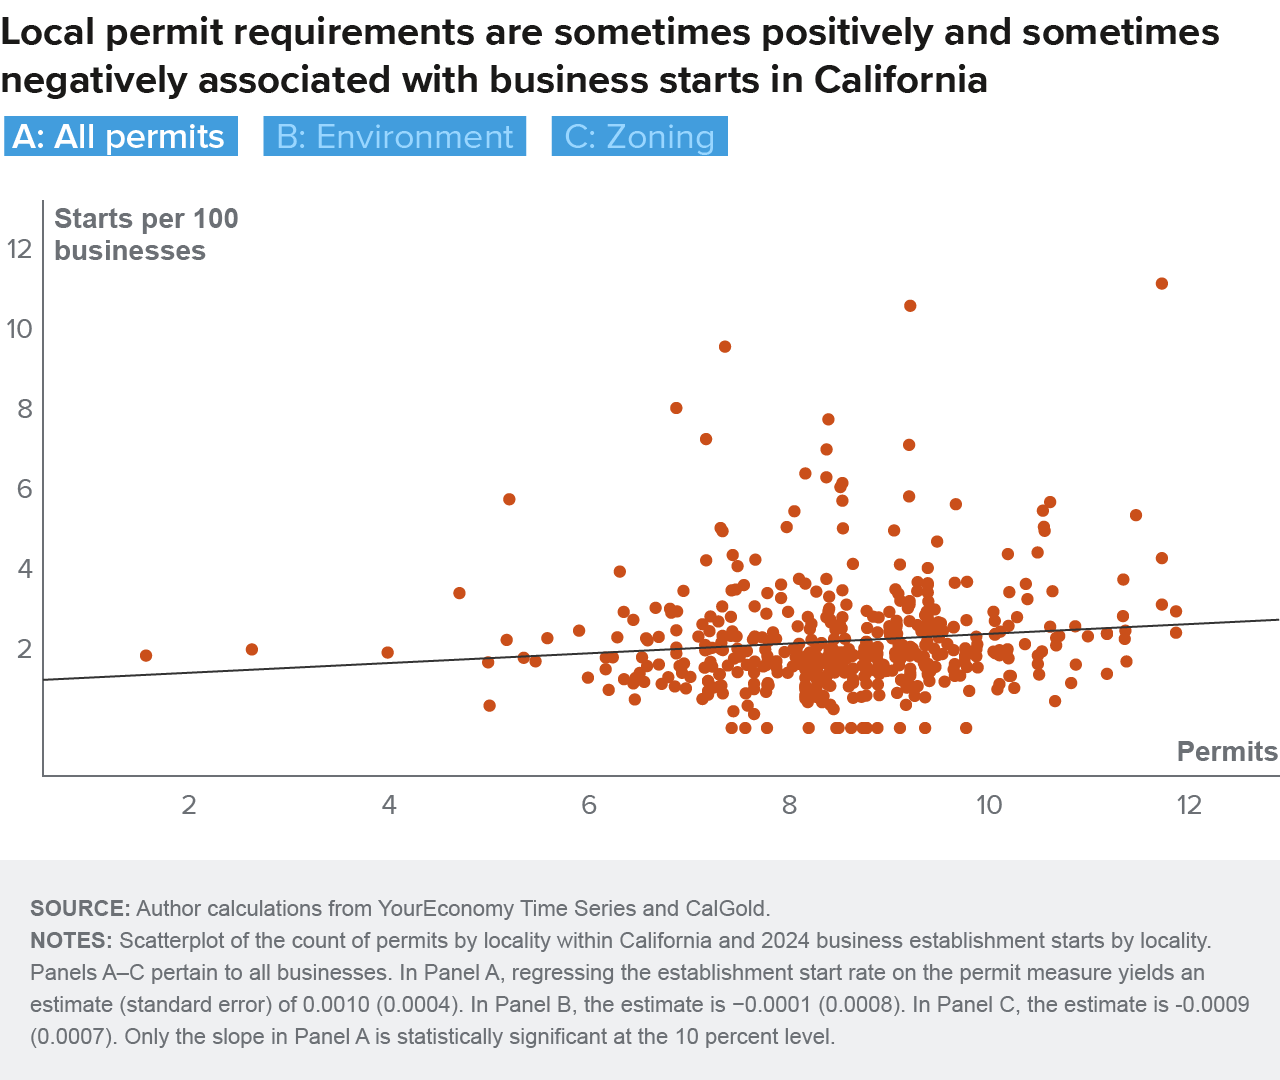
We find no consistent relationship between regulation and business starts when applied to permitting requirements at the local level across California. Figure 8 shows results for all types of permitting requirements and, mimicking two areas similar to the cross-state data above, local permit requirements pertaining to environment and building/zoning. Building and zoning regulations include building and construction permits, requirements for a certificate of occupancy, and sidewalk vending permits. Examples of environmental regulations include a hazardous materials license, industrial wastewater permits, and pesticide license registration (see Technical Appendix Table A4 for more examples).
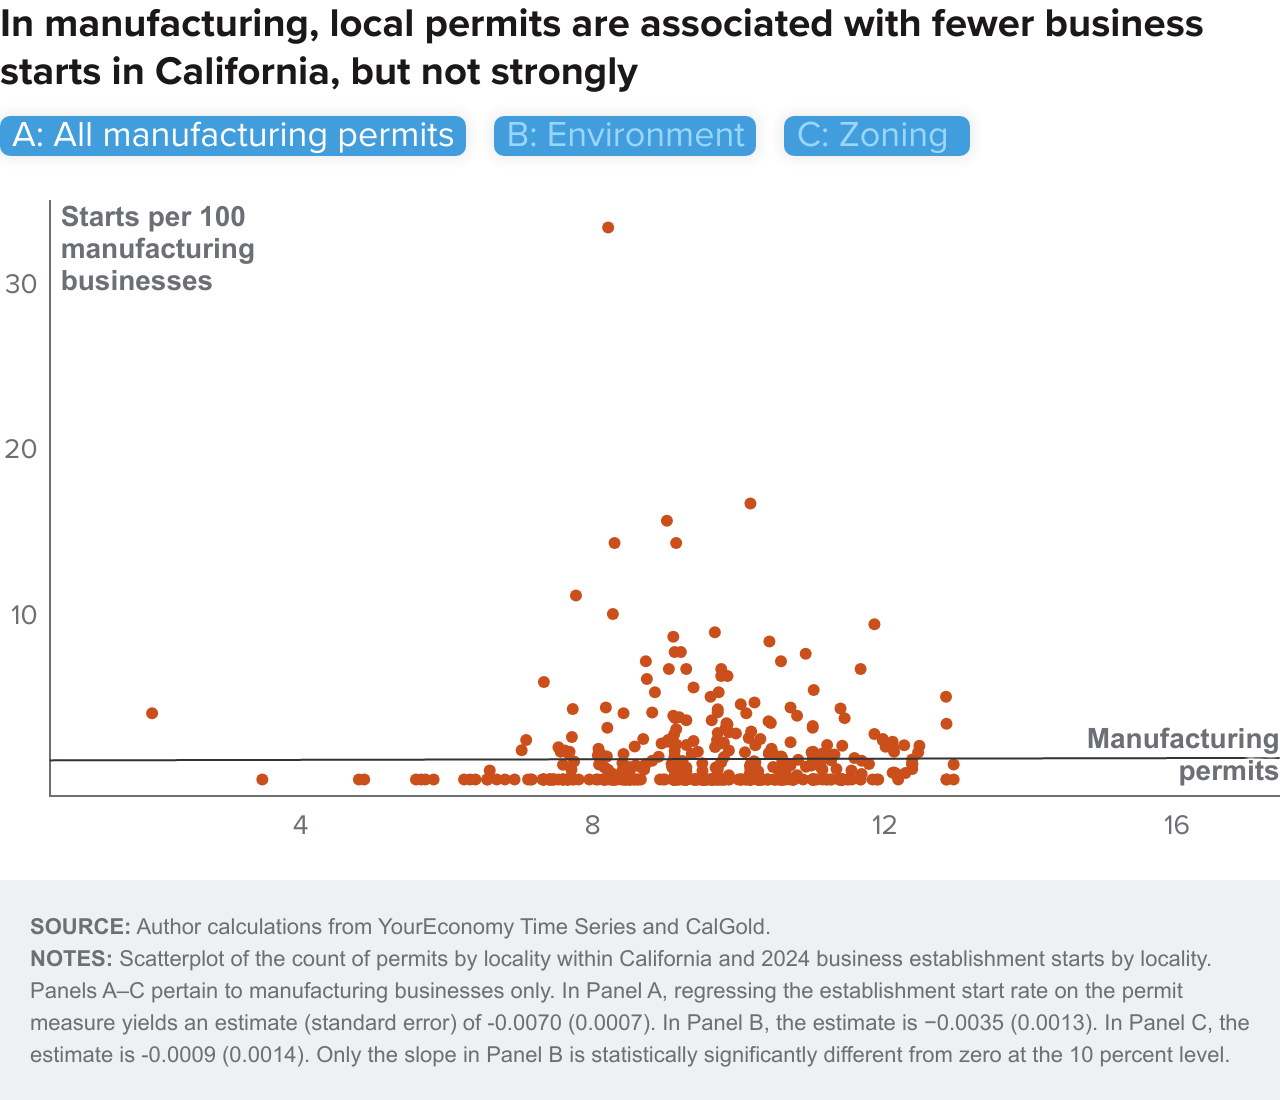
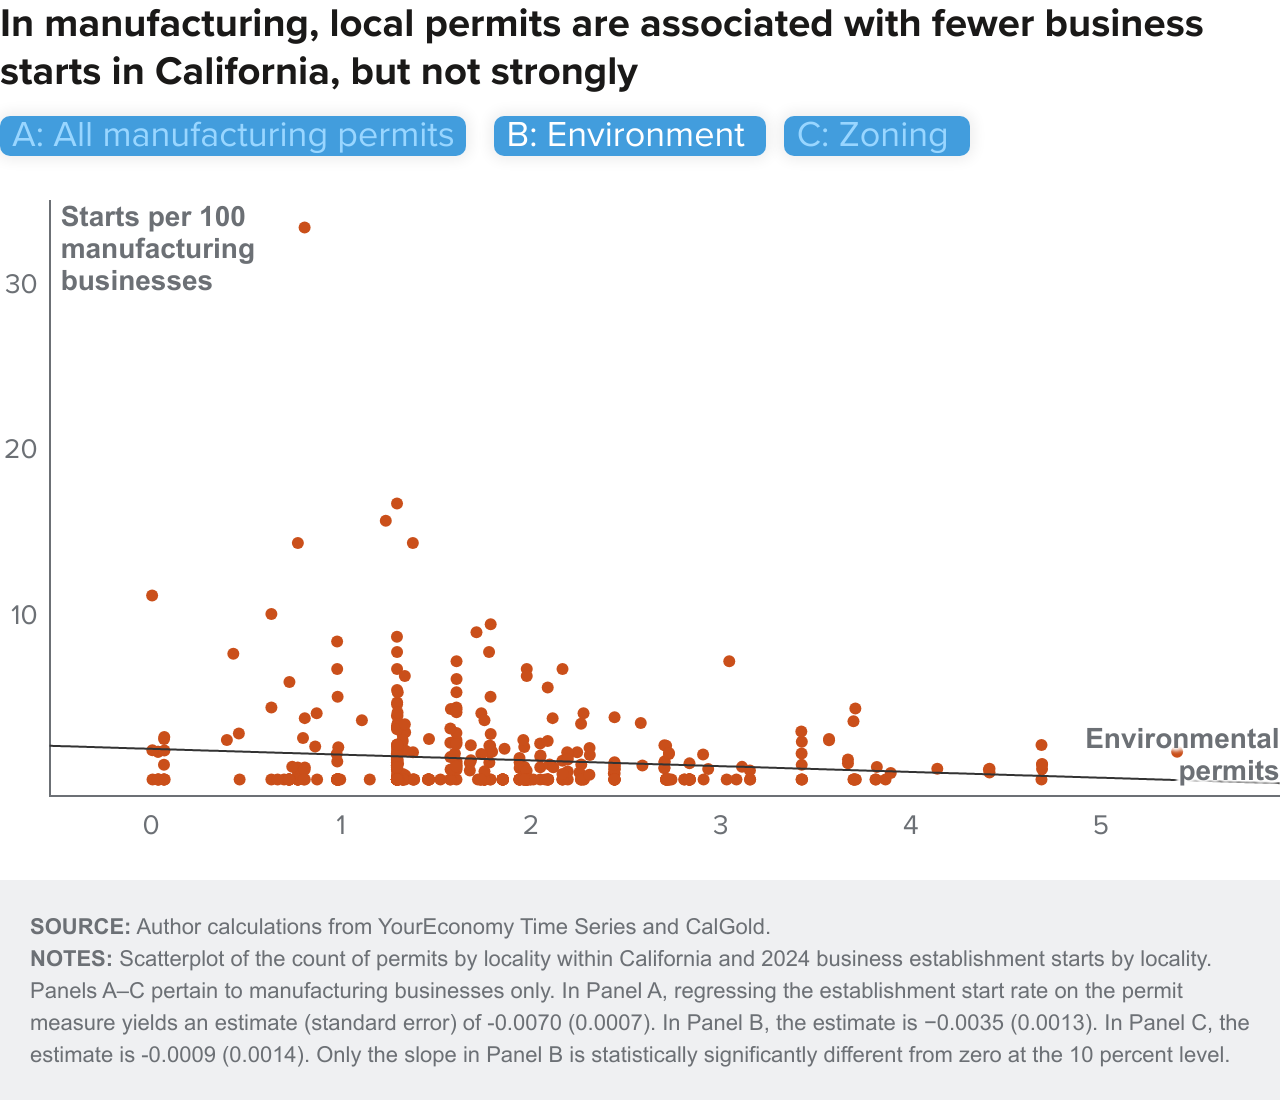
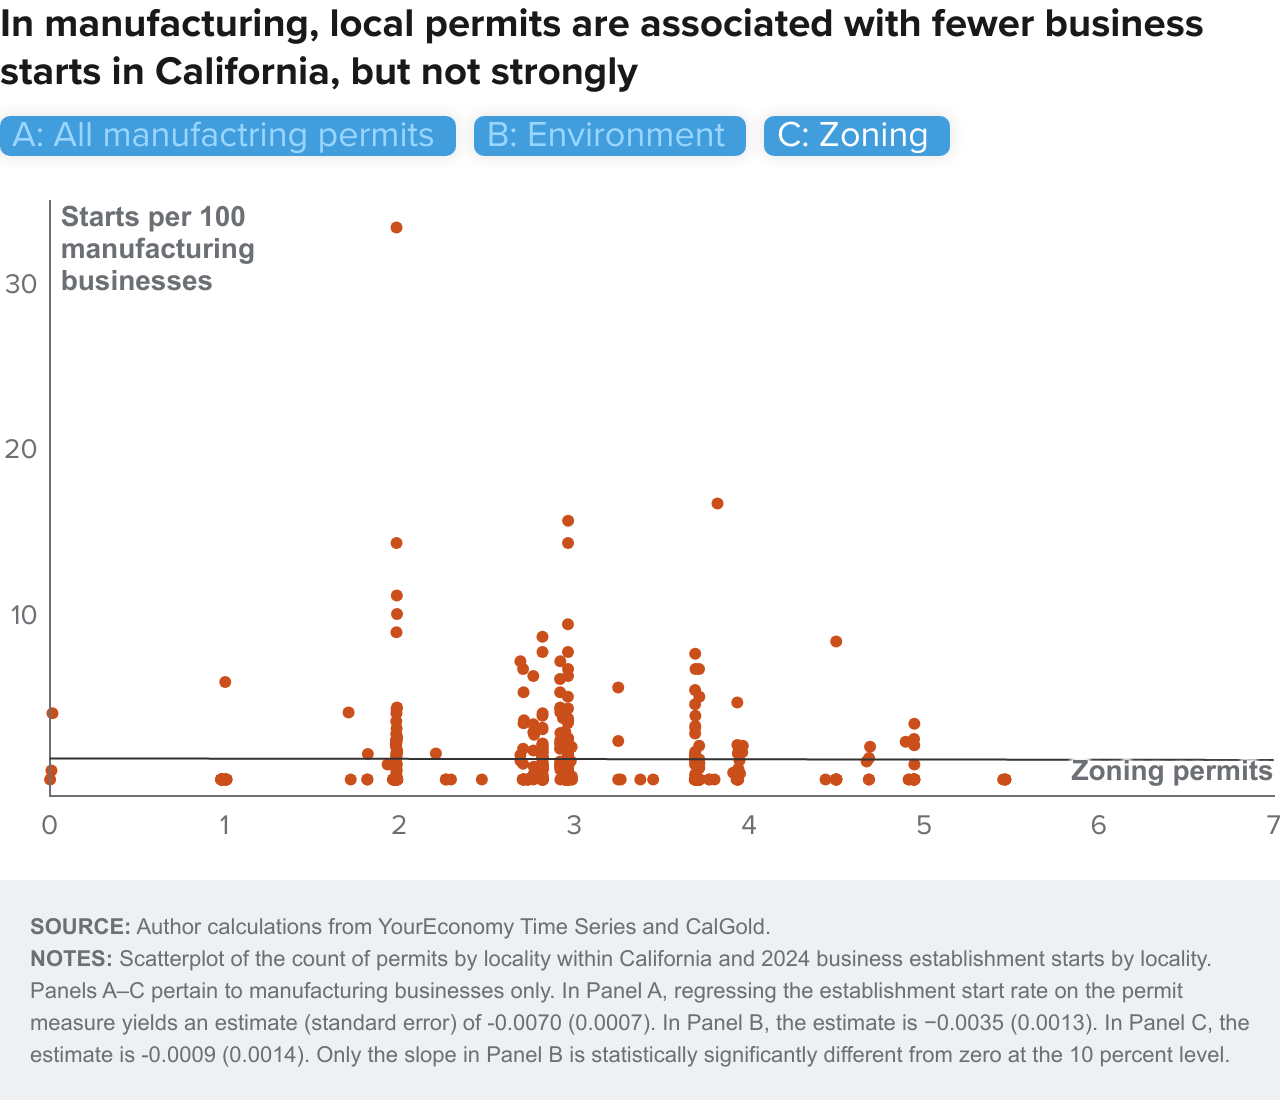
Across localities, the correlations between business starts and permitting requirements are sometimes positive and sometimes negative depending on type of permitting requirement and whether we are looking at all businesses (Figure 8) or only manufacturing (Figure 9).
Although we should not read much into what is statistically and inconsistent evidence, it is perhaps interesting that for all businesses the correlation between starts and permitting requirements overall is positive (and statistically significant; panel A), possibly consistent with the “fixed cost” hypothesis. However, this relationship is negative for manufacturing in all three panels of Figure 9, which is, on the surface, consistent with stakeholder concerns about challenges to manufacturing in California.


Conclusion
Our analysis of business regulation in California leads to a number of conclusions and questions. First, at the statewide level California is not an outlier nationwide in the quantity of business regulations, but it is an outlier based on how restrictive regulation is. These basic facts are consistent with perceptions routinely expressed by business owners and leaders in the state about the high regulatory burden faced by California businesses.
Second, our descriptive analysis suggests a negative relationship between state regulation and business starts, both overall and in manufacturing to some extent, a pattern of more regulation related to industry and commerce and fewer manufacturing establishment births stands out. That said, these relationships are not statistically strong and we reiterate that our analysis is descriptive.
In future work we will carry out more structured analyses of regulation and business starts (as well as other business outcomes) that provide evidence on the causal impacts of regulation. Nonetheless, it is noteworthy that higher state-level regulations are associated with lower business starts for all industries and for manufacturing.
Third, we do not find that California’s large cities are outliers compared to other cities in terms of regulation when we look at similar questions for localities. We find more ambiguous evidence on the relationships between regulation (in this case permitting) and business starts; although the relationship appears to be negative for manufacturing.
We close by emphasizing that assessing the impacts of regulation is difficult. Regulations are hard to quantify, and this is even more challenging because different regulations can interact—for example, by contradicting each other or by creating layers of complexity that can increase costs of compliance. Moreover, administration and implementation can vary. For example, does the state or local government easily provide information on how best to comply? And are procedures for resolving conflict streamlined and low-cost, or cumbersome and costly (e.g., litigious)?
Finally, the costs imposed by regulation, varying in part by how stringent they are, are not fully captured in our data. Moreover, the costs of regulation may sometimes be warranted by the intended and actual benefits of the regulation to individuals, the community, and broader market—a broader set of questions outside the scope of this study.
Another complication is that there are many potential business outcomes to look at; in this report we have only presented evidence on new business starts. Whether existing businesses grow faster or close at a higher rate, whether jobs created are higher- versus lower-paying, and whether regulations achieve their desired goals, are all relevant barometers for assessing the impacts of regulation. In addition, there are potential policy design questions about how regulation can be made more effective at achieving its goals while reducing economic costs and distortions.
In future research, we intend to dig deeper to provide both a more comprehensive perspective on regulation and deeper evidence on how regulations affect the economy in California.
Topics
Economic Growth Economic Trends Economy