

Table of Contents
- Key Takeaways
- Introduction
- Key Realities of California’s Care Workforce
- Demand for Care Workers Will Surge over Next Decade
- Key Challenges of Expanding the Care Workforce
- Training Pathways in the Care Workforce
- Looking Forward
- Notes and References
- Authors and Acknowledgments
- PPIC Board of Directors
- Copyright
Key Takeaways
California’s care sector is at a critical juncture. The state recently developed master plans to address the needs of its aging population and provide more comprehensive early childhood learning and care. Successful implementation of these plans will involve meeting growing demand for care services, which in turn relies on the workers and businesses who provide essential, hands-on services to young children, older adults, and people with disabilities. This report offers an overview of the current realities and future challenges in the care sector workforce.
- Latina and Black women make up a disproportionate share of California’s care workforce, as do foreign-born residents. This racial/ethnic makeup has not changed much in recent years, but the workforce is aging rapidly. While the diversity of the workforce may help meet the culturally specific needs of those receiving services, the aging of these workers makes meeting growing needs even more challenging. →
- Many care workers earn low wages. In the first quarter of 2023, median hourly wages ranged from a low of $15.60 for home health and personal care aides to a high of $20.10 for certified nurse assistants. Child care workers earned about $18 and preschool teachers earned $19.50 per hour. We find that about a quarter of care workers are poor or near poor, and between 30 and 40 percent rely on social safety net programs. Business supports that help self-employed care workers manage operating requirements and access capital could boost economic stability. →
- Demand for care services is growing, as California’s population ages and people live longer, and as the state invests in early childhood care and education. Home health and personal care aide jobs are among the fastest-growing in California, projected to increase 29 percent by 2030. Projected growth in child care jobs over the next decade is much lower, though state investments in subsidized child care and transitional kindergarten may help shift the type of early care and education workers who will be needed. →
- Turnover and part-time hours are key workforce challenges. Care workers are more likely than those in other jobs to switch employers or leave the labor force, deepening the need for new workers. Also, most care workers are employed part time, with some variation across types of jobs. Boosting the number of full-time workers could help meet growing labor demand, but workers report family obligations and other considerations as impediments. →
- Affordability of care services is already a major challenge both for government payers and for families who pay out of pocket. Government plays an outsized role in the care sector primarily through Medi-Cal and subsidized early childhood programs. The high cost of private care services often means people rely on unpaid care from family members and/or do not get the amount of care they need. →
- Training is essential for getting workers into growing caregiving jobs; it may also help some care workers advance—though our research suggests earnings mobility and training pathways are limited. State investments in training and broader efforts to increase wages run up against fiscal realities, especially when there are budget constraints. One approach would be to establish universal core competencies that can be attained through training or job experience and tie them to a clear wage progression. →
Introduction
California’s care workforce provides essential services for children, older adults, and people with disabilities in home, community, and residential settings. These services are critical to Californians’ quality of life. Though meeting the demand for quality, affordable caregiving services has long been a major policy concern, the growing population of older adults will put additional pressure on policymakers to address needs in this sector.
Changes in both health and education policy could further shift care workforce needs. For example, policy reforms aimed at expanding financing options for long-term care—including Medi-Cal paying for assisted living facilities or a payroll tax that would fund long-term care for most workers—could increase demand for direct care workers. Likewise, the expansion of transitional kindergarten to nearly all four-year-olds by the 2025–26 school year will shift demand for early care and education (ECE) workers more toward public school settings and will likely have implications for the sector more broadly.
A key challenge to meeting the needs of the caregiving sector is attracting and retaining workers in occupations that generally pay low wages and offer limited opportunities for career advancement. Many other sectors that face workforce shortfalls can increase wages, but care services are often already too expensive for many California families who need them. In addition, state and federal policy choices and budget constraints also play a role in how much care services cost and what workers are paid.
To prepare for these challenges, the state has created a Master Plan for Aging as well as a Master Plan for Early Learning and Care that seek to address and support families and individuals with caregiving needs. An available, skilled, and supported workforce is a necessary element to both master plans. Several recent state investments and actions aim to address workforce issues in the care sector, including support for training programs and increasing wage levels through payment reforms and collective bargaining.
Our focus is on paid caregivers—in particular, primary caregivers who support daily living and well-being, rather than other professionals—such as nurses, K–12 teachers, doctors, counselors—who provide “care” in the broader health and education services landscape. It is important to acknowledge, however, that unpaid caregivers—most often family members, neighbors, and friends—are also a crucial source of caregiving. A recent estimate suggests unpaid labor provided by family caregivers in California contributed $63 billion in value as of 2017: one in four family caregivers provided 20 or more hours of care per week, with most receiving no payment (Tan et al. 2021). In some cases, unpaid caregiving takes the place of unaffordable or unavailable paid caregiving.
In addition to analyzing labor market statistics and household survey data, we engaged in discussions with experts in California’s direct care and ECE workforce, including worker advocacy organizations, nonprofit training providers, business owners, industry association groups, county workforce development staff, union representatives, and policy researchers. We held two stakeholder workshops and conducted several one-on-one interviews. Throughout the report, we highlight key takeaways from these discussions.
In this report, we profile current care workers and projections of future care workforce needs. We then survey the challenges of increasing the workforce due to characteristics of both the jobs (e.g., low wage levels and part-time hours) and the sector as a whole (e.g., payers of caregiving services). Finally, we examine the potential for advancement via training, job transitions, and career pathways.
Key Realities of California’s Care Workforce
An understanding of the components of the direct care and ECE workforce—including the types of providers and programs along with profiles of current workers—is an important basis for a discussion about expanding and supporting this critical workforce.
California Has a Large Care Workforce—but Exact Measurement Is Difficult
Labor market statistics from the California Employment Development Department (EDD) indicate that about 6 percent of California’s jobs were in care occupations as of May 2022. Compared to other job categories in the state, the care workforce is quite large, similar in size to the construction or food service industries (Thorman et al. 2024). Nearly 900,000 jobs were in direct care and about 83,000 in early care and education (Figure 1). Most are home health or personal care aides (778,000) which are combined in a single category in the labor market data.
Most paid caregivers are home health or personal care aides
Thousand

SOURCES: Occupation Employment and Wage Statistics (OEWS) Data – EDD, 2023, and American Community Survey (ACS) – IPUMS, 2022.
NOTES: Estimates of care jobs are from OEWS and reflect employment totals for May 2022. Nurse Assistant estimates include those working in hospital settings. Estimates of self-employed workers are from ACS 2022, which is collected monthly throughout the year.
As large as these estimates are, some paid caregivers are not included. First, many care workers are directly employed by families or are family members themselves (e.g., employed via In-Home Supportive Services); these workers may not be captured in official labor market data if their employment arrangements are not formal. Second, a considerable number of care workers are self-employed and therefore not included in the EDD job counts. Capturing self-employed ECE workers is particularly important, as most licensed family care providers are self-employed. Indeed, about 44,000 child care workers report being self-employed—considerably more than are captured in labor market statistics.
Third, as we’ll see below, many care workers have part-time hours and may work multiple jobs. So, at any point in time, a count of the number of care jobs is not one and the same as the number of people employed in caregiving jobs. Administrative data provides insights on the latter. The IHSS program, administered by the California Department of Social Services (CDSS) and funded by Medi-Cal, tracks the number of workers providing personal care services through the program. According to monthly program data, in August 2023 there were about 635,000 active providers serving IHSS enrollees. Over 70 percent of IHSS providers are family relatives and 58 percent live with the person for whom they provide care. Given that so many IHSS providers are relatives—including parents and spouses—they may have other jobs and not be reflected as care workers in typical data sources.
Finally, statewide worker registries and state licensing data provide additional insights. Several categories of caregivers—including home health aides, certified nursing assistants, and preschool teachers—must maintain active licenses or educational credentials. State licensing data indicates there were about 138,000 people with active CNA licenses and about 25,000 active HHA licenses as of January 2024. Worker registries are designed to connect workers to employment, help families vet potential caregivers, and, in some cases, provide a means to track licensing and training requirements. The Home Care Aide registry administered by CDSS provides background information on home care aides and had 107,000 registrants as of September 2023. There is also an Early Care & Education Workforce Registry that tracks educational, training, and experience levels for ECE workers in certain counties. In October 2023, about 147,000 ECE workers were registered and about 90,000 were considered active. An important caveat to worker registries and licensing data is that they do not tell us if people are currently working in the caregiving sector.
Small business owners are also key parts of the care workforce
Nearly all businesses that provide care services—including licensed family child care providers, child care centers, skilled nursing facilities, assisted living facilities referred to as residential care facilities for the elderly (RCFEs), and adult day health centers, among others—must be licensed by the state. Several of these businesses, such as small and large family child care providers and small RCFEs, also known as board and care homes, typically operate out of someone’s home and offer care services to a small number of people. Better integrating state licensing data for care providers and their workers could ease reporting requirements for small business owners; further, a system for connecting skilled workers with small business owners could facilitate hiring. There are also models for helping home care workers become self-employed; for example, Courage Home Care is a cooperative, employee-owned company that helps personal care aides improve earnings and working conditions.
Care Workers Are Predominantly Female, over 40, and Latino or Black
Women dominate the care workforce, making up nearly 80 percent of direct care (Figure 2) and 95 percent of ECE workers (Figure 3). Latino (42% for direct care and 46% for ECE) and Black (10% direct care and 6% ECE) caregivers are overrepresented relative to their share of the state’s total workforce, and Asians are overrepresented in direct care (Thorman et al. 2024). In contrast, white workers are underrepresented among the care workforce (Technical Appendix Table C2).
Most direct care workers are female and over 40 years old
Percent

SOURCE: American Community Survey (ACS) – IPUMS, 2021 and 2022.
NOTES: Includes Californians 18 and older who were employed in the past week. Occupation is based on a person’s primary job where they work the most hours. Nursing assistants exclude those who work in hospitals.
Women are even more dominant in the ECE workforce, which tends to be younger
Percent

SOURCE: American Community Survey (ACS) – IPUMS, 2021 and 2022.
NOTES: Includes Californians 18 and older who were employed in the past week. Occupation is based on a person’s primary job where they work the most hours. Preschool teachers exclude those who work in elementary or secondary schools to separate out kindergarten teachers also included in the occupational category.
The care workforce in California is relatively old and getting older. About two-thirds of direct care workers are over 40 and about 37 percent are over 55. ECE workers in preschools and other child care settings are younger on average than direct care workers, with about 50 percent of them between 18 and 39 years old.
Most (55%) of California’s care workers are US-born, but the share of foreign-born workers is larger than the share in the workforce overall. About 47 percent of direct care workers are foreign born, including 46 percent of nursing assistants and 47 percent of personal care aides. One in three (33%) preschool teachers are immigrants, compared to 45 percent of child care workers.
Educational and Skill Requirements Vary Widely
The care workforce has a wide range of education levels. More than four out of ten care workers (43%) have no more than a high school degree. Preschool teachers are the exception and are more likely to have at least a bachelor’s degree (41%) compared to those in other care occupations. This is consistent with other research documenting California’s ECE workforce (Center for the Study of Child Care Employment 2022). Within the direct care workforce, nurse assistants are more likely to have some college experience but not a degree (38%), while almost half of home health aides and personal care aides have at most a high school diploma.
Overall, the care workforce is made up of economically less-advantaged groups—a fact that has long been emphasized by stakeholders and providers alike. Black and Latino women, people with less educational attainment, and non-citizens all face challenges securing well-paying jobs that can support a family in California. While barriers such as immigration status and discrimination affect the economic mobility of these demographic groups across the labor market (Lin and Weiss 2019), the care sector is exposed to additional barriers to economic advancement. Specifically, the traditional role of women as caregivers presents challenges to increasing the societal and economic value of caregiving services (Folbre 2021; Lin and Weiss 2019).
Several experts we spoke with underscored the importance of broader societal and structural issues when thinking about improving care jobs. Many ongoing policies that aim to advance and expand the care workforce are explicitly focused on improving equity. For example, the process for creating a new provider rate structure for ECE workers included addressing equity issues as a foundational principle. The characteristics of jobs themselves also likely factor into decisions to work and remain in the caregiving sector.
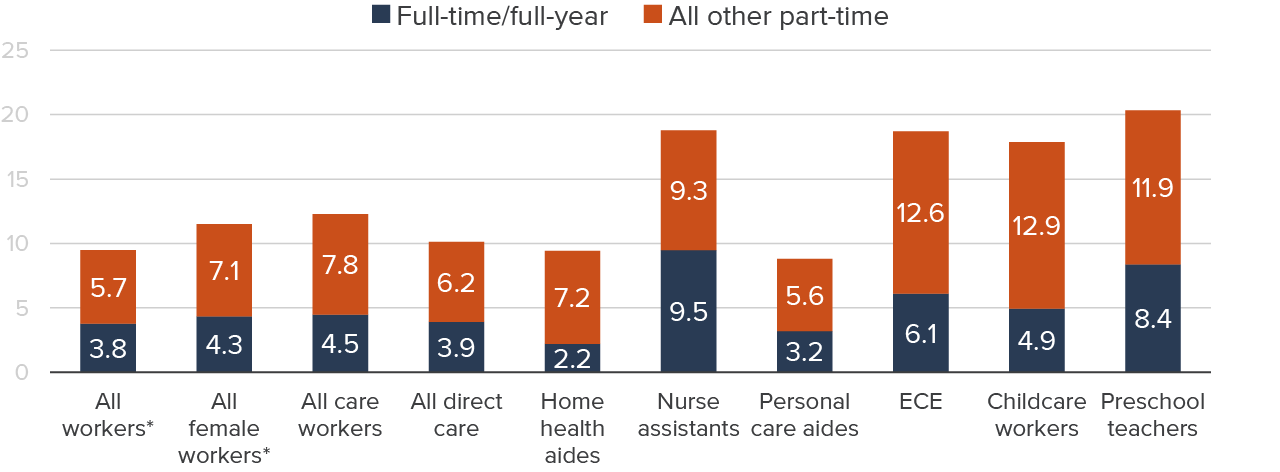
Most Care Workers Are Employed Part Time
Only about half (48%) of California care workers were employed full time (35+ hours) and full year (50+ weeks), compared to 66 percent of workers overall (Figure 4). Some worked full-time hours for part of the year (7%). The remainder worked part time throughout the year (29%) or for part of the year (16%). The prevalence of part-time work impacts the provision of care services in aggregate; all else being equal, the state would need far fewer workers if all of them worked full time. To some extent, the high share of part-time work is an extension of the variability in need for caregiving services, but it also suggests that the way care services are financed could be amenable to change. Combined with high rates of churn and turnover, the prevalence of part-time work makes the recruitment of new workers a constant challenge for the sector.
The degree of part-time work does vary across types of care occupations (see Technical Appendix Table C3). Nursing assistants are most likely to work full time (64%), followed by preschool teachers (53%). Lower shares of home health aides (45%), personal care aides (46%), and child care workers (43%) report working full time.
Higher shares of part-time work for personal care aides may be related to funding from programs like IHSS: on average, people who receive IHSS care services are funded for about 30 hours per week. Additionally, many ECE workers work in school-based settings, providing care only after school and/or only during the school year.
Most care workers do not work full time, though there is variation across occupations
Percent

SOURCE: American Community Survey (ACS) – IPUMS, 2021 and 2022.
NOTES: Includes Californians 18 and older who were employed in the past week. Occupation is based on a person’s primary job where they work the most hours. Full-time, full-year employment is defined as at least 35 hours/week and at least 50 weeks employer per year. * All and female workers exclude care workers.
The preponderance of part-time work in the care sector stands out relative to the workforce overall and to all female workers; about six in ten female workers in California are employed full time, full year compared to only 48 percent of care workers. Part-time work might reflect preferences of the female-dominated care workforce, but it also points to structural issues that underlie lower labor force participation for women, especially those who have children (Lafortune et al. 2024).
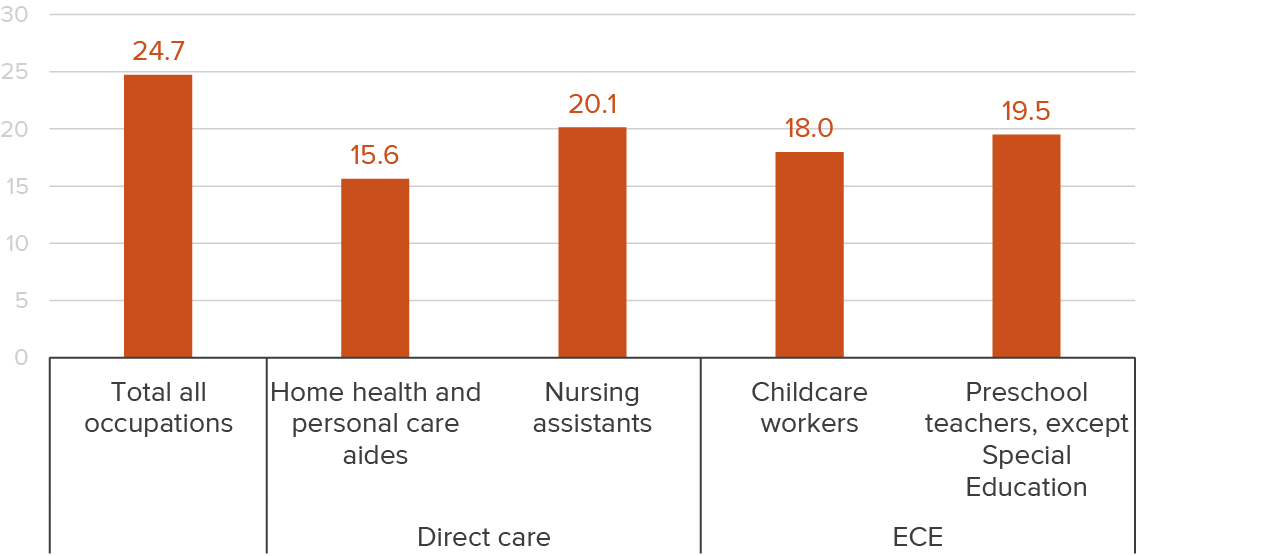
The Current Population Survey provides additional insight on why part-time work is common among care workers. California care workers are more likely to report working part time because of childcare or family obligations (see Technical Appendix Table C7), compared to other part-time workers (30% among care workers vs. 16% of all part-time workers). California care workers are also more likely to report that fewer than 35 hours is considered full time for their job (17%) than are part-time workers overall (13%). Other reasons cited for part-time work were similar across occupations, with one exception: slightly lower shares of care workers reported the reason for part-time work was because they were in school (13%) compared to part-time workers overall (17%).
Part-time nursing assistants and ECE workers are especially likely to report that they are in school. Far fewer personal care and home health aides who work part time indicate that they are currently enrolled (Figure 5).
Many part-time care workers are also enrolled in school
Percent of workers in school
SOURCE: American Community Survey (ACS) – IPUMS, 2021 and 2022.
NOTES: Includes Californians 18 and older who are in the labor force including those who are unemployed. Occupation is based on a person’s primary job where they work the most hours. School enrollment is self-reported and can be in any setting (e.g., community college, for-profit, adult education). * All and female workers exclude care workers.
Many Care Workers Earn Low Wages and Rely on Safety Net Benefits
In the first quarter of 2023, median hourly wages for California care workers were well below the statewide median of nearly $25. Wages ranged from a low of $15.60 per hour for home health and personal care aides to a high of $20.10 for certified nurse assistants. ECE workers fell somewhere in between, with child care workers earning about $18 per hour and preschool teachers $19.50 (Figure 6).
The median hourly wage of the care workforce is lower than that of all workers
Dollars per hour
SOURCE: OEWS Employment and Wage Statistics Data, first quarter 2023.
NOTES: Data is based on a survey of employers. Information on wages is pooled from three years of surveys and then weighted to reflect quarterly employment counts by size, industry, and area. Self-employed and household workers are not included. Nursing assistants include those that work in hospital settings.
With only about half of care workers employed full time throughout the year, low hourly wages translate to even lower annual earnings. In 2022, median annual earnings for care workers were about $22,000, about 50 percent of statewide median earnings ($45,000). High rates of part-time work also contribute to care workers’ access to employment benefits such as health insurance and retirement plans. Only about 45 percent of care workers have employer-based health insurance, compared to about two-thirds of all California workers.
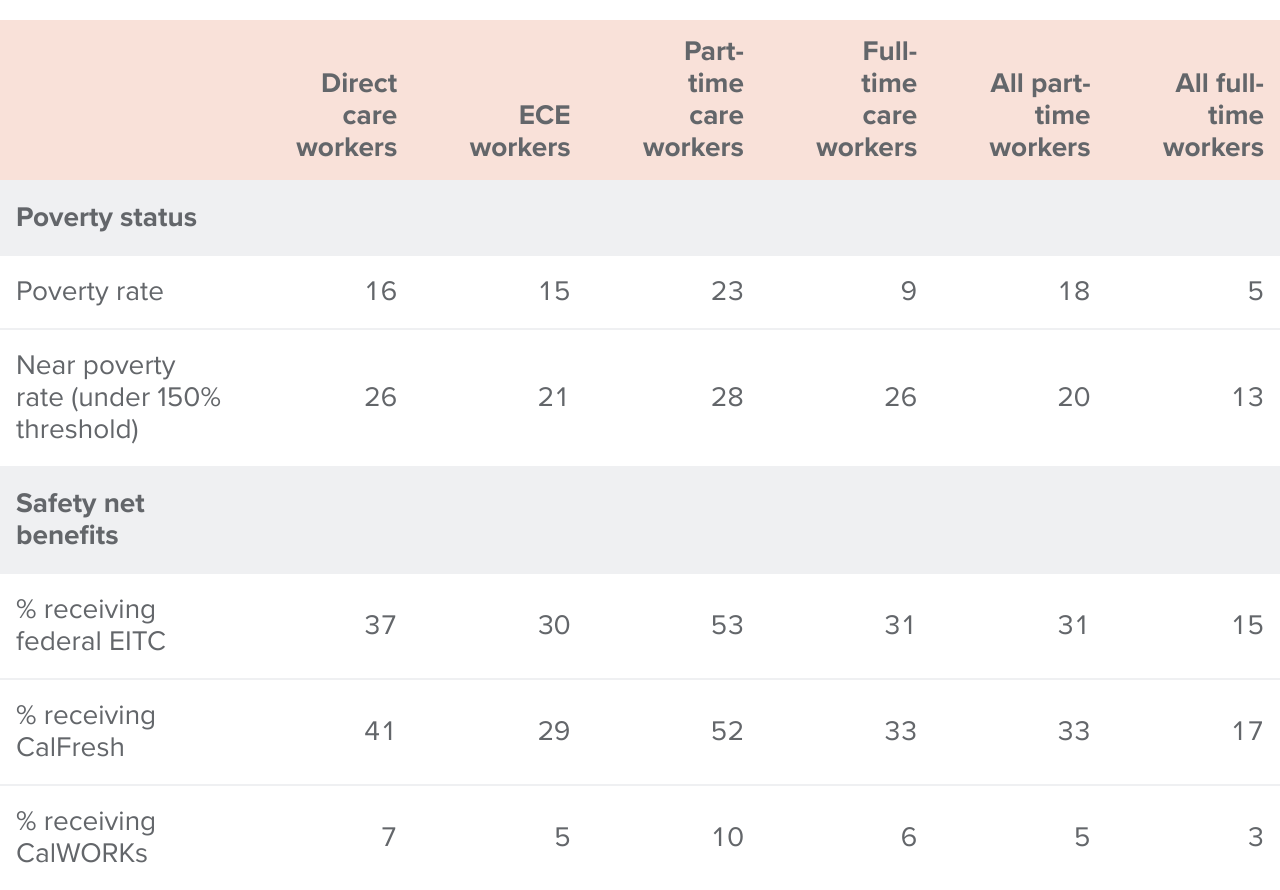
Using the California Poverty Measure, we find that 15 to 16 percent of care workers are poor (Table 1). Part-time work status is a contributing factor: poverty is less common in families of care workers who work full time.
More than one in four direct care workers and their families are “near poor,” which is essentially a proxy for low-income status—these workers have enough resources to meet their basic needs (including housing, food, and work-related expenses including child care), but no more than 150 percent of the poverty threshold (about $60,000 for a family of four). Even when care workers are employed full time, 26 percent are near poor—double the poverty rate among all full-time California workers.
Care workers are more likely to be in poverty and to rely on safety net benefits than other workers
SOURCE: CPM 2023 Q1.
NOTES: Table reports family circumstances of care workers. Full-time refers to 35+ hours a week and 50+ weeks per year. Poverty status and benefit receipt is determined at the family level, as workers are in families that share resources and have joint needs for shelter, food, and the like. This means that care workers could be supporting or could be supported by other workers in the family; all statistics here show average family circumstances across all types of family/worker configurations.
Considering their low earnings levels and relatively low family incomes, it’s not surprising that many care workers access means-tested government benefits. Thirty percent of ECE workers and 40 percent of direct care workers receive food assistance from CalFresh (in amounts of about $4,000 annually, on average), the most commonly used safety net program. Many also claim the Earned Income Tax Credit (30% for ECE and 37% for direct care), which targets low-income workers with children. Combined, these two programs could add $7,000 to $8,000 per year, on average, to the family incomes of care workers who receive benefits. A relatively small share (5% for ECE and 7% for direct care) participate in CalWORKs, the state’s cash assistance program for families with children. The California Poverty Measure accounts for these government benefits, so many who receive them are nonetheless poor or near poor.
Increased hours or wages might reduce the amount of benefits some workers qualify for. The share of care workers receiving EITC or CalFresh benefits jumps to over half among care workers employed part-time. The fear of losing safety net benefits might be one reason for workers to work less than full time. Indeed, our workshops surfaced the prospect that home-care workers might take on additional hours if they were not concerned about losing safety net benefits. Increasing wages through policy, market forces, or negotiation may generate similar concern. Overall, understanding the net impact on caregivers’ economic standing will be critical for expanding the care workforce (Lucia et al. 2023).
Demand for Care Workers Will Surge over Next Decade
Projected shortages for the direct care workforce range from 600,000 to more than 3 million workers (Hunt, Yeh, and Fix 2023). That is a huge range, reflecting uncertainty around how the supply of workers might increase (or not) to meet demand for care services. The extent to which the state’s workforce is able to meet future care needs could affect quality, affordability, and access to care for Californians.
Much of the projected increase in demand will be for direct care workers, driven by a growing population of older adults: the California Department of Finance projects that more than one-quarter of Californians (26%) will be age 60 or older by 2030, and about 2.3 million will be over 80—a 48 percent increase compared to 2020. As people age and live longer, higher shares report difficulties that can impact daily living, including self-care, mobility, and memory-related issues. These older adults will require help to continue living in their homes; many may need to move into assisted living or skilled nursing facilities.
As a result, home health and personal care aide jobs are projected to grow 29 percent by 2030, to nearly 1 million (Figure 7). Unfortunately, available occupation projections do not distinguish between home health and personal care aides even though these distinctions are meaningful from a training perspective. Jobs for certified nursing assistants have lower projected growth (13%) and as we have seen, represent a relatively small share of the direct care workforce.
Growth in direct care occupations does not necessarily mean consistent growth across the settings where those services are needed. Care for older adults and people with disabilities has shifted from nursing homes to home- and community-based settings over the past few decades, largely driven by changes to Medicaid policy and case law, as well as personal preferences. As a result, jobs in home- and community-based settings are expected to grow 27 percent by 2030. Demand for assisted living jobs will grow by 31 percent, from a smaller base.
Increased demand among older Californians for assisted living communities could alter the settings in which older adults receive care services. However, higher costs and minimal government funding support could limit the growth of these jobs. Ongoing policy efforts that expand coverage and payment sources for caregiving services in assisted living facilities and home-based settings could also shift where caregiving services are provided.
While California’s population of young children is growing much more slowly than in previous decades, increased demand for ECE workers comes from additional subsidized child care slots and teachers in transitional kindergarten. For instance, starting in the 2025–26 school year, most four-year-olds will be eligible for transitional kindergarten programs at public elementary schools, a substantial shift in the early care and education landscape (Hill and Prunty 2022). Moreover, experts we spoke with highlighted the current under-provision of child care driven by a lack of affordability, quality, and/or access; addressing these issues would increase demand for child care and necessitate more workers. Finally, the child care sector took a major hit during the pandemic, losing 35 percent of jobs by April 2020 and only recovered to pre-pandemic levels in December 2023.
Some caregiving jobs are expected to grow more quickly than the workforce overall by 2030
Percent

SOURCE: EDD Occupation and Industry long-term projections, 2020–2030.
NOTE: Individual and family services include services for older adults and people with disabilities, a substantial share of employment in that sector.
Key Challenges of Expanding the Care Workforce
To meet demand in the near future, the care workforce would need to grow from about 5 percent of all California jobs to about 6 percent, or 1.2 million jobs, in 2030. However, a number of factors could constrain workforce growth. First, California’s overall workforce is shrinking as a percentage of the population, constraining the pool of available workers (Lafortune et al. 2024). Second, as demonstrated above, low wages and part-time work make it challenging to recruit new workers. While the work can be highly rewarding for caregivers and immensely valued by the people being cared for, that value is not typically reflected in worker earnings. In this section we discuss these and other challenges to expanding the care workforce.
Government is Major Payer for Care Services
A large proportion of care services are paid for by public funds. The federal government is the main source for publicly funded direct care services through the Medicaid and Medicare programs, though state and some local sources also contribute. Medi-Cal, the state’s Medicaid program, is a primary payer for direct care services. Medi-Cal covers residential, long-term care provided in nursing homes (also referred to as skilled nursing facilities or SNFs) as well as home- and community-based services (HCBS) that support personal care for daily living and limited medical care. Major HCBS programs include In-Home Supportive Services (IHSS) and adult day health services. The federal Medicare program provides some funding for direct care but covers only short-term services (less than 21 days)—typically those provided after surgeries such as knee or hip replacements.
The state funds services for Californians with intellectual and developmental disabilities through the Department of Developmental Services. These services are largely provided by regional centers that assess program eligibility and coordinate and pay for caregiving. The state General Fund is the primary source of program funding.
The state and federal government also fund several early care and education programs, including the state preschool program, free and subsidized childcare for a capped number of low- and moderate-income families, transitional kindergarten (TK), and Head Start. Like the Medi-Cal program, many ECE programs (with the notable exception of TK) have income eligibility requirements.
For eligible low-income families, these publicly funded care programs can provide critical access to care services and additional income for families. However, most publicly funded programs have capacity constraints due to funding caps and/or worker shortages. This means that many eligible families do not receive services, and those who do may not get enough hours of coverage and must fill in the gaps themselves or pay out of pocket for private services.
The Legislative Analyst’s Office (LAO) estimated that only about 5 percent of all young children and 13 percent of eligible children were enrolled in subsidized ECE programs in California as of 2018 (LAO 2019). Since then, the state has added about 150,000 slots and currently serves about 713,000 students across all programs (LAO 2023). For direct care, the federal government pays for about 80 percent of services provided in nursing homes and home-based settings through the Medi-Cal or Medicare programs. Assisted living facilities that provide residential care for people with fewer medical needs are typically paid for out of pocket (74%) by consumers and their families (see Technical Appendix Figure A1 for more details). However, Medi-Cal initiatives such as the Assisted Living Waiver program are looking to expand the types of direct care settings that can be funded.
Given the outsized role of government programs in providing care services, policy and budget decisions directly and indirectly affect the size of the care workforce and the employment conditions—like work hours and wages—for many care workers.
Private Care Services Are Quite Expensive
Many families struggle to afford care services; some may qualify for subsidized care but cannot access it due to limited availability, while others are not eligible for publicly funded programs because their incomes are not low enough. Regardless, families must pay for needed caregiving with personal resources and/or adjust the amount of care they receive.
Most private health insurance plans do not cover long-term services and supports provided by direct care workers, and few people have long-term care insurance. And higher-income families with young children who do not qualify for subsidized care face high costs, especially when their children are infants.
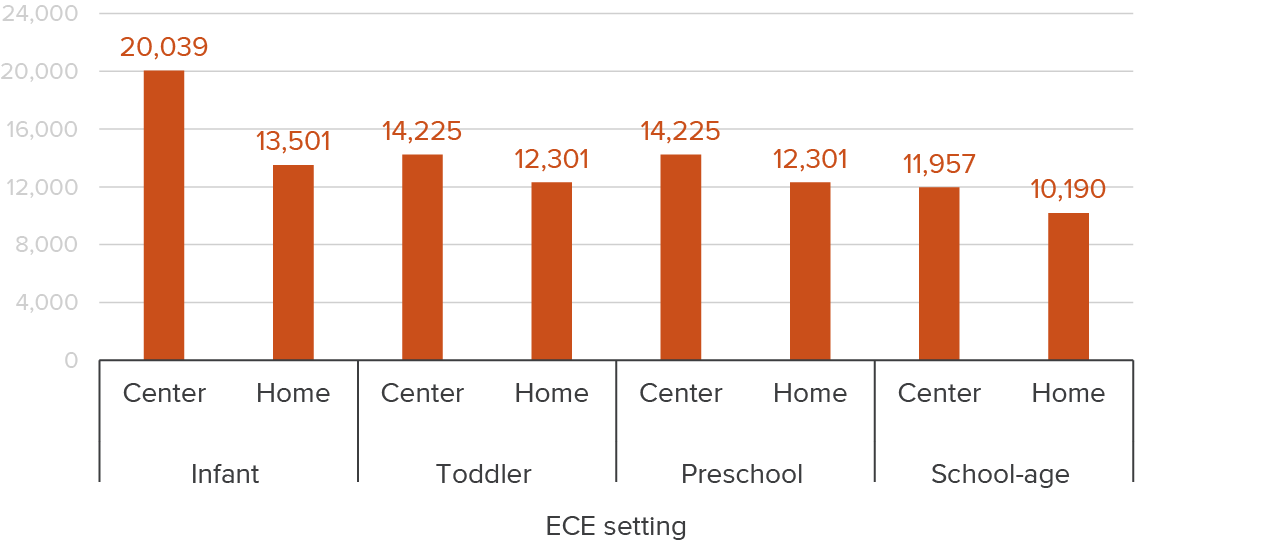
The substantial costs for care services vary considerably by the type of provider, the age and needs of those receiving care, and geographic location. In California, annual child care costs range between $10,000 and $20,000 on average across types of care (2016–2018 state-level estimates adjusted for inflation to 2023 real dollars). Center-based settings are usually more expensive than home-based settings and prices go down as children grow older: the average amount paid for infant center-based care is about $20,000; for toddler and preschool center care, the average amount is about $14,000 (Figure 8).
Child care costs vary considerably by the age of the child and across ECE settings
Annual cost ($)
SOURCE: National Database of Child Care Prices, Women’s Bureau, U.S. Department of Labor.
NOTES: Child care prices are derived from California’s child care Market Rate Survey. Prices are median yearly prices for one child at the market rate. School-age prices reflect the school-year arrangement (part day). Child care prices are based on the 2016–2018 data collection cycle and are presented in 2023 real dollars using the CPI-U for child care (day care and preschool in the US city average).
Direct care is considerably more expensive than ECE services. According to a survey of care costs by a company that offers financial solutions for long-term care, the annual cost of full-time (40 hours per week) in-home care was $76,000 for Californians in 2023. For community assisted living, prices ranged from about $22,000 for adult day health care to $75,000 for assisted living in a facility. Nursing home costs range from about $137,000 to $159,000 for a semi-private and private room, respectively. These costs are higher than the national median of $117,000 for a private nursing home room, $64,000 for a one-bedroom unit in assisted living, and $69,000 for full-time home health aide.
Cost of direct care vary across modalities in California
Annual cost ($)
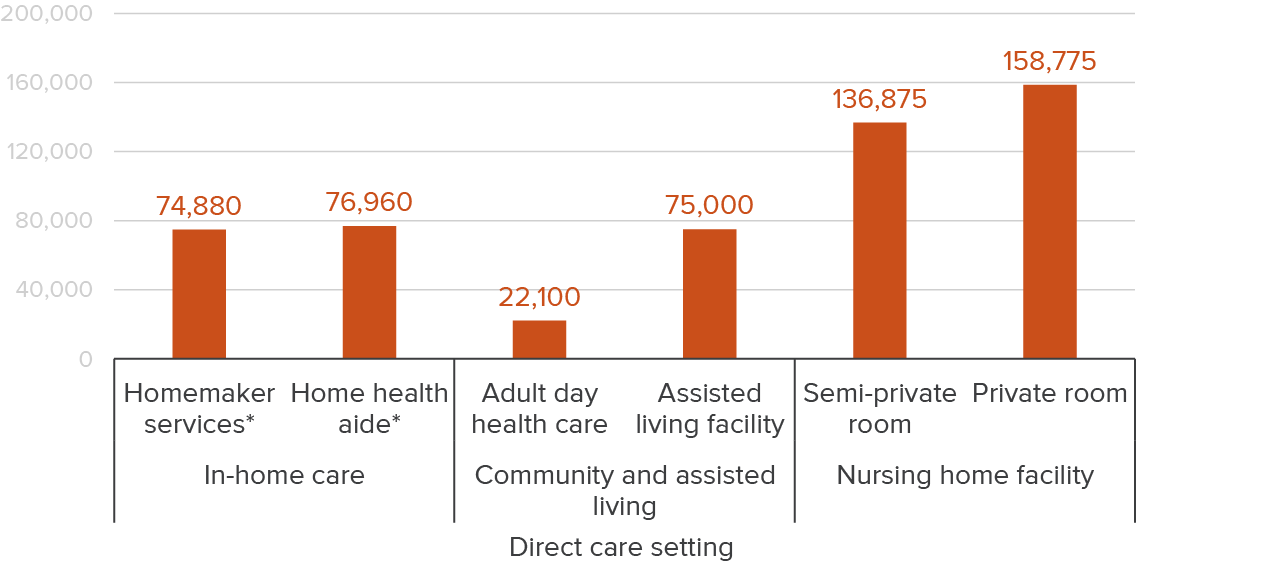
SOURCE: Authors’ calculations based on Genworth – Cost of Care Survey.
NOTE: Cost estimates are for 2023. Costs for homemaker services and home health aides reflect 40 hours per week and 52 weeks per year. Homemaker services are similar to personal care or home care aides who provide non-health related services like cooking and cleaning.
A number of current policy efforts aim to address affordability issues and the high costs of direct care and ECE services. In 2019, California established a Long-Term Care Insurance Taskforce (AB 567) to develop options for funding long-term care services—including in-home care and assisted living—through a payroll tax. The state has increased the number of subsidized slots in early care and education over the past few years, and—as noted above—a major state policy change will shift the care of most four-year-olds to universal transitional kindergarten provided through the public school system, which should reduce child care costs for some families.
These efforts to expand caregiving services to better meet the needs of the population and broaden access must contend with workforce challenges.
Current Efforts to Improve Care Jobs Face Challenges
California has launched a number of policies aimed at increasing wages for California care workers. The governor recently signed SB 525 into law, instituting higher minimum wages for workers in most health care settings. The details of this law’s implementation are still being worked out and could change or be delayed given the large budget deficit facing the state. According to the enacted statute, only some direct care workers would be covered (e.g., those employed by home health agencies or skilled nursing facilities that are part of larger health systems), while many would not, most notably personal care aides including IHSS providers.
Given that government is a major payer in this sector, payment and rate policy reform is a critical lever in increasing caregiver wages. California is in the process of creating a new rate structure for reimbursing ECE providers working in subsidized programs, with the goal of increasing wages and equity among different types of providers.
Several unions in California that represent different components of the care workforce have taken a larger role in advocating for increased wages, as well as improved benefits, work conditions, and job safety. SEIU Local 2015 represents many California long-term care workers, including IHSS providers and nursing assistants in skilled nursing facilities. United Domestic Workers of America (UDW)/American Federation of State, County, and Municipal Employees (AFSCME) Local 3930 represents both home care aides and family child care providers, and the Child Care Providers Union (CCPU) represents some ECE workers who provide home-based care. In 2023, CCPU successfully bargained with the state to secure a 20 percent pay increase for about 40,000 licensed family care and license-exempt family, friend, and neighbor providers, though the increase is only funded for two years. A bill being considered in the current legislative session (AB 1672) would similarly allow IHSS workers to bargain collectively with the state on wages as opposed to the current county-based structure.
These efforts could increase pay and conditions for care workers. How this affects recruitment of future workers is an open question, given that wages have increased notably in recent years in other low-wage sectors (Bohn et al. 2024) and that competition for workers could intensify in light of the state’s shrinking workforce (Lafortune et al. 2024). Higher wages may be a challenge for providers and caregiving businesses, whose clients struggle with affordability—unless reimbursement through major government programs also adjusts. Moreover, as noted above, the large share of care workers who receive government benefits might reduce their hours out of concern that increases in earnings might reduce benefits or make them ineligible. This could mute the impact of wage increases. Determining the optimal way in which wages and eligibility for safety net programs interact is an area ripe for discussion.
High Turnover Adds to Workforce Challenges
Past national research has found care workers have relatively high turnover and short job tenures (Baughman et al. 2020; Baughman and Smith 2011; Caven et al. 2021), which makes it challenging to maintain the workforce at its present scale, much less expand to meet future demand.
To better understand this turnover, we use national longitudinal data from 2013 to 2016 that allows us to follow workers over a four-year period, tracking transitions and demographics. We look at how care workers move in and out of the sector and across different employers. Specifically, we identify a worker’s primary job (in which they worked the most hours during the first two quarters of the study period) and then see where this worker is after five quarters and then after four years. We examine whether an individual has the same employer, has the same occupation but is working for a different employer, has shifted to a different occupation, or is no longer employed and not looking for work.
Figure 10 shows that most workers do not change jobs often. About two-thirds (68%) had the same job after five quarters. For care workers, however, job persistence is much lower; 60 percent were in the same job after five quarters.
About 12 percent of care workers leave the workforce within a given six-quarter period, compared to 8 percent of workers overall. The remaining 27 percent change to a different job. The most common transition is to an entirely different occupation (18%), similar to transitions among all workers. Meanwhile, 9 percent moved to a different employer but work in the same care occupation.
These trajectories for care workers over a relatively short window of time suggest a higher level of churn compared to other sectors of the economy.
Care workers are less likely to be with the same employer over an 18-month period
Percent
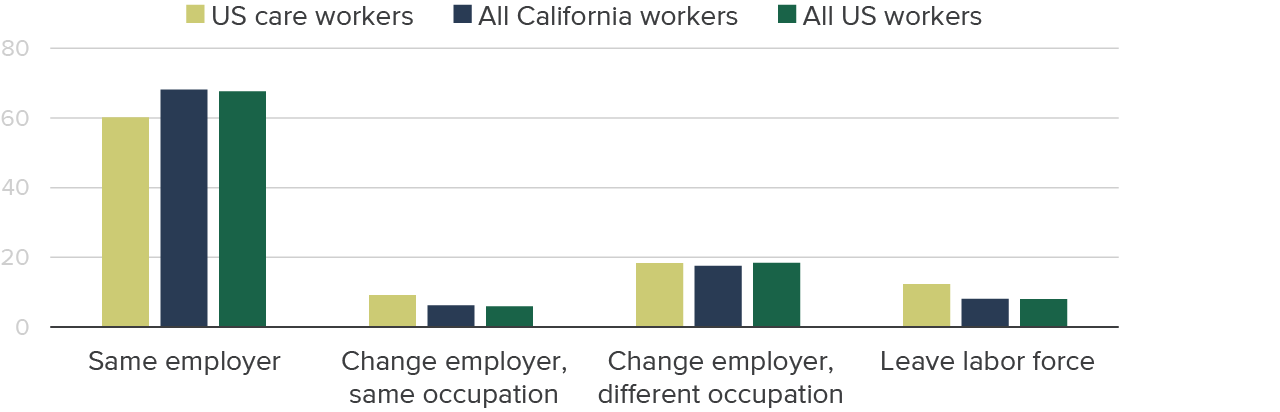
SOURCE: Survey of Income and Program Participation (SIPP) 2014 panel, wave 1 and wave 2.
NOTES: Includes people ages 18 and older who had at least one month of paid employment the first two quarters of 2013 (wave 1). Job transitions are based on changes from a primary job in the first two quarters of 2013 to job status in the fourth quarter of 2014. Primary job is defined as the employer for whom the person worked the most total hours during the first two quarters. Differences for care workers are statistically significant at the 5 percent level for same job and leave labor force categories.
We find similar patterns over a four-year period with an increase in the absolute amount of churn, as you would expect with the accumulation of time (Figure 11). Only 40 percent of care workers have the same job, a smaller share than for workers overall. As with the short-term job changes, most who do change employers move to a different occupation (30%). But a sizeable and significantly larger share of care workers compared to all workers leave the workforce entirely (18%).
Care workers are more likely than other workers to change employers or leave the labor force within four years
Percent
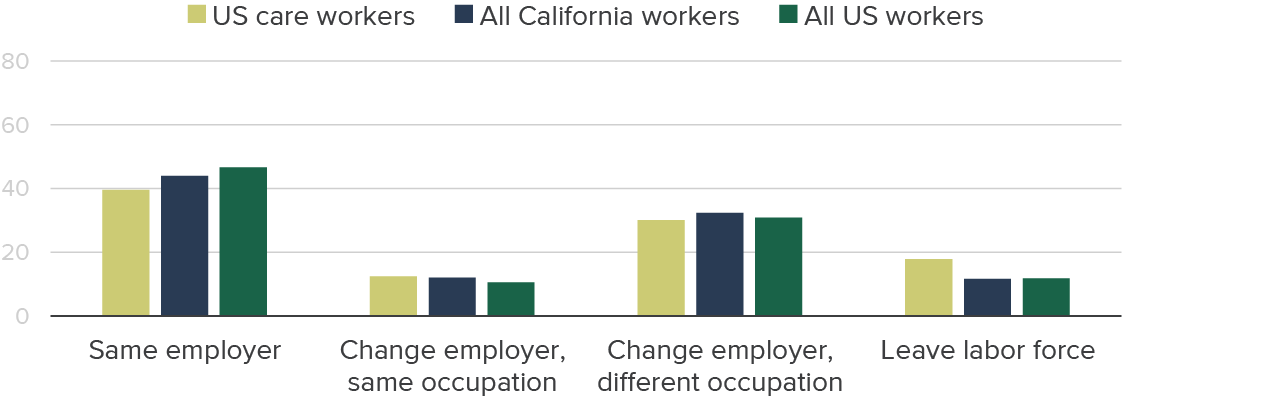
SOURCE: SIPP 2014 panel, wave 1 and wave 4.
NOTES: Includes people ages 18 and older who had at least one month of paid employment the first two quarters of 2013 (wave 1). Job transitions are based on changes from a primary job in the first two quarters of 2013 to job status in the fourth quarter of 2016. Primary job is defined as the employer for whom the person worked the most total hours during the first two quarters. Differences for care workers are statistically significant at the 5 percent level for same job and leave labor force categories but only compared to All workers (not CA workers).
Some differences in labor market trajectories could be driven by demographic and other characteristics. As we saw in the previous section, most care workers are women, many are older and have relatively low education levels, and also work part time—all of which could factor in to job transitions. To examine the role various worker characteristics may play, we conducted statistical analyses that account for individual worker demographics (sex, age, race/ethnicity, and nativity), education levels, and part-time working status (see Technical Appendix Tables B2–B5 for detailed results).
Our analysis indicates that higher rates of changing employers and leaving the labor force are driven by high rates of part-time work among care workers—and to a lesser extent the demographic characteristics of the care workforce. More frequent job transitions would be expected for part-time workers; for a variety of reasons, these workers are less connected to the labor force and job transitions to other occupations may signal upward mobility, especially for those working part time while in school. However, this higher rate of transitions presents a challenge to meeting care workforce needs. In a sector that is not growing, workers transitioning out need to be replaced to meet demand; but in growing sectors like care, finding workers to backfill existing demand and meet growing needs multiplies the challenge.
Training Pathways in the Care Workforce
In recognition of the urgent need to encourage more Californians to enter and remain in the care sector, both the state’s master plans for aging and early learning and care contain major workforce training components. To support these plans, the state has made several recent investments in training programs for care workers. For example, the 2021–22 state budget targeted nearly $1 billion for the training of direct care workers across multiple state agencies; most of these funds were one-time investments rather than ongoing support (Hunt, Yeh, and Fix 2023). Likewise, several recent state budgets have earmarked funding for the ECE workforce pipeline to prepare more workers to support expanded subsidized child care slots and the roll-out of universal transitional kindergarten.
Community Colleges Offer Care Worker Training
Nearly all community colleges offer courses and credentials that prepare students for jobs in direct care and early care and education. In the 2022–23 school year, more than 1,400 full-time equivalent (FTE) students were enrolled in direct care courses—primarily in certified nurse assistant (CNA) programs—and more than 19,000 FTE students were enrolled in early care and education courses at California community colleges (see Technical Appendix Table C8). The number of community college students taking care-related courses is actually higher, since many attend part time.
We see higher shares of Latino students enrolled in care courses (63% CNA and 58% ECE) relative to their share of total community college enrollment (46%). We also see higher shares of FTE enrollment in care programs among older students, especially in early care and education.
In past work on California community colleges, we estimated wage returns across several career education programs. Figure 12 shows our estimates of the share of people earning “middle income” wages after completing different types of career education programs. The figure includes students who earn any type of credit award at a community college, including certificates and associate degrees. We tracked students five years before and six years after they completed a credential; our models account for age, education, race/ethnicity, work experience, and other characteristics.
More students completing health programs earn middle-income wages compared to early childhood programs
Students earning middle-income level or above (%)

SOURCE: Authors’ calculations from California Community College Chancellor’s Office, MIS data and EDD quarterly wage data.
NOTES: Wages are adjusted to 2017 dollars using CPI-U and do not include income generated from self-employment. Middle-income wages are based on the California Poverty Measure (CPM), which is a supplemental poverty measure that accounts for regional differences in housing costs and safety net benefits, among other things. We define middle income as at least two times the CPM poverty threshold. This panel is unbalanced, meaning quarters where students did not work are not recorded as zero but instead counted as missing. FACS refers to Family and Consumer Services programs at the community colleges, of which about 75 percent are in early childhood education.
One of the key findings from our past research on career education (Bohn, McConville, and Gibson 2016a; Bohn, Jackson, and McConville 2018) is that the economic advancement possible from completion of community college degrees and certificates varies considerably depending on the type of program and the intensity of the training (ranging from short-term, low-unit certificates to associate degrees). Completing early care and education programs at community colleges with either a certificate or an associate degree provides a relatively small bump up in earnings level: before earning the credential 30 percent earned middle-income levels, and by 6 years after earning the credential that share shifts to just 50 percent An important caveat to these early care and education results is that they do not include self-employed workers, who dominate the family care provider space.
The story for health programs is quite different: most graduates (80%) earn middle-income earnings within a year after completing their health programs. However, these large gains are driven primarily by associate degrees in nursing and, to a lesser extent, certificates for licensed vocational nursing. Students who complete only a CNA program do not see any significant earnings gains relative to what they would otherwise have earned.
Other Providers Offer Training for Care Workers
Community colleges are not the only providers of training for care jobs. Adult education and regional occupation training programs, workforce development agencies, and other nonprofit and for-profit organizations also offer care worker training.
Private for-profit colleges also provide training, though at a much higher cost than the programs offered by community colleges. Nonetheless, private for-profits awarded slightly more CNA and many more HHA awards in 2022 relative to the community colleges (see Technical Appendix Tables C9–C10).
Community colleges seem to be the primary postsecondary training provider for ECE workers; for-profit colleges do not seem to be engaged in ECE training in two-year colleges. Several local and state agencies—including First 5 California, the California Department of Education, county Resource and Referral (R&R) agencies, California Preschool Instructional Network (CPIN), and WestEd Program for Infant Toddler Care (PITC)—fund and/or offer ECE training.
The California Department of Social Services has a career pathway program for IHSS workers that offers different courses and trainings aimed at improving basic skills and more specialized caregiving skills. The California Department of Aging recently implemented a similar program, CalGROWs, that provides training options for non-IHSS personal care aides and other support positions (e.g., care coordinators and community health workers) that provide direct care services. Both programs offer paid time off and stipends for completion and also provide incentive payments for remaining in the job for a set period of time. Several nonprofit organizations throughout California—including Opportunity Junction, Homebridge, and the Center for Caregiving Advancement—partner with the state to offer many of these training programs. Both programs are also funded by federal pandemic relief funds and slated to wind down over the next year. It will be important to learn from these efforts to inform policies aimed at retaining direct care workers.
Some Career Pathways Offer Economic Mobility, but Often Take Workers out of Care Sector
Training plays an important role in building skills among those entering caregiving occupations—it can help protect workers’ health and well-being and improve the quality or efficiency of services provided. Given the limited range of earnings in the sector overall, additional training for advancement on a career ladder may be necessary for larger jumps in earnings potential.
As mentioned above, some care occupations offer opportunities for workers to climb a career ladder by building their skills over time. Though a single credential may not offer substantial earnings returns in some care fields, building credentials and skills on a career pathway may broaden opportunity over the longer run.
For instance, CNAs who stack higher-level nursing certifications see sizable earnings gains (up to 50% higher earnings than peers who do not stack) and considerable economic mobility. However, only about 20 percent of students who finish CNA programs at the community colleges go on to successfully stack higher-level health credentials (Bohn, McConville, and Gibson 2016b). Making sure that students who want to earn higher-level nursing credentials are able to finish those pathways in a timely manner should improve economic mobility for at least some direct care workers. It is also important to ensure that people know about available programs and understand what they can offer in terms of increased earnings. Black and Latino students who complete short-term health credentials such as CNAs are less likely than their white and Asian peers to return to pursue additional courses and degrees. More effort may be needed to make sure students who want to advance are able to do so.
In the care sector, higher-paying jobs often require additional training and education as well as changes in employers or settings. For example, preschool teachers can transition to other settings like elementary schools or Head Start programs that tend to pay higher wages but also require college degrees to be qualified. Similarly, CNA jobs (and to a lesser extent HHA jobs) can serve as a training ground for people aspiring to become licensed vocational nurses or registered nurses. However, career pathways are not always well-defined or designed to be completed quickly and many care workers face significant barriers—including low education levels, family responsibilities, and/or immigration issues—to moving up to these higher-level, higher-paying jobs.
There are efforts in both the ECE and health workforce spaces to develop pipeline programs including earn-and-learn models. For example, the Early Care and Education Pathways to Success program offers apprenticeships where ECE workers can earn college credits (at no cost) that correspond to state education requirements for higher-wage positions in the sector. The program offers on-the-job training, coaching and mentoring, academic supports, and perhaps most importantly, pathways to increased compensation. Many health workforce pipeline programs focus on engaging people in pursuit of health care jobs that require graduate-level education and clinical training (e.g., physicians, social workers, nurse practitioners).
Changing jobs is one way workers advance, and we observe measurable earnings gains among care workers who change employers. Figure 13 shows the average monthly earnings in the first two quarters of 2013 compared to average monthly earnings in the last quarter of 2014 across the employment trajectories discussed in the previous section. Care workers who change employers but continue doing the same type of care job see about double the gains of those who stay in the same job (31% earnings gains compared to 17%).
Care workers who switch to occupations outside the sector see their earnings increase a bit more (40%). Indeed, low-wage workers across the economy are most likely to improve their economic circumstances by changing employers and often times moving to a new industry and occupation (Escobari et al. 2021; Duffy, Baughman, and Smith 2021).
Care workers who change employers and occupations see larger wage growth
Average monthly earnings ($)

SOURCE: SIPP 2014 panel, wave 1 and wave 2.
NOTES: Includes people ages 18 and older who had at least one month of paid employment in 2013 (wave 1). Job transitions are based on changes from a person’s primary job in the first two quarters of 2013 to their job status in the fourth quarter of 2014. Primary job is defined as the job in which the person worked the most total hours during the period. Monthly earnings are summed across all jobs, though more than 90 percent of workers only have one job in any given month.
Some direct care workers—especially personal care aides, many of whom are family members in the IHSS program—may desire additional training but do not seek to advance to higher-level nursing positions. That is, they seek to improve the care they provide and/or maintain their own health while providing care but do not want to move from direct care jobs to other health care positions. We find much lower shares of personal care and home health aides reporting they are in school and several of the experts we spoke with underscored the need for wage growth that does not rely on changing occupations or obtaining additional credentials. These caregivers are an essential segment of the workforce. Policies that aim to grow the workforce by providing training for career pathways will thus need to look to other segments of workers. Likewise, ECE workers who are family care providers may not have the time or desire to enroll in school but have many years of experience providing care to children. Finding ways to value that experience in terms of quality standards often measured in educational terms (units or credentials) could provide more opportunities for advancement and mobility.
Technology and Teams Could Help Increase Care Worker Productivity
Technological tools or automation could increase care workers’ productivity and hence potential for earnings; leveraging care workers as part of health care teams could also increase their productivity. In both cases, training would be essential.
In general, the ability to “produce” additional output in the same amount of time creates the opportunity for higher pay for a given worker. For care workers, this productivity-pay relationship is constrained because their “output” is typically highly personalized, time-intensive, and “high touch.” However, care workers could increase productivity if, for example, they are better able to meet the specific needs of the person being cared for and, at the same time, meet the needs of additional people within a given timeframe.
Across the labor market, workers often obtain job-specific training and adopt technological tools that complement and enhance their existing skills (Rodrik 2022). This kind of training might help care workers become more productive and move up the career ladder; as we have seen, this might involve switching to new work settings.
Two additional areas may have the potential to increase productivity among direct care workers. First, direct care workers could be integrated more fully into health care teams, providing greater assistance to the person being cared for and improving their quality of care. For example, the role of non-licensed personal care aides and certified personnel, such as HHAs, could be expanded. These workers could also help manage chronic conditions that are common to aging and disabled individuals. This sort of change would require shifts in organizational cultures. It would also require regulatory changes in nursing scope of practice laws that dictate which workers are qualified to provide certain care services and how much training they need to have (Osterman 2019; Spetz 2019). There is evidence that delegating more responsibilities to direct care workers, with adequate training and coordination across care teams, results in better patient care (Osterman 2017; Zimmerman et al. 2016).
Second, technology and automation have the potential to support direct workers and enhance the care they provide. For example, in Japan, where an aging population and workforce have already brought adequacy of direct care to the forefront, technological tools help care workers schedule visits efficiently and respond to patient needs. Additionally, technology that helps monitor and support patients, including motion-sensing tools and robots, are being deployed, though it is unclear to what extent technology solutions reduce the need for caregivers (Wright 2023). Given scope-of-practice laws and concerns about quality and safety, there are important policy considerations in the use of automation and technology in long-term care.
The role of technology in increasing productivity in the ECE space is less clear. Working with children, especially young children, often requires the ability to respond to unanticipated situations and nonverbal communication. However, some ECE researchers and practitioners have highlighted the potential of AI to support educators in developing progress reports and other assessments, freeing up time to provide specialized services. It is important to consider the privacy implications of such monitoring for both children and care workers.
Moreover, no amount of technological advancement can replace human observation and interaction—including empathy, compassion, and warmth. Emotional support, understanding, and encouragement is an essential part of a caregiver’s job that cannot be outsourced or automated.
Looking Forward
California requires a care workforce that can meet the needs of its young, older, and disabled residents. Major policy efforts are under way to address present and future challenges: state master plans on the aging population and early learning and care have identified the need for major workforce investments to expand the care workforce and improve outcomes for workers.
California’s care workforce is predominantly female, disproportionately Black and Latino, and rapidly aging. Low levels of educational attainment and/or immigration status close off some career pathways to many care workers. These factors interact with the reality that many care workers are women of color, who face other barriers to advancement, including a lack of financial resources and discrimination. In general, the high cost of private care services and the large governmental role in covering the costs of caregiving make it challenging to increase pay in order to both draw in new workers and improve jobs for existing workers.
While this might seem dismal, action in several major areas could improve prospects for care workers and help California meet its need for caregiving services. Investments in training programs, targeted workforce development services, and well-defined career pathways could help some care workers achieve more economic security and remain in caregiving jobs. At the same time, efforts to increase wage levels for care workers, along with strategies to help families pay for needed care services are also being advanced.
Investing in well-defined career pathways. Advancing to higher-level positions in the health and education sector offers care workers opportunity for economic mobility. More supports may be needed to help students who want to advance be able to do so—and making sure that care workers pursuing pathways to nursing and teaching are able to complete programs in a timely manner is critical. Given the demographics of the students currently enrolled in community college nursing and ECE courses, this could also bolster longstanding efforts to bring more Latinos into higher-level positions.
Additionally, many short-term training courses available to care workers are not tied to long-term wage growth because employers—especially those funded by government programs—do not have a mechanism for doing so. While some programs offer paid time off and cash stipends to encourage training, completion of courses is not tied directly to earnings advancement. This does not have to be the case: establishing universal core competencies that could be achieved either through completing trainings or validated job experience could be tied to a clear wage progression. Apprenticeship models in ECE and recent career pathway programs in direct care could offer insights.
Improving economic security for care workers. Economic advancement through existing career pathways is likely to work for a relatively small segment of current care workers. The number of care workers who report being in school suggests that fewer than one in eight are pursuing advancement. Moreover, the workforce needs for entry-level care occupations are substantial; the largest growth in caregiving occupations is projected to be in the personal care aide category. Therefore, improving the economic security of these workers—rather than relying on advancement—must remain part of the conversation. Policymakers are working to reform payment rates for care providers and to consider higher minimum wage levels to support some care workers. But these efforts come at a potentially high cost for the state and federal government and will be weighed against other budget demands. While costly, expanding options for publicly funded care services would benefit both Californians who struggle to afford quality services and—if payment reform and worker wages are part of the conversation—the workers who provide services. Finally, targeted business supports that help self-employed care workers manage operating requirements, access capital, and form co-ops are also strategies that could help caregiving jobs provide more economic stability.
Better integrating direct care and ECE workers into health and education sectors. Both direct care and ECE are on a continuum of health care and educational services. Experts in both direct care and ECE stress the importance of better integrating care services—particularly in home-based settings—into these broader sectors. One strategy under discussion is to develop a “universal home care” aide position that would streamline job qualifications and scope of practice, allowing direct care workers to become more integral and well-paid members of health care teams.
Going forward, it will be important to monitor progress on master plan workforce initiatives and additional investments in training for care workers. It will also be critical to create more robust ways to integrate available administrative and licensing data to evaluate how policies and increased funding are impacting the number of people working in the care sector—and to monitor the impact on workers’ economic well-being. Though the pandemic deeply impacted the care workforce, it also raised the profile of how important caregiving is not just to the people who need services and their families, but to the broader economy. While major federal reforms have stalled, California will need to do more to create and sustain a robust care workforce.
Topics
Economic Mobility Economy Jobs and Employment Workforce and TrainingLearn More

Training for Health Care Jobs in California

California’s Changing Child Care Landscape

California’s Aging Population

California’s Current Child Care Landscape

Video: California’s Care Workforce

Shifting Gender Employment Patterns and California’s Care Sector
