

Table of Contents
- Key Takeaways
- Introduction
- Statewide Labor Force Trends
- Understanding Gaps and Barriers across Prime-Age Demographic Groups
- Disability and Labor Force Participation
- Policy Approaches to Boosting Participation
- Conclusion and Policy Considerations
- Notes and References
- Authors and Acknowledgments
- PPIC Board of Directors
- Copyright
Key Takeaways
Labor force participation is a fundamental factor in economic well-being for individuals, families, and the state. Yet despite a robust employment recovery from the pandemic, it lags pre-pandemic levels. California’s aging population portends a shrinking workforce over the coming decades, a continuation of trends that predate the pandemic. Moreover, longstanding gaps in participation across demographic groups pose significant challenges.
To motivate policy solutions to address these dual challenges, we present detailed information on labor force participation in California, documenting long-term trends and detailing gaps by race, gender, and other demographics. Several key findings and policy considerations emerge:
- An aging population is the reason for California’s long-term labor force declines. Labor force participation has fallen from over 67 percent in 2000, to near 62 percent today. Among adults aged 25–54 (“prime” working years) it has hovered around 80 percent in recent decades. The decline is entirely due to an aging population, rather than fluctuations around periods of recession and recovery. →
- Significant gaps still exist by race, gender, and nativity. Among prime-age workers, women are 13 percentage points less likely to work than men. By race/ethnicity and gender, Black men (83%) and Latina women (74%) have the lowest rates. Foreign-born noncitizen adults have slightly lower participation than native-born and naturalized citizens. →
- Educational differences largely drive racial gaps. For prime-age college graduates, participation is near 90 percent, with only small differences between Asian, Black, Latino, and white adults. However, for those lacking a high school diploma, rates are much lower, ranging from 74 percent (Latino) to 48 percent (Black). Fully eliminating educational attainment gaps could close most racial gaps in participation. →
- Gender gaps are largest for women with young children and a partner. For prime-age single adults with no children, participation gaps between men and women are small—especially among those with at least some college education. The large gender gaps in participation are driven mostly by motherhood. →
- People with disabilities experienced a 14 percent participation increase post-pandemic. Labor force participation is significantly lower among prime-age (6%) and 55 and older (25%) adults who have a disability, especially for those with less education. Prime-age participation has increased substantially post-pandemic, though the prevalence of disability has also increased. →
In the face of an aging workforce, policymakers have the opportunity not only to offset aggregate declines, but also to reduce labor market inequalities across demographic groups. Efforts to increase participation among the aging population could have a sizeable impact on aggregate. But policymakers can also make gains by addressing multifaceted barriers among the largest low-participation demographic groups—such as less-educated, married Latina women and less-educated, single Black men. The end result could not only be a solution to California’s current and ongoing challenge in the aggregate, but more equitable workforce opportunities for those who need it most.
Introduction
According to many economic indicators, by 2023 California’s economy had recovered from the swift and deep recession that accompanied the COVID-19 pandemic. Employment levels recovered in nearly all regions of the state (Bohn et al. 2023), while low unemployment and high job vacancies reflected a tight labor market and decreasing employer market power (Autor, Dube, and McGrew 2023). Despite high inflation and corresponding Federal Reserve interest rate hikes, employment growth and high levels of job openings persisted in California throughout 2023 (Duan and Bohn 2023).
Nevertheless, over the longer term, California’s economy—along with that of most other states—faces significant labor market headwinds. Labor force participation—which includes both employed workers and those who are unemployed but looking for work—remains below pre-pandemic levels both statewide and across many of California’s diverse regions and populations. This trend predates the pandemic: since a high of 68 percent in 1990, labor force participation is now below 63 percent. While some fluctuations reflect the dynamics of recessions and macroeconomic forces, demographic changes and an aging population underlie much of the long-term decline, echoing the broader national trend (Abraham and Kearny 2020). The Congressional Budget Office projects a national decline of roughly 1 percentage point over the next decade (Congressional Budget Office 2023).
If these projections play out, an aging population and declining labor force participation will pose new economic challenges for California. Workforce size and skills and population age structure are both critical to state-level spending policies—from education to infrastructure to safety net to health. Additionally, given trends in demographics and the labor force, California is increasingly recognizing the challenge of supplying an adequate workforce to meet care services for young and old (California Department of Aging 2021; California Health and Human Services Agency 2020).
Complicating this picture, gaps in labor force participation may reflect barriers to participation and/or poor opportunities. In turn, these affect household well-being and contribute to broader labor market inequities. There are substantial differences in participation by age, gender, family structure, race/ethnicity, region, and nativity. The forces driving these gaps are numerous.
From a statewide perspective, declines in aggregate supply and the continuing aging of the population pose challenges to policymakers. In the short run—especially in critical sectors projected to grow, like health care, dependent care, climate, and infrastructure—growing workforce needs may be constrained by labor supply. In the longer run, declining participation, changing workforce needs, and an aging population may fundamentally shift the economy and require adjustments to current health, safety net, and education policies.
From an individual perspective, labor force participation decisions reflect myriad economic, social, and cultural factors and constraints. Not all Californians want to work. But policies to eliminate barriers to work can increase participation and improve household well-being. Barriers that impede access include, for example, affordable childcare, discrimination by age, gender, and/or race, lack of well-paying work, past criminal justice history, poor health and disability, and mismatch between the potential worker’s skills and education levels and those demanded in the labor market.
The existence of these barriers—by education, gender, household structure, nativity, etc.—constitute ripe opportunities for policymakers to address ongoing aggregate labor supply issues by focusing on barriers to individual participation. Indeed, the impact of addressing these gaps may be large, could significantly offset the declines seen in recent decades, and could boost statewide economic output considerably. For example, recent Federal Reserve estimates suggest that that closing racial and gender gaps in employment from 2005–2019 would have added $72 billion to California’s GDP annually (Federal Reserve Community Development Staff 2021).
In this report, we examine trends and gaps in labor force participation in California. We first document long-term trends and recent changes since the COVID-19 pandemic. We follow with key facts on differences in participation rates across different socio-demographic groups. We then identify low-participation groups and consider possible scenarios to inform where policy action may have the greatest leverage.
Statewide Labor Force Trends
After decades of growth, labor force participation in California peaked in 1989, at roughly 68 percent. Participation declined in the early 1990s recession, rebounded slightly to nearly its 1989 high by 2001, and has declined in most years since (Figure 1). Today, labor force participation is below 62 percent, slightly below pre-pandemic levels and below the rest of the nation. This is not unique to California, but closely matches the national trend since the late 1990s.
Labor force participation has declined in both California and the rest of the US
Percent in labor force

SOURCES: Current Population Survey; Authors’ calculations.
NOTES: Annual averages reported. Data for 2023 include monthly data through November 2023.
California’s Long-term Trend Reflects an Aging Population
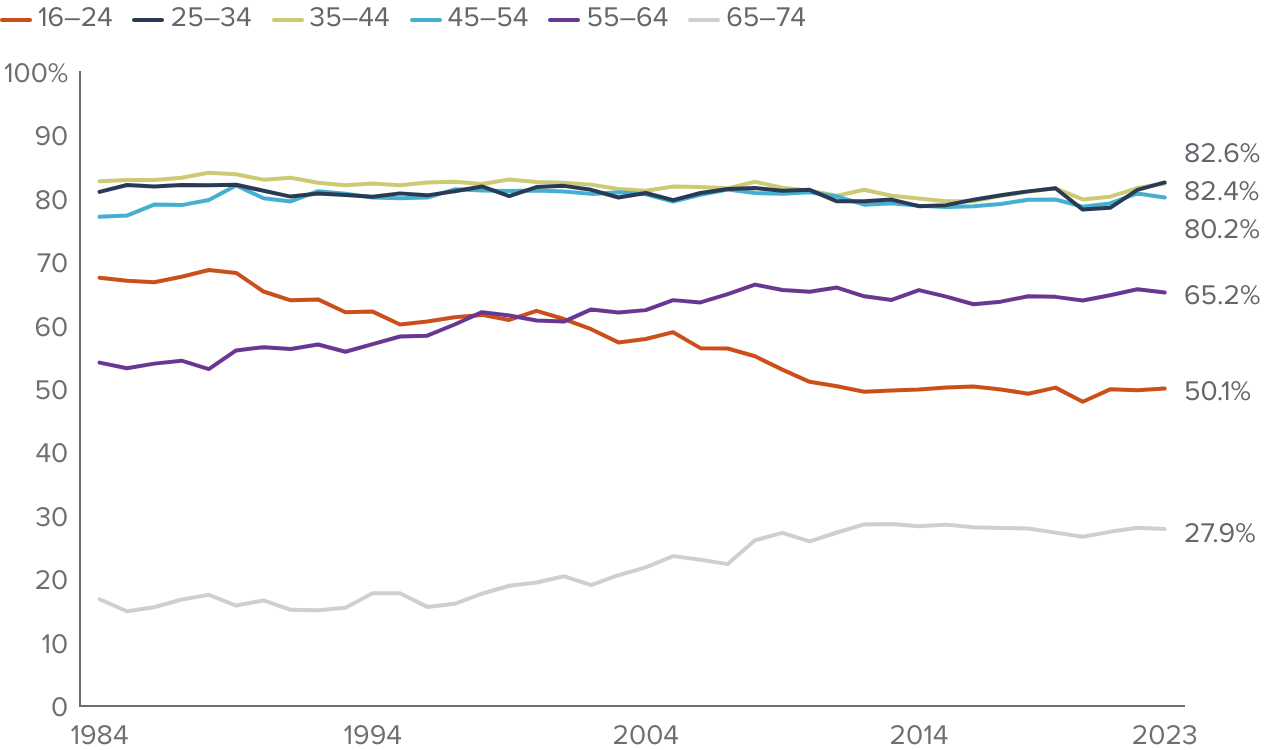
Why is California’s labor force participation declining overall? It is not due to changes among prime-age adults (25–54). Their participation has remained relatively steady in recent decades, hovering near 80 percent in most years (Figure 2). The key demographic factor is an aging population and increasing share of adults near or above typical retirement ages. Older adults have much lower participation rates: roughly 65 percent of those aged 55–64, and only about 30 percent of those 65–74. Moreover, California’s population is projected to age further in the coming decades, putting downward pressure on labor force participation (California Department of Finance 2023).
While the trend has been flat among prime-age adults, we see more significant changes over time for both younger and older adults. Even though their overall participation is low, adults 55–64 and 65–74 have seen significant increases in labor force participation since the 1980s. By 2023 both are roughly 10 percentage points higher than their 1984 levels. For all those 55 and older, it has remained at similar levels since 2006 (Technical Appendix Figure B3). Within this age range, for those aged 55–64, much of the increase occurred in the 1990s; for those 65–74, it started in the late 1990s and reached its peak after the Great Recession. In the last two decades, the overall increase has primarily been among those without a college degree (Technical Appendix Figure B6).
For prime-age workers, labor force participation has changed little since the 1980s
Percent in labor force
SOURCES: Current Population Survey; Authors’ calculations.
NOTES: Left axis shows share in labor force by year. Annual averages computed over all months in year, except for 2023 (through November). Excludes adults 75 or older.
The opposite trend has occurred with young adults 16–24—participation has declined from nearly 70 percent in the 1980s to roughly 50 percent today. This trend has been consistent since the late 1980s and reflects the rise in young adults choosing schooling over joining the workforce. College attendance rates have increased substantially during this time, while high school dropout rates have declined. Indeed, when looking at the share of young adults in the labor force and/or in school (full or part time), we see that this share has actually increased slightly since the 1980s (Technical Appendix Figure B3).
An aging population accounts for a decline of over a million workers since 2001
To quantify how aging affects the long-term decline in California, we isolate trends from two sources of change in participation over time: (1) the population getting older, given that older adults are less likely to participate in the labor force and (2) the shifting participation within age-gender groups. First, what would have happened if California’s population by age and gender stayed constant? Second, what if participation within each age-gender group remained constant, but California’s population aged as it has?
As Figure 3 illustrates, our scenarios demonstrate that older adults’ participation increase is not large enough to counteract the overall aging trend. If the population shares by age and gender remained at 2001 levels, participation would only have fallen slightly, from roughly 67 in 2001 to 66 percent in 2023. It would be over 4 percentage points higher today, with roughly 1.2 million more Californians working. On the other hand, if older adults had not begun working more, and the population aged as it has, we would have nearly the same participation as in 2022 and 2023.
California’s long-term downward trend is almost entirely due to an aging population
Percent in labor force

SOURCES: Current Population Survey; Authors’ calculations.
NOTES: Left axis shows share in labor force by year. Annual averages computed over all months in year, except for 2023 (through November). “If participation among age groups stayed at 2001 levels” shows hypothetical labor force participation rate if age-by-gender group specific participation rates are fixed to 2001 levels, and only the age-gender population structure varies. “If age of population stayed at 2001 levels” shows hypothetical labor force participation rate if age-by-gender group population shares are fixed to 2001 levels, and only the age-gender specific participation rate varies.
Labor Force Participation Mostly Recovered since COVID-19
Labor force participation declined quickly with the rapid onset of the COVID-19 pandemic and the associated recession. Even though the labor market began to recover in late 2020, the average labor force participation in 2020 was over 1.5 percentage points lower than 2019 (Technical Appendix Figure B4). Nearly 85 percent of this decline was recovered by 2022, though participation declined slightly in 2023 and is now less than 0.5 percent below the 2019 annual average.
The lower participation level in 2023 compared to 2019 is consistent with the long-term aging trend shown in Figure 3. In other words, given the gradually aging population we might expect participation to not fully recover to pre-pandemic levels, absent large increases in participation within age groups.
People are working fewer hours now compared to pre-pandemic levels
To understand total statewide labor supply, we must know both who is working and how much they are working. Although the participation rate has almost recovered, people are still working fewer hours than before the pandemic. Compared to 2019, total hours worked in 2023 was roughly 34 fewer hours per year, per person (Technical Appendix Figure B8). This reflects both fewer hours worked per worker and lower labor force participation among the overall population. Fewer hours worked drove 61 percent of the decline, while decreases in participation only explain 39 percent.
Not all demographic groups have recovered their annual hours worked equally. Women have seen only a slight decline in hours worked (9 hours), entirely driven by slightly lower hours worked per worker. For men, the story is different: declines in total hours are nearly five times as large as for women, with larger declines in hours and participation. We also see differences across racial groups. Hours have fully recovered and slightly surpassed pre-pandemic levels for Black adults, nearly recovered for Latino adults, but still lag pre-pandemic levels for Asian and white adults (Technical Appendix Figure B7).
In light of the declines in aggregate labor supply driven by California’s aging population and the concern about meeting workforce needs going forward, we next turn to examining the potential for improving both by addressing barriers to participation for other demographic groups.
Understanding Gaps and Barriers across Prime-Age Demographic Groups
In this section we examine the multiple socio-demographic factors for prime-age adults (25–54) that reflect differences in participation: gender, family structure, race, nativity, and education. These differences are multifaceted and interact with one another. The picture is more complex than we will be able to show here, because factors such as labor market discrimination, access to higher education, dependent care burdens and preferences, language, and formal work authorization are outside the technical scope of our study. Nevertheless, in the rest of this report we do discuss some of these factors where possible, to add context around possible policy solutions.
Large Differences in Participation Rates by Race, Gender, and Nativity
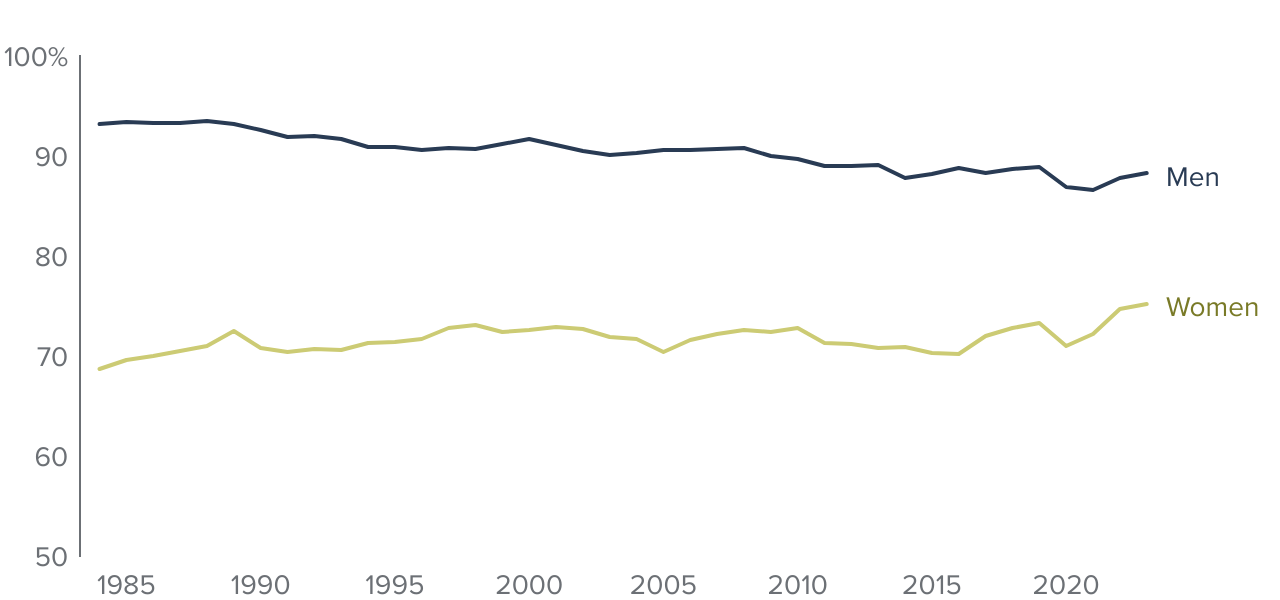
Men are more likely to participate in the labor force than women. Among prime-age individuals, men’s participation rate fell by 5 percentage points over the last 40 years (from 93 percent in 1984 to 88 percent in the first 11 months of 2023). In contrast, the rate for women has increased about 6 percentage points during the same period, from 69 percent to 75 percent, an all-time high. Because of these trends, the gender gap in labor force participation has narrowed significantly but is still notable at about 13 percentage points (Figure 4).
Men’s labor participation rate is at a long-term low, women’s at a long-term high
SOURCES: Current Population Survey; Authors’ calculations.
NOTE: Restricted to prime-age adults (25–54).
Labor force participation rates also vary by race/ethnicity. White Californians have the highest participation rates (86%), and Black Californians the lowest (81%). In terms of gender, Latino, white, and Asian men have very similar labor force participation rates (around 91%), with Black men 7 percentage points lower (83%) (Figure 5). Among women, Latina women have the lowest participation rate (74%). Overall, gender gaps in labor force participation rates are lowest among Black Californians (5 percentage points) and highest among Latinos (17 percentage points).
Latina women and Black men have lower labor force participation rates than their peers

SOURCE: American Community Survey; authors’ calculations.
NOTE: Restricted to prime-age adults (25–54).
Participation also varies by nativity and citizenship. Prime-age citizens (native- and foreign-born) had 85 percent participation compared to 78 percent for foreign-born noncitizens (Figure 6). This may be reflective of non-citizens having greater work restrictions than naturalized citizens (Lynch and Oakford 2013).
The labor force participation rate among US-born prime age adults is higher than among foreign-born noncitizens

SOURCE: American Community Survey; authors’ calculations.
NOTE: Left-side bars restricted to prime-age adults (25–54).
We also see larger gaps in participation between men and women when looking by nativity. Prime-age foreign-born men have a relatively high participation rate (93% for naturalized citizens, 92% for noncitizens) (Appendix Figure B9). For women, participation is much lower: 78 percent for foreign-born naturalized citizens and 63 percent for noncitizens, compared to 81 percent among native-born citizens.
Education Is a Major Factor in Participation Differences
Educational attainment is strongly associated with labor market participation rates. This association is not surprising. Unemployment rates are substantially lower for college graduates than for less-educated workers. And jobs held by college graduates tend to have much higher wages and employee benefits—a stronger draw to work—than jobs held by less-educated workers (Cuellar Mejia et al. 2023). Moreover, California’s economy has increasingly demanded and relied on highly educated workers (Johnson et al. 2017). As such, lower educational attainment constitutes a notable barrier to labor force participation—and labor market outcomes.
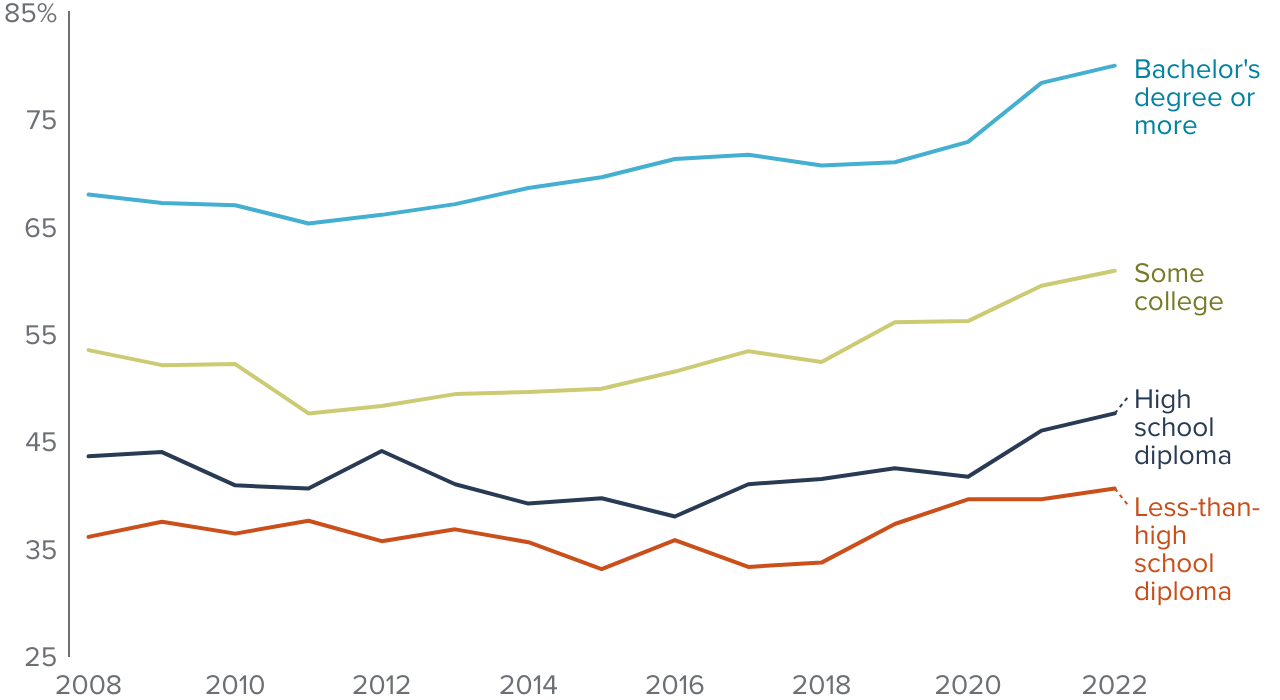
College graduates have labor force participation rates nearly 20 percentage points higher than those who have not completed high school. Recent trends also favor highly educated adults: labor market participation rates have declined over the past 15 years for every education group except those with at least a bachelor’s degree; high school graduates and those who did not complete high school had still not fully recovered from pandemic losses by 2022 (Figure 7).
College graduates have much higher labor force participation rates and have fared well over time

SOURCE: American Community Survey; authors’ calculations.
NOTES: Restricted to prime-age adults (25–54). The “some college” category includes associate degrees.
Differences by race, nativity are much smaller for those with similar education levels
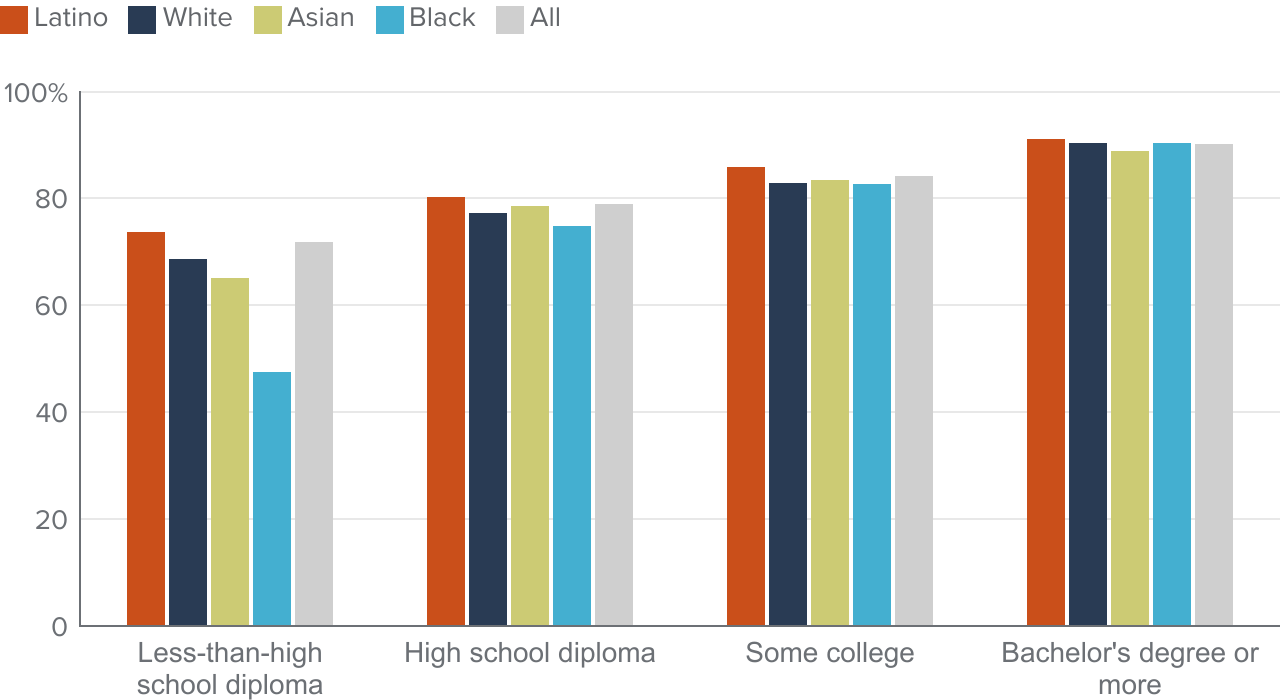
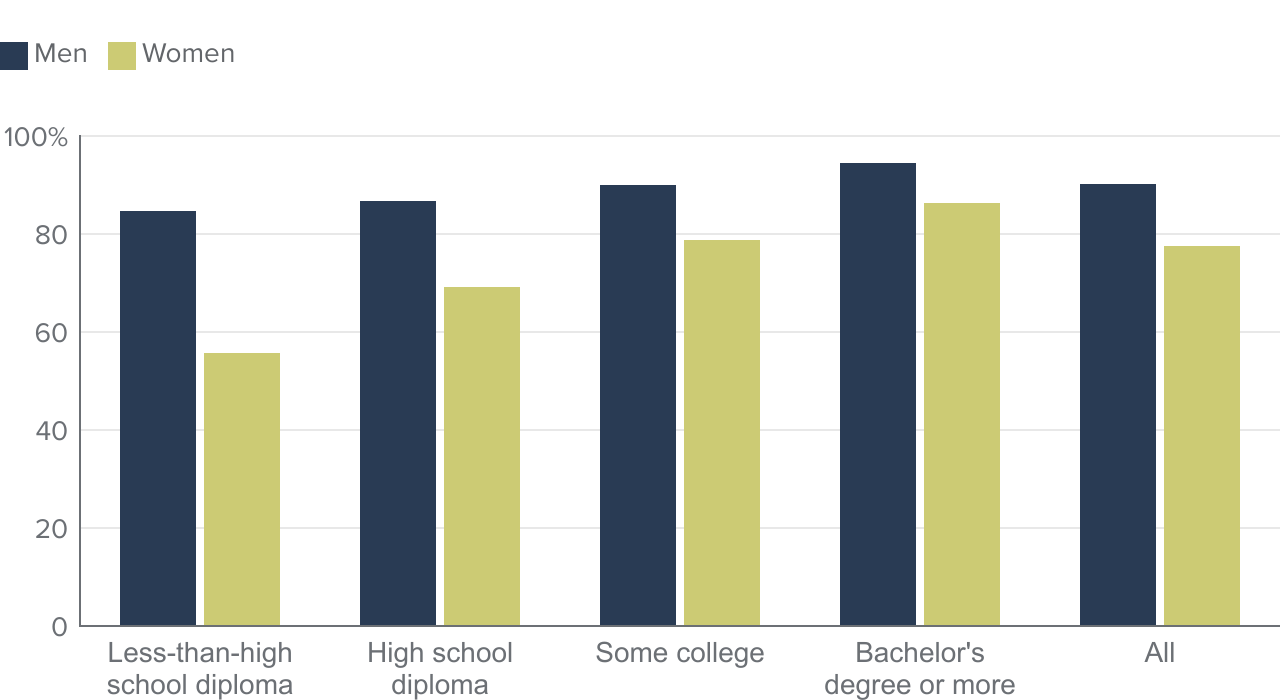
Most of the race/ethnic differences in labor market participation rates are driven by differences in educational attainment. Asian and white adults have higher labor force participation rates than Latino and Black adults largely because the former are more likely to be college graduates. Indeed, among college graduates, all race/ethnic groups have high labor force participation rates, and differences between groups are generally small (Figure 8).
Race/ethnic differences in labor force participation vary across education groups
SOURCE: American Community Survey; authors’ calculations.
NOTES: Restricted to prime-age adults (25–54). The “some college” category includes associate degrees.
Within education groups, race/ethnic differences are most evident for less-educated adults, especially those who have not completed high school—among that group, Latino and white adults are much more likely to be in the labor force than Black adults. To a large extent, immigrants drive the relatively high participation rates for less-educated Latinos.
Largest gaps by nativity are among those without a high school diploma
Gaps between foreign- and native-born Californians are largest for the least-educated (Figure 9). The native-born population with less than a high school diploma has one of the lowest participation rates (66%), but they are also a very small share of the prime-age native-born population (about 6%).
Among those with lower levels of educational attainment, foreign-born individuals participate at higher rates than native-born

SOURCE: American Community Survey; authors’ calculations.
NOTES: LFRP= Labor force participation rate. Restricted to prime-age adults (25–54). The “some college” category includes associate degrees.
When we look at the education distribution of native and foreign born, we see notable differences: while foreign and native-born adults have similar shares with a Bachelor’s degree or more (36% and 42%, respectively), foreign born adults have much higher shares with less than a high school diploma (26% vs. 6% for native-born) and lower shares with some college or an associate degree (17% vs. 31% for native-born).
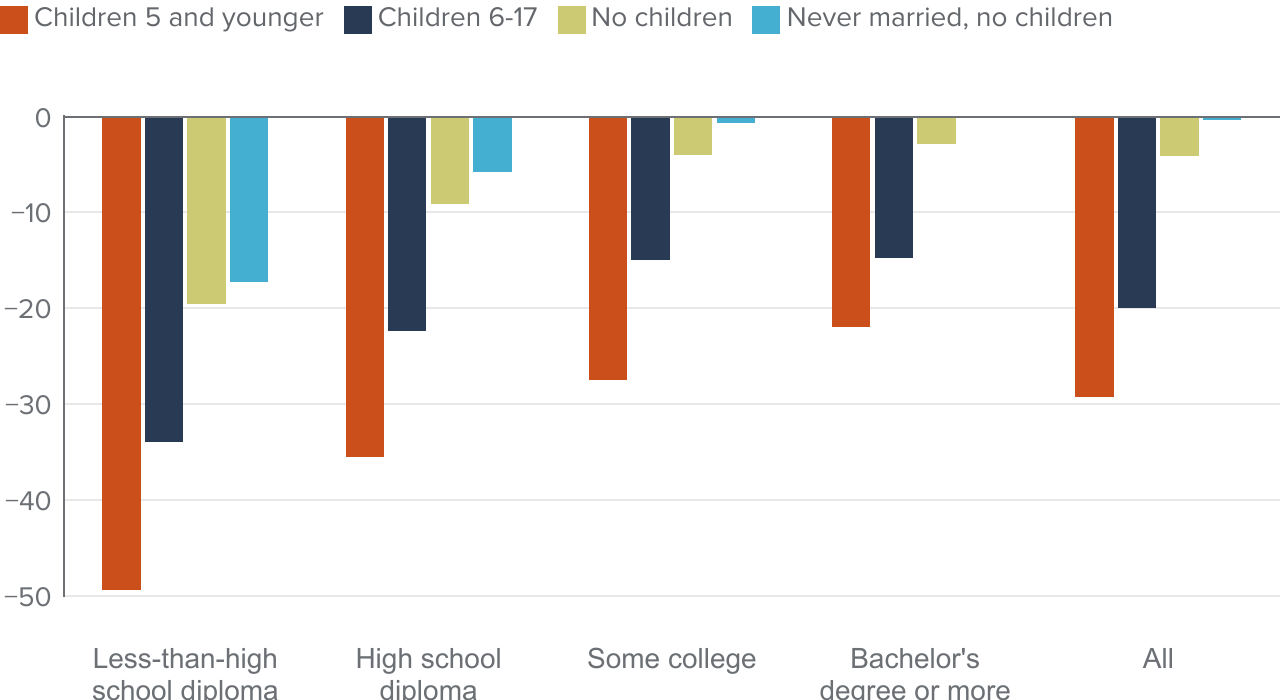
There are no gender gaps in participation for single, highly educated adults with no children
Gender gaps are most pronounced for women with young children (Figure 10). Among never-married women with no children, gaps are eliminated (and even slightly reversed) for more highly educated women as compared to highly educated men. At higher levels of education, gaps are almost eliminated for women in households with older children. Overall, this suggests that the presence of children seems to explain most or perhaps all the labor force participation gap between men and women at each level of educational attainment.
Gender gaps in participation are smallest for more educated adults without children in the household
Percentage points difference in LFPR of women and men
SOURCE: American Community Survey; authors’ calculations.
NOTES: Restricted to prime-age adults (25–54). Gender gap is defined as the difference in labor force participation rates between women and men.
Gender participation gaps are smaller at higher levels of education
Differences in participation across educational attainment levels are notable by gender. For men, labor force participation rates vary modestly across educational attainment, whereas rates vary more significantly for women. Only a bit more than half of women who have not completed high school are in the labor force, compared to over 80 percent of men who have not completed high school and over 80 percent of women with a college degree. This means gender gaps in labor market participation are especially pronounced at lower levels of educational attainment. Among college graduates, differences are modest (Figure 11). Notably, college completion rates have increased much faster for women than men over the past few decades. Women are now a clear majority of recent college graduates in California: in 2022, 57 percent of Californians aged 22 to 26 with a Bachelor’s degree or more were women. Thus, increasing educational attainment overall, and for women specifically, could both lower gender gaps in participation and contribute to an aggregate increase in labor supply.
Gender differences in labor force participation rates are largest among the less educated
SOURCES: American Community Survey; authors’ calculations.
NOTES: Restricted to prime-age adults (25–54). The “some college” category includes associate degrees.
Family Structure—Including Partnership and Childbearing—Has Significant Impacts on Labor Supply
Overall, labor force participation of women and men is dramatically different according to their family situation. Men and women living alone have similar labor force participation rates. But add a partner and the gender gap in participation surfaces, and it widens further when we look at people living with their partner and children (Figure 12). Specifically, the gender gap grows from zero for those living alone, to 12 points for those living with a partner but no children, to 25 points for those living with a partner and children.
This gender gap between women and men is largely explained by women’s labor force participation. For men, the labor force participation rate remains high across household types, and even increases under the presence of a partner and/or children. The opposite is true for women.
The effect of childbearing on women’s labor force participation is even stronger when the children are under 5, in part reflecting differences in availability, cost, and flexibility of early childhood care prior to entry in the K–12 school system. However, the decision of mothers to participate in the labor force and, perhaps, their access to childcare, is substantially different for women with and without partners. Lone mothers have a high labor force participation rate compared to the rest of women, regardless the age of their children.
Partnership and childbearing often dampen women’s labor force participation, while having the opposite effect for men
Labor force participation rate (%)

SOURCE: American Community Survey; authors’ calculations.
NOTES: Restricted to prime-age adults (25–54). With a partner includes married couples and cohabitating couples. Children are 18 years old and younger.
The gap for partnered women’s participation varies by race—but not for married mothers
The data also reveal a difference in labor force participation rates between childless women living alone and those living with a partner, which varies for different demographic groups (Figure 13). This is especially notable for foreign-born women (15.6 percentage points) and Latina women in general (13.1 percentage points). In contrast, childless women who are native born or who have a college degree see small differences whether married/partnered or single. And childless Black women living with a partner have a slightly higher labor force participation rate than childless Black women living alone. On the other hand, all groups see very similar gaps when they have children.
The “marriage gap” varies notably across groups unlike the “motherhood gap”
Difference in LFPR, percentage points
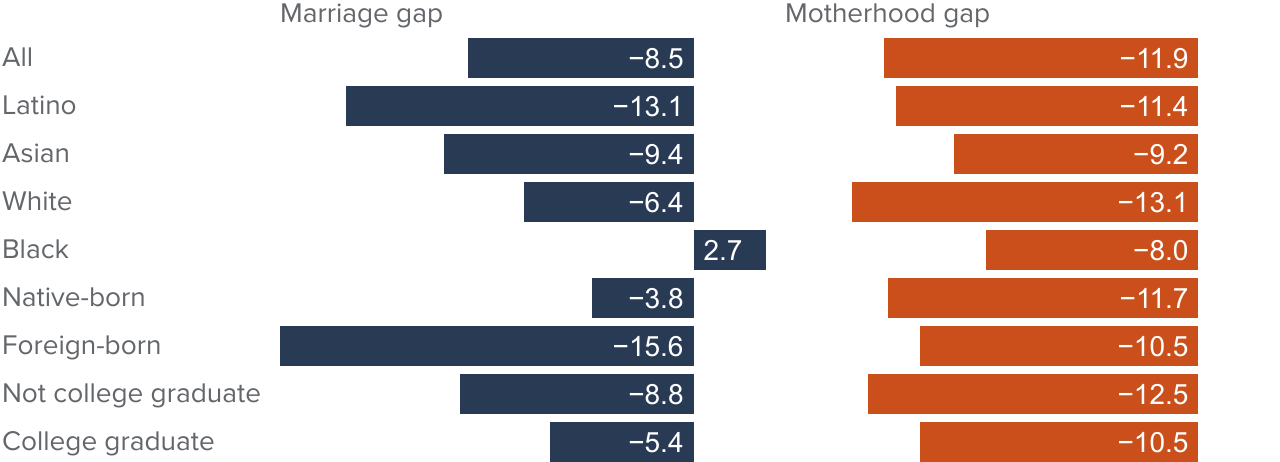
SOURCE: American Community Survey; authors’ calculations.
NOTE: Restricted to civilian noninstitutional prime-age adults (25–54). With a partner includes married couples (91%) and cohabitating couples (9%). Children are 18 years old and younger. The “marriage gap” is the difference in participation between women living alone and women living with a partner but not own children. The “motherhood gap” is the difference in participation between women living with a partner and those living with a partner and own children. See the labor force participation rates by race in Technical Appendix Table B1.
Family structure affects women’s participation differently by race, education, and nativity
The labor force participation of women in different household types varies tremendously by race/ethnicity, nativity, and educational attainment (Technical Appendix Table B1). Among mothers living with children and a partner, Latinas are significantly less likely to participate in the labor force than their white counterparts (64% vs. 73%). White and Asian women, on the other hand, have similar participation rates across the range of household types. The labor force participation of Black women stands out as it does not change as much with household type and is the highest across all race groups for households with women living with a partner (79% if kids are present and 87% if they are not).
Differences are also large by nativity: foreign-born mothers with children and a partner living at home are significantly less likely to participate in the labor force than their native-born counterparts (63% vs. 75%).
Disability and Labor Force Participation
Finally, we present trends on the participation of Californians with disabilities that may limit employment. Because this group is substantial—of similar size to the number of additional workers who would be in the labor force were it not for population aging—the possibility of reducing barriers to permit greater work opportunity could meaningfully grow labor supply and support individual well-being. More than 1.1 million California adults between the ages of 25 and 54 reported some type of disability limitation in 2022. The number of Californians with any disability jumps to more than 4 million among the population over age 16, though nearly half of people with a disability are age 65 or older and may be less engaged with the labor market (Technical Appendix Table B3).
The majority of prime-age adults with a disability are participating in the labor force, but people with disabilities have considerably lower labor force participation despite long-standing policy efforts to support more inclusive workplaces and laws that require employers to make accommodations for them to apply for jobs or perform job functions (Kruse and Schur 2003; Barnow 2008).
Participation Rates for those with a Disability Have Increased Since 2019
For prime-age Californians, there is more than a 25 percentage point gap in participation between those reporting no disability (84%) and those reporting any disability (58%) (Figure 14). The type of disability factors in substantially, with people reporting sensory limitations (vision and hearing impairments) having considerably higher participation (70%) compared to people with more daily activity limitations related to self-care and mobility (25–30%). This suggests that workplace accommodations can be successful in reducing barriers and increasing employment opportunities at least in some cases.
There has also been an uptick in participation among people with disabilities since the pandemic (Figure 14). Since 2019, participation has increased 14 percent for Californians with a disability after not changing at all over the previous decade. This suggests that changes to the workplace ushered in by the pandemic may have improved opportunities for people with disabilities to enter and remain in the labor force (Ne’eman & Maestas 2022).
Prime-age adults with any disability have much lower participation but rates have increased since 2019
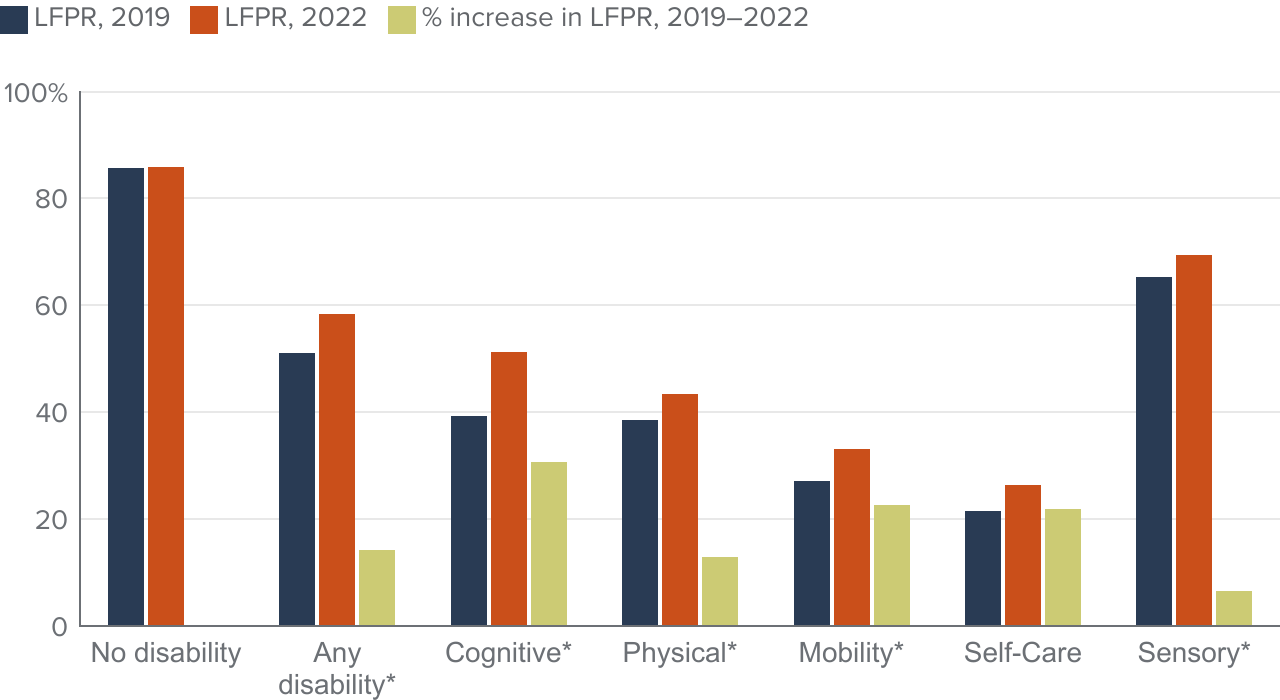
SOURCE: American Community Survey; authors’ calculations.
NOTES: Restricted to prime-age adults (25–54). Individuals can report more than one type of disability and be included in multiple categories. Increases in labor participation rates between 2019 and 2022 are statistically significant for any disability, cognitive, physical, mobility, and sensory difficulties. * Significant increase in LFPR between 2019 and 2022.
Notably, increases are largest among those with cognitive and mobility disabilities. While the former may in part reflect compositional changes due to an increase in the share reporting disabilities during COVID—perhaps related to the incidence of long Covid (Sheiner and Salwati 2022)—the latter could reflect improving labor market opportunities with more flexible work arrangements. Indeed, we also find that the increases in participation have been larger for more-educated workers (Figure 15). Among Californians with disabilities, only those with less than a high school diploma saw no significant increases in participation.
Higher education levels drove increased labor force participation among people with a disability
SOURCE: American Community Survey; authors’ calculations.
NOTES: Restricted to prime-age adults (25–54) with any disability. Increase in labor force participation rates between 2019 and 2022 were significant for all education groups except those with less than a high school diploma. Disability questions changed in 2008.
Policy Approaches to Boosting Participation
Closing gaps and eliminating barriers to labor force participation offer policymakers the opportunity to increase California’s aggregate labor supply while addressing longstanding divides. To meaningfully counteract the current and projected labor force declines, multiple and varying efforts will be required that take into account differences across multiple socio-demographic factors and how they interact. Eliminating gaps and increasing participation among large low-participation demographic groups could have substantial impacts on labor supply in aggregate. At the same time, addressing persistent gaps among particularly low-participation groups could improve individual well-being.
In this section we identify common themes linking prime-age low-participation groups across demographic dimensions. We pay particular attention to partnered Latina mothers—the largest group—to explore the potential impact and complexity of generating viable policy solutions to increase California’s labor supply. We then consider hypothetical changes in gaps by gender, education, and age, to illustrate the extent to which policy changes could increase labor force participation in aggregate.
Three Themes Emerge across Prime-Age Low-Participation Groups
Barriers that keep prime-age adult Californians from joining the workforce are varied and complex. Some are personal—such as physical limitations or family obligations, including caring for young children. Others are based on poor labor market prospects. And some are both; for example, poor labor market prospects for parents with very young children affect decisions to enter the workforce and pay for childcare.
Looking at the 10 largest prime age groups with participation lower than 60 percent, three general themes emerge (Figure 16):
- Low educational attainment is common: 8 of 10 groups have not completed high school. For these workers, unemployment rates are high, wages are low, and job benefits are poor—making workforce participation less attractive.
- Women are the majority: 8 of the 10 groups are women. Women with low levels of education tend to face even worse job prospects than men. Moreover, women are more likely to be the primary caregivers for children even if married (and as unmarried mothers).
- Black and white US–born, never-married men with less than a high school education have very low participation, especially in comparison to other men. Rates for Black and white men in this demographic (46% for Black, 50% for white) are lower than for Latino men (61%). In addition to less education, the rates for these groups also reflect poor job prospects and/or discrimination, made worse for some by past imprisonment. Research shows that employers are less likely to hire applicants with a criminal record (Binder and Bound 2019).
Foreign-born, married Latina women without a high school diploma constitute the largest of these groups. Nearly 200,000 prime-age Californians in this demographic are not working. Because this group includes so many of the demographic and social determinants examined earlier, they make an excellent example for thinking about what might be required to increase participation across the spectrum.
Ten lowest-participation groups represent nearly half a million potential workers

SOURCE: American Community Survey; authors’ calculations.
NOTES: Bubble size reflects average number in group that are not in the labor force annually from 2018 to 2022, ranging from 197,000 (largest bubble) to 10,000 (smallest bubble). See Technical Appendix Table B4 for exact numbers and rates for each group. Restricted to demographic groups with at least 100,000 individuals over the 5-year period from 2018-2022 (20,000 per year on average). These numbers were updated on 02/26/2024, after initial publication.
The barriers for partnered Latina mothers illustrate the complex and intersecting factors affecting participation
More than a third of all prime-age women (about 2.6 million) live with a partner and children. At a 70 percent participation rate, this means that over 791,500 of these women are not in the labor force. Latina women make up the lion’s share (47%) of this group. But why is participation low in this group? What distinguishes this population from other groups of mothers?
The answer is multifaceted: education levels and English proficiency play a big role (Figure 17). Nonparticipating Latina mothers with partners are much more likely to have lower levels of educational attainment, to not be US citizens, and to have limited English proficiency compared to their white counterparts.
The presence of young children is a critical factor in whether women participate in the labor force. Interestingly, Latina mothers in this group are less likely than their counterparts to have children under five. One explanation could be that they tend to be younger when they start their families, so their children are older when they are of prime workforce age. In that case, the presence of a partner appears to be driving their relatively low participation rate among mothers.
Nativity and citizenship status are also important factors. Foreign-born, partnered Latina mothers also have very high rates of nonparticipation (63%), much higher than Black (30%) and white (21%) mothers with partners, but much lower than foreign-born Asian mothers (84%).
Most partnered Latina mothers who are not in the labor force are foreign-born and have lower educational attainment
Partnered mothers who are not in the labor force, percent
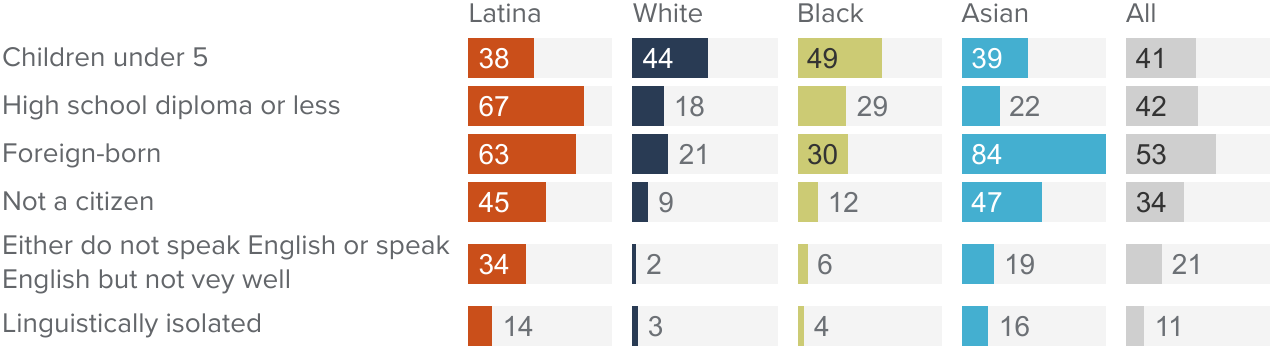
SOURCES: Authors’ calculations using the 2022 American Community Survey 1-Year PUMS.
NOTES: Based on 374,0000 Latina women, 228,700 white women, 147,000 Asian women, and 13,900 Black women. Linguistically isolated individuals are those living in households in which either no person age 14 or older speaks only English at home, or no person age 14 or older who speaks a language other than English at home speaks English “very well.”
For partnered Latina mothers, low participation may also reflect poor labor market opportunities given lower educational attainment (67% have at most a high school diploma), lower available wages relative to the wages they are willing to accept, immigration status, and language barriers. In light of all these barriers, it may seem more financially efficacious either not to work or to work informally, given fiscal policies like joint taxation, the Earned Income Tax Credit phase-out, and the structure of disability insurance (Barkin 2019).
Cultural norms and expectations may play a role too. Ultimately, a family’s decision about whether a parent participates in the labor force is personal, and requires balancing a host of economic, social, and family considerations. Nevertheless, some complex family decisions are amenable to policy. For example, policy shifts to lessen structural economic barriers could make a difference, widening the scope to improve individual economic outcomes and increase aggregate labor supply.
How Much Can We Affect Aggregate Labor Supply by Closing Gaps?
Many of the labor force participation gaps we’ve covered reflect barriers potentially amenable to policy action that will benefit individual and household economic outcomes. There could also be a wider benefit to such action: it could boost the labor force’s overall size. The question is, how much? For which populations? And what policy changes would be most effective?
To get at these questions, we have conducted an analysis using hypothetical scenarios focused on gender, education, and age. The results yielded a sense of what could be expected if a policy or set of policies is able to substantially reduce or eliminate key gaps in participation. We discuss them below.
Increasing participation among older Californians would have the largest impact
Increasing participation among 55–64 year-olds to match participation among those a decade younger—akin to reducing “early” retirements before age 65—would mean nearly 700,000 more California workers, recouping nearly one-third of the loss statewide since 2001.
Boosting recent improvements in participation among 55–74 year-olds by the same amount they increased since 1990 (i.e., “doubling” the increase from recent decades) would mean more than 720,000 additional workers.
Caveats: Older Californians may not want to delay retirement, and factors like health, retirement savings, and workplace amenities play an important role. But increasing participation in recent years among older adults—and even higher participation among the more educated—could mean that an increasing trend of work in older ages could partially counteract aggregate declines.
Policy examples: Addressing age discrimination in the labor market (Neumark 2019) and improving workplace flexibility (Choi-Allum 2022) could further these trends.
Policies addressing racial gaps in education would have clear impacts and are actionable
Eliminating educational attainment gaps could amount to roughly 1.2 million more workers—and over 450,000 more prime-age workers—enough to account for nearly all of the aging-related participation decline in California’s labor force since 2001. Even closing half of the education gap among prime-age adults would close roughly half of the Black-white gap, most of the Black-Asian gap, nearly all of the Latino-white gap, and all of the Latino-Asian gap in prime-age participation (Technical Appendix Tables C8 and C10).
Caveats: Eliminating educational attainment gaps can only happen gradually, especially if efforts are targeted to degree attainment among younger cohorts.
Policy examples: Efforts to improve participation among middle-aged and older workers with accumulated workforce experience and skill—but low formal education—could have a large impact in the short run (e.g., Blair, Debroy, and Heck 2021). Over the long run, improving gaps in educational progress that emerge at all junctures of pathway to career are promising (McConville et al. 2021; Cuellar Mejia et al. 2023).
Increasing participation among mothers of young children would have a modest impact in aggregate
If mothers of young children were able to take “full” advantage of childcare, so that work participation was equal to mothers with older children, the statewide participation rate would increase by less than 0.5 percent—closing about 4 percent of the overall gender gap. Even so, in the aggregate, this could put over 80,000 more women in the labor force annually.
Reducing gaps among married women would be more significant overall: entirely eliminating the gap in participation between married men and women could yield over 1 million more workers. A smaller but notable impact could be had from increasing the participation of married women to that of single women (over 200,000 more participating).
Caveats: Gaps among married women and single mothers may be less malleable to policy action, as they may reflect differences in labor market opportunities, persistence of labor force exit after young children age, differences in spousal earning power, and household preferences.
Policy examples: Supports for working parents, like paid family leave, tax credits for low-income workers with children, and childcare subsidies, have been shown to increase their labor supply (Rossin-Slater et al. 2013; Schanzenbach and Strain 2021; Enchautegui 2016).
As even these high-level, ballpark results demonstrate, there is much room for policies targeting demographic gaps and participation differences to increase California’s overall labor supply.
Conclusion and Policy Considerations
For much of California’s history its labor force was growing. But that growth has slowed and reversed in recent decades. And an aging population has led to declines in participation—which will likely continue over the coming decade. Along with lagging or reversing population growth in California, this could mean a shrinking labor force in aggregate.
The challenge California faces is twofold: aggregate needs for a strong and sizable statewide labor force, and longstanding notable gaps in labor force participation by race, gender, nativity, and disability status. These gaps reflect broad differences in economic circumstances and mobility, highlighting the intersection of many socioeconomic disparities, trends, and policies. Of course, maximizing participation to 100 percent is not a realistic nor desired goal. But policy efforts to remove labor market barriers—such as childcare, education, skills, and language—could lessen gaps, improve economic outcomes of low-income groups, and, in some cases, help counteract downward trends in statewide labor supply.
California faces a continued long-term decline in its labor force. Nearly all of the long-term declining labor force trend in California is due to an aging population. With state projections suggesting an aging, and smaller, population in the next decade—and absent significant shifts in migration patterns—it is reasonable to expect a smaller labor force in aggregate. In turn, this could have broad implications for growth in key industries and for policy goals such as health care, elder care, infrastructure, and climate change.
At the same time, even though participation among older workers is low, it has been growing gradually for decades. More flexible work options could enhance this increase, not just for older adults but also for those with disabilities. This would likely be concentrated among workers with higher education levels, involving jobs that can more easily be remote or hybrid. Encouraging more older adults to work could go a long way to offset declines in participation—but would require attentiveness to their preferences. Remote work and flexible work schedules (fewer hours per week, for example) might help in this regard.
Labor force participation gaps and barriers are multifaceted—and require multiple and multifaceted policy solutions. Education is clearly a factor—it explains most of the gaps across race/ethnicity and also some gender gaps, especially in households with young children. Meaningfully reducing education gaps could lead to notable increases in participation among Black and Latino adults—and as our analysis suggests, could add hundreds of thousands of new workers to the labor force. But changes in educational attainment cannot happen quickly: the key time for this is when adults are young. However, retraining programs and flexible online higher education enrollment could help workers in their 30s and 40s. Policies to improve labor market prospects for workers with less formal education could also help address labor market gaps by race and nativity. This could include, for example, efforts to improve employment outcomes among workers with accumulated skills but low formal education (e.g., Blair, Debroy, and Heck 2021).
Childcare is also a major factor: participation is lowest among women with young children, especially Latinas and those with low education levels. More broadly, difficulties with childcare may be inhibiting parents’ ability to take on more hours, be productive at work, or accept a job with less flexibility but higher pay—which would have impacts on economic outcomes beyond just participation (Gascon 2023).
Low-participation groups offer the most policy leverage. Addressing barriers for the lowest-participation groups would reduce gaps and increase California’s labor force—and directly benefit some of the lowest-income groups in California. These groups vary, with distinct challenges: single Black men with low levels of education and married Latinas are among the largest low-participation groups. For the former, criminal and incarceration history play an outsized role. For the latter, addressing childcare, language, and formal skill barriers could make a significant impact (e.g., Galdámez and Carmona 2022). Policies to provide easier paths to entrepreneurship and formal business incorporation could also benefit those with informal businesses or side jobs who have limited connection to the formal labor market. The increasing participation among workers with disabilities demonstrates that improved workplace flexibility post-pandemic may be changing opportunities for these workers; efforts to continue and expand these trends could be fruitful given that over 1.1 million prime-age Californians report a disability.
Labor force participation is just one aspect of household economic opportunity, but it is fundamental to Californians’ economic well-being—and to the broader state economy. Addressing California’s longstanding gaps is critical at this juncture. We have an historic opportunity to improve individual economic opportunities and meet state workforce needs. The pandemic caused shifting work modalities, which present new possibilities for adults with children, older workers, and people with a disability. Harnessing these shifts to jointly advance workforce needs and labor market equity is California’s double-edged economic policy challenge—and opportunity—in the coming decades.
Topics
Economic Mobility Economic Trends Economy Jobs and Employment PopulationLearn More

Understanding California’s Labor Market

Who Are California’s Workers?

California’s Energy Workforce

Improving California’s Labor Market for Men without Four-Year Degrees

Working Helps Keep Californians with Disabilities out of Poverty

Promoting Labor Force Opportunities for California’s Latina Population
Addressing Labor Market Barriers for Californians with Disabilities

Supporting Older Workers in a Changing Labor Market

California’s Care Workforce

Video: Labor Force Participation in California
