
California’s workers power the economy.
- Over 19 million Californians work either for wages or salaries (89%) or are self-employed (11%).
- Seven in ten workers have full-time, year-round schedules. Nearly a quarter (23%) work part time, and 7% are full time but work just part of the year. In 2024, 46% of part-time workers said they wanted to work part time.
- One-third of all California workers are employed in the health care and social assistance, professional, scientific, and technical services, and retail trade sectors. Compared to the US, a larger share of workers in California are employed in professional services (which includes the tech sector), with a larger share in the San Francisco Bay Area than in other parts of the state.
Californians work in a variety of occupations.
- Management is the top occupational group statewide (11.5%). Office and administrative support is the next largest (9.8%); these jobs are more common in the Sacramento area and Los Angeles County. Sales jobs (such as cashiers) are third at 8.4%. Transportation is fourth (7.1%), and these jobs are more common in the San Joaquin Valley, Sierras, and Inland Empire. California has a larger share of workers in computer and mathematical occupations (like software developers) than the US and a slightly larger share in food preparation and serving occupations.
- Over the long term, California has seen the largest job growth in occupations that typically pay high wages (including business and finance and health care practitioners), slower growth among lower-wage occupations (like health care support and transportation), and little growth among middle-wage occupations.
- In some occupations, workers are largely from the same demographic group. For example, 78% of child care workers are women of color, 76% of farmworkers are immigrants, and 97% of construction workers are men.
The workforce in California is demographically diverse, and it is aging.
- Like the state’s population, California workers are predominantly Latino (40%, a growing share) or white (33%); the remaining 27% of workers are Asian/Pacific Islander, Black, or other races/ethnicities.
- The share of workers 55 and older has increased 53% since 2005, and the average California worker is now slightly older than the average worker in the rest of the country. However, two-thirds of workers in the state are in the prime working ages of 25–54.
- Women make up 45% of the workforce, up from 32% in 1962, but growth slowed after the mid-1980s.
- Nearly a third of California workers are immigrants. While the largest share of foreign-born workers are from Mexico (37%), newly immigrated workers—arriving within the last five years—are more likely to be from Asia (37%) than Mexico (27%). Many immigrant workers are US citizens (53%); roughly 25% are undocumented.
California’s workers are demographically diverse
Millions of workers

SOURCE: Authors’ calculations using 2024 American Community Survey (IPUMS-USA).
Most California workers are one of multiple adults financially supporting a household.
- The vast majority of workers (76%) live in households with at least one other working adult such as roommates, siblings, grandparents, adult children, or a spouse or partner.
- Among the 24% who are sole earners, about half support children and other adults. Black women (21%) and white men (17%) are especially likely to be sole earners supporting multi-person households.
- Family and personal needs factor into work intensity, particularly for women, who on average spend more time than men on caregiving and are less likely than men to work full time, year-round (64% vs. 75%).
Wages vary across regions, demographics, and other dimensions.
- The median full-time, year-round worker in California earns about $31 an hour, or $65,000 a year; in the rest of the US, the median worker earns $27 per hour. Thirty-six percent of California workers earn low wages (two-thirds of the statewide median, or less than $21 per hour), and almost 10% of workers are classified as poor by the California Poverty Measure. Wages vary dramatically based on skills, type of work, background, geography, and demographic characteristics.
- Differences in cost of living do not completely explain differences in wages across the state. The Bay Area has the highest median wage per hour ($37) and the San Joaquin Valley and Sierras have the lowest (about $22).
- The median white or Asian/Pacific Islander worker earns about $36 an hour, compared to $27 for the median Black worker and $21 for the median Latino worker.
- Women earn less than men ($25 vs. $29 an hour)—although gender wage gaps have narrowed over time, progress has slowed.
- Wages tend to grow with experience: the median hourly wage among young workers (age 16–29) is $19, compared to $31 among those 30 and over.
- Higher education is closely tied to higher wages. Those with at least a bachelor’s degree typically earn $39 an hour, compared to $23 for those with some college and $20 for those with a high school diploma. About 41% of California workers hold a bachelor’s degree or more, up from 31% in 2005; meanwhile, the share without a high school diploma fell 5 percentage points, to 11%.
Over one-third of California workers earn low wages—less than $21/hour
Millions of workers
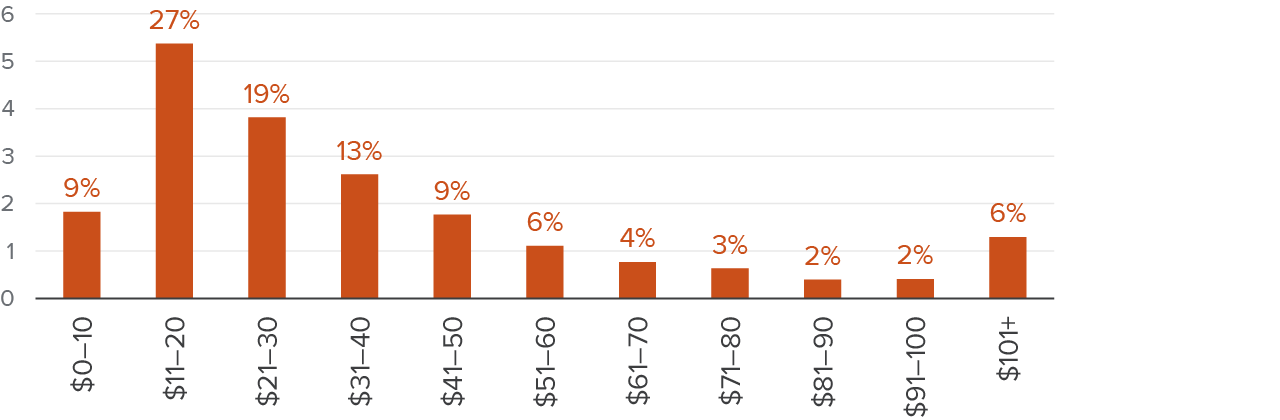
SOURCE: Authors’ calculations using 2024 American Community Survey (IPUMS-USA).
NOTES: This figure shows the distribution of California workers by estimated hourly wages in 2024, for workers ages 16 and over who worked at any point in the previous year, excluding those who are self-employed. See Thorman et al. (2024) for details about methodology.
Topics
Economic Mobility Economic Trends Economy Immigrants in California Jobs and Employment Population Workforce and TrainingLearn More
Blog Post · May 21, 2026
Super-commuters in California

Fact Sheet · May 2026
California’s Economy

Explainer · April 2026
Understanding California’s Labor Market

Fact Sheet · February 2026
Self-Employment in California

Report · December 2025
Work and Economic Insecurity in California

Blog Post · September 23, 2025
Half of Students at California’s Public Colleges Work While in School

Report · August 2025
California’s Energy Workforce

Fact Sheet · August 2025
Poverty among California’s Workers
