Table of Contents
- Key Takeaways
- Introduction
- The Program Evolves as Eligibility Expands
- Younger Four-Year-Olds Pose New TK Challenges
- Supporting TK Student and Family Needs
- TK Enrollment Is Growing, but Participation Has Declined
- How Has Expansion Changed Which Children Participate?
- What Drives District Variation?
- Does School Access Explain Participation?
- Conclusions and Implications for Further Expansion
- Notes and References
- Authors and Acknowledgments
- PPIC Board of Directors
- Copyright
Key Takeaways
In 2021, California passed the Universal Prekindergarten (UPK) program (AB 130), requiring public schools with kindergarten to provide free, high-quality, inclusive prekindergarten for all four-year-olds. Transitional Kindergarten (TK) has been available since its inception in 2012 but limited to children who turn five in the fall. This new initiative incrementally expands age eligibility, beginning in 2022–23, with full implementation to be completed by 2025–26. As we approach this completion year, it is important to know how well the expansion is working for districts, schools, and families.
To this end, we analyzed state, district, and school-level trends in enrollment and take-up across demographics, student needs, and region. We compared these trends to enrollment patterns in 2019–20, before the policy expansion and the COVID-19 pandemic. Key themes include:
TK enrollment is growing, but take-up rates have declined since pre-expansion years. In 2023–24, TK served over 150,000 students statewide out of an estimated 215,000 eligible children—about 70 percent participation. While this is a significant increase compared to prior years, the rate has fallen by 13 percentage points from 2018–19 and by 7 percentage points from 2021–22.
As TK eligibility expands, the program is evolving. Most elementary and unified school districts with kindergarten are offering TK now—in 2023–24, 91 percent of elementary and unified districts and 85 percent of schools. A growing number have a full-day option. School districts reported increasingly moving away from the academic kindergarten-like curricula of original TK to more structured play-based learning.
Expanding eligibility for younger four-year-olds presents new challenges. Younger four-year-olds and those about to turn five have vastly different developmental needs. To accommodate these differences effectively, school districts need ongoing support with facilities, staffing, and curriculum. Of the districts we interviewed, the top challenges included upgrading facilities to be age-appropriate, developing TK curriculum, and building staff and leadership capacity to accommodate early childhood education in K–12.
Basic Aid districts are less likely to offer TK compared to others. Basic Aid districts are funded primarily through property taxes rather than the state funding formula. In interviews, they reported community demand for TK but cited the expense and lack of facilities as barriers to offering it.
TK participation trends among Dual Language Learners (DLL) have declined since pre-pandemic rates. DLL take-up rates have fallen 18 percentage points. As TK eligibility expands, participation among DLL students is 71 percent—similar to all students overall and socioeconomically disadvantaged (SED) students.
TK expansion does not appear to increase participation rates among children from underrepresented communities. Pacific Islander, Native American, and Black children continue to participate in TK at lower rates compared to their white and Asian peers. In 2023–24, 60 percent of Pacific Islander, 66 percent of Black, and 67 percent of Native American children participated, compared to 72 percent of white and 73 percent of Asian children. Notably, participation among Latino children has sharply declined from pre-pandemic rates by 16 percentage points.
Introduction
California’s 2020 Master Plan for Early Learning and Care gives the state’s families choice among programs and providers—private or public, subsidized or unsubsidized (if eligible), offered in schools, child care centers, and family child care homes. This landscape changed significantly with the introduction and subsequent expansion of Universal Prekindergarten (UPK) to be available to all four-year-olds by the 2025–26 school year. Transitional Kindergarten (TK) is one of California’s Early Childhood Education (ECE) options for families with preschool-aged children. It is free, provided by the K–12 system, and meant to use curriculum, instruction, and facilities developmentally appropriate for four-year-olds.
First offered in 2012–13 only to children turning five in the fall, TK participation grew from 17 percent of eligible children to a peak of 83 percent in 2018–19. The pandemic brought enrollment and participation rates down considerably in 2020–21 and 2021–22. TK’s very first year was only for children born in September and October. After state changes to the birthdate cutoff for kindergarten, the program accommodated children born between September and December who were now too young to be eligible for kindergarten. UPK introduced further expansions of age eligibility—starting in 2022–23 with children born between December and February and gradually adding those born before April, June, and September over the next three years. By 2025–26, all four-year-olds will be eligible for TK in California.
While TK enrollment is optional for families, all school districts with kindergarten must offer it and provide age-eligible children a slot. For public school districts funded by the Local Control Funding Formula (LCFF), TK is paid for through average daily attendance (ADA) just as other K–12 grade levels. Some districts do not receive funding from the state because their property tax revenue is at least at the level of what the district would receive under the formula. Known as Basic Aid districts, they are primarily funded by local property taxes rather than LCFF and as a result, they do not receive additional funding per TK-enrolled student.
Building on previous PPIC research, this report examines how school districts and families throughout the state are responding to TK’s increased availability, using the most recent data available from 2023–24. We estimate overall take-up rates among eligible four-year-old children and look at the accessibility of TK programming by estimating the number not enrolled. We then analyze whether program take-up differs across student characteristics—including race and ethnicity, home language, and disability status.
To complement our analysis of enrollment trends, we discuss insights from interviews conducted with ten school districts—including districts that have opted not to provide TK. Our conversations with districts provide important context for the types of challenges and successes districts are experiencing on the ground, as well as how TK provision supports DLLs and students with disabilities. Interview details can be found in Technical Appendix A.
The Program Evolves as Eligibility Expands
The California Department of Education’s (CDE) recent survey of 1,506 local education agencies (LEAs) with kindergarteners—including school districts, charter schools, and county offices—shows that as the expansion unfolds to include ever younger four-year-olds, more LEAs are implementing TK closer to UPK ideals (Wang et al. forthcoming). For example, 84 percent are increasing full-day options (over four hours) and 85 percent are offering TK at all of their school sites. Despite this progress, respondents indicate significant challenges with facilities, curriculum development, and staffing, which suggests the need for increased funding and professional development.
Some Districts Find Adapting Play-Based Curricula a Challenge
The TK introduced in 2012 was limited to students who would turn five in the fall and used a more academic approach to pre-kindergarten learning. The current expansion requires developmentally appropriate play-based curricula suitable for increasingly younger four-year-olds. As one of our interviewees said: “TK is very different than kindergarten…[it] initially came out too academic, but [it is] now focused on play…[we] had to help teachers understand play-based curriculum.”
Indeed, staffing requirements emphasize the importance of expertise in early childhood and acknowledge the need for more child-teacher interaction. By 2025–26, UPK requires that all TK teachers must be fully credentialed and have at least (1) 24 units in early child education or child development, (2) comparable professional experience in a classroom with preschool age children, or (3) a child development teaching credential. By this school year, districts will also be required to create classrooms with a 10:1 student-to-adult ratio.
In the meantime, to support LEAs, parents, and the public, CDE has released resources for high-quality early learning curriculum development. One such—California Preschool/TK Learning Foundations (PTKLF)—enumerates skills expected of children aged three to five that can be cultivated through child-led play, exploration, and interactions in an early education environment.
Among the ten school districts we interviewed, districts viewed play-based learning as an essential component to TK programming. This suggests that the PTKLF resource may be an effective tool. Some districts shared that this type of curriculum is gaining popularity among kindergarten grades. Many reported a variety of approaches for TK curriculum development, ranging from contracted social-emotional learning tools to pulling elements from kindergarten curricula. One interviewee articulated the difficulty they have making sure their TK students get age-appropriate activities:
There really aren’t a whole host of instructional materials for TK … we were able to get [program] from a connection. Make it more of a structured program than structured play. But we were using kindergarten pieces to get TK students exposed to what they will come into in the kindergarten program. … we’re trying to scramble with what we can… but we also don’t get a whole host of recommendations.
Districts also shared that although resources like PTKLF are useful, they need deeper and broader support—such as professional development training and capacity-building for staff and leadership on teaching expectations for play-based learning. As one observed: “[The] district is focused on alignment and rigor, but what rigor looks like for ‘littles’ in TK requires training teachers and staff.” In many districts, ECE-credentialed teachers offered valuable insight into curriculum development and supported elementary teachers who had multiple-subject credentials.
This strategy was not without its challenges. One district shared that the new staffing requirements created tensions between TK teachers with different credentials, which hindered both curriculum development and teaching. In cases like this, capacity-building resources would be helpful to align staffing expectations with TK programming.
On the positive side, TK’s play-based curriculum has influenced kindergarten teachers’ instructional approaches. One district teams TK and kindergarten teachers for planning at the school site level. As a result, some kindergarten teachers now see the value in a play-based curriculum and incorporate elements into their own classrooms. Other districts described how TK has supported kindergarten teachers with grade transitions because it allows teachers an additional year to understand the needs of students before they enter kindergarten.
We’re getting a better understanding about what the areas of growth are for our students. There is more communication going on there. […] Our kindergarten teachers feel more comfortable knowing what they are walking into on day one, and that is incredible currency for any educator.
District and School Leadership Collaboration Drives Program Success
The engagement and trust of district and school leadership is a major success factor in TK curriculum evolution. Without partnerships from superintendents, school boards, and principals, moving towards a play-based curriculum—including adapting adequate facilities and training staff—is challenging. It may also impact how parents and families in the school community interpret TK goals, which could influence participation. One TK administrator articulated this challenge clearly, noting that many in school and district leadership have no background in ECE.
Building capacity for administrators is a big space that still needs work, and the other one is that district leadership does not understand what is needed and how to build an appropriate space for children. Including what the outdoor space should look like, and why it should look different than kindergarten … that’s been for me personally the most exhausting part of this journey … is fighting with the leadership.
Another TK administrator shared that district leadership, such as principals, are often unfamiliar with high-quality ECE environments, and at times unwilling to make investments to build one. Citing the academic nature of the 2012 version of the program and the paradigm shift principals and teachers now face, they said
We know principals set the tone in a school. If they don’t understand ECE they are really either ignoring TK because they’re like ‘I don’t understand it so I’m just going to let the department handle it for me’ or they are expecting things that are not developmentally appropriate.
In contrast, districts with collaborative partnerships or teams dedicated to streamline goals, curriculum, and professional development felt this allowed them to solve problems more effectively and share resources that may be hard to get otherwise. In smaller districts, the superintendent was responsible for implementing TK. In the larger districts it was a TK coordinator/Early Education Director. Our interviews suggested that adapting programming to meet eligibility expansion was significantly easier when district leadership had more experience and knowledge of ECE.
After-Care Is Critical, but Not All TK Programs Can Guarantee Slots
UPK requires TK programs to be a minimum of three hours per school day, which constitutes part-day. Full-day programs are four to six hours. LEAs can offer full-day programming by combining other programs with TK—such as the Extended Learning Opportunities Program (ELO-P), California State Preschool Program (CSPP), or other locally funded preschool programs. But even when TK programs are full-day, many parents and caregivers still desire after-school care to accommodate working schedules.
Districts shared with us that after-school care is an important component of child care for parents and caregivers. It may influence decisions to enroll children. They reported efforts to align after-school programming with TK—including partnerships with staff. But the current reality reveals a gap between demand and guaranteed access for appropriate after-school care options that maintain a continuity of care for working families.
Every TK district we interviewed had after-care through ELO-P. However, being in TK is no guarantee for after-care. Slots can be hard to get. Although districts prioritize families with greater need, they report long waitlists. In some instances, they offered TK and kindergarten children a shorter after-care program—lasting at least until the older students are dismissed. Districts are also working towards having more developmentally appropriate after-school programming that models a continuity of care. A few identified their partnerships with ELO-P providers and community-based organizations as essential to programming that feels consistent and intentional for young children. As one interviewee put it:
The TK/K [ELO-P] have done a tremendous job. They made sure it was the school day continuing on as opposed to just running around without shoes and seeing what happens…. It has been observed with our K and 1st grade teachers at the start of school, even though some of these students are still incredibly behind, they are still further ahead than everyone thought originally.
Younger Four-Year-Olds Pose New TK Challenges
UPK implementation requires integrating increasingly younger four-year-olds over time into TK. For over ten years, students turned five in the fall of their TK year. Starting in 2022–23, TK children could have winter birthdays. And in 2023–24 they could have birthdays as late as April. These age differences may seem small, but for four-year-olds they mean huge developmental differences, including behaviors and toileting. According to many of the districts we interviewed, the timeline has proven challenging on two levels—to both increase the number of children and to serve those so much younger.
More Socio-emotional Needs
Districts shared that TK teachers are observing more socio-emotional needs among these younger children. One district described their first week of TK this school year as “Shark Week.” The number of biting incidents were higher than ever, as a room full of 24 four-year-olds not accustomed to sharing or interacting with peers suddenly had to do so for multiple hours. This was not the only district to mention behavioral challenges. One shared that the COVID cohorts of TK children had less experience interacting with peers, and their parents might not have realistic expectations for their children’s school experiences.
A significant challenge was helping staff develop appropriate expectations and toolkits to support these younger four-year-olds. For example, one TK administrator described attention challenges among students: “How do you handle redirection when it’s time to get off the big toy? You know, that’s a big piece of adult learning.” And what might appear to be a behavior challenge in need of serious intervention if it were exhibited by an older child might be appropriate for a young four-year-old. “This doesn’t mean the child needs an IEP (individualized educational plan). This means they’re four.”
A district with a full-day program did report that some children need rest, but they do not have nap time. They have instructed their TK staff:
We’re not doing nap time but listen to the kids. Their bodies will tell you what they need and respond to that. It’s ok. We’re not … giving them a PhD in TK. We’re here to learn about school, learn about being friends… The kids will tell you what they need and please give it to them.
These challenges underscore the reality that to deliver high-quality early learning in districts where the TK providers have limited ECE experience, they need teacher training.
Facilities
According to the CDE survey we referred to at the beginning of this report, most LEAs have sufficient classroom space for TK. Yet our district interviews revealed that adapting facilities to be age-appropriate remains a challenge in UPK implementation. Few districts reported being able to have classrooms, classroom locations, and play spaces designed for and dedicated to TK. And as TK children have gotten younger, the ramifications of lacking ideal spaces have grown. The location in the building matters—how far do children have to walk from the front door to their classroom? How far to the lunchroom or to the play yard? When they are at lunch and in the play yard, are they sharing spaces with older children? Is the play yard appropriate for their level of physical development?
District interviewees cited engaging and accessible play spaces as both critical to development and to children’s ability to regulate behavior. This response in particular drew a sharp and illuminating contrast:
…our facilities aren’t ideal for students like this, like, for example, the private preschools in the area have really interesting dynamic outdoor spaces, and the children spend most of their time out there. [There is] shade, a variety of textures on the ground, a variety of materials. It’s really interesting. And there’s opportunities for heavy lifting and pushing. And like these really critical physical experiences… We have flat ground that’s grass… We have sandboxes. But it’s very different… But I do think that that’s why we’re seeing some of the behavior we’re seeing because it’s just not an interesting enough space for them.
Quick access to the right sized toilets is critical to helping four-year-olds maintain—or, in some cases, develop—toileting regulation. Not all TK classrooms have toilets, which causes more accidents, and more staff involved with cleaning up. As one respondent said “K–12 is not equipped for ECE. This is predictable.”
One district cited the value of CDE’s Toileting Practices Toolkit for guiding preparation to help four-year-olds develop and maintain toileting independence. Regardless, it can be challenging to maintain proper TK staffing ratios simply because of this issue. Some districts have experienced tensions with the teachers’ union, which has pushed back against having certificated staff help with toileting.
One way districts with limited resources accommodate toileting for their growing numbers of younger TK children is to move TK programs into preexisting kindergarten classrooms with appropriately sized toilets. The kindergarteners are moved into other classroom spaces without toilets. One TK coordinator told their principals “You have to put UTK classes inside K classroom…Not all of them did that, but they are certainly feeling the effects of not taking our warning!”
These challenges with serving younger four-year-olds in TK settings represent a significant need for age-appropriate infrastructure and teacher preparation to alleviate district stress with UPK implementation.
Supporting TK Student and Family Needs
Students with Disabilities
The California Master Plan for Early Learning and Care emphasizes including children with disabilities in CSPP and TK classrooms. The state has allocated LEAs additional funding—such as the Special Education Early Intervention Preschool grant—to provide appropriate interventions and services for children at risk of falling behind academically, including those with disabilities.
The districts we spoke to use a range of models—some offer TK and CSPP co-located, some offer CSPP at other locations, and others did not have CSPP contracts. Some were making a conscious choice to shift students with disabilities to TK. When increases left them understaffed to address the student caseload, they were able to sub-contract with the county where the children had been served previously. One district said that having a student identified with a disability in CSPP or Head Start made their parents more likely to want them in TK. Some districts told us that having students with disabilities start in TK might mean enhanced integration into the K–12 system for them.
A number of districts indicated that some special education teachers lack training and experience in working with pre-K-aged children. As discussed earlier, they shared that some teachers with less experience may have difficulty differentiating age-appropriate behavior from behavior that might benefit from an individualized educational plan (IEP). One noted:
We observed an increase in caseload for special education for preschool and TK students. We are behind with doing assessments and there is an increase in referrals for assessments. Specialists report that teachers do not have expertise with this young grade level and are struggling. The special education department is working hard to provide inclusion opportunities.
A rural district with limited access to special education teachers found that TK teachers might ask for a special education assessment very quickly after enrollment. But the district administrator questioned whether students needed an IEP or if there were environmental factors at play. This respondent also reported that moving from full- to half-day is making this task more challenging, because a longer day gave TK teachers more time to work with any struggling children. Another district considered whether to wait until kindergarten to conduct a formal special education assessment because TK staff lack the necessary training to understand the younger age group.
Dual Language Learners (DLL)
CDE’s survey of TK implementation found that 57 percent of TK programs offer English-only instruction with home language support, 16 percent have some home language instruction focus, and 27 percent offer no home language support (Wang et al. 2024).
When we spoke to district superintendents and TK administrators, we learned that districts offering one or more Dual Language Immersion (DLI) programs were popular with families—both those whose children are learning English and those whose children are learning the language of the DLI program. This did present a complication, at least for the current school year when not all four-year-olds are eligible for TK. Because children who must enroll directly in kindergarten do not have the opportunity to participate in DLI in TK, they may be behind those who do.
Many districts without robust DLL instruction noted that they believed the play-based focus of TK classrooms is conducive to learning English even without formerly identifying students for EL status. “Play-based is language-based. Our district is used to having a diverse population of language speakers. They are younger now but learn languages faster.” Friendships among children of multiple languages flourished even without a common language: “I don’t know how a [language obscured]-speaking student and a Spanish-speaking student and a Korean-speaking student become best friends the first day of school, but they do … the power of early education.”
In addition, many reported that while there might not be a formal curriculum, the second teacher in the classroom (often non-credentialled) spoke Spanish—the most common language among DLL in California’s schools. In a district with a small but growing population of DLL students, they were preparing proactively by hiring literacy intervention specialists and encouraging bilingual hires. And another district that recently saw increasing numbers of EL students described the school-level resources available for TK DLL students.
Starting in the 2024–25 school year, the English Language Proficiency Assessment of California (ELPAC) can no longer be given to TK students (Assembly Bill 2268) because it was designed for use with older children (kindergarten and above). In that year there will be no formal identification of TK children’s English Language Development status. We asked districts about the current school year without any screener in place. Most interviewees agreed with the new policy and reported that teachers will serve student needs with or without the assessment. One TK administrator elaborated that culturally affirming practices for DLL in TK are what children need, and that the DLL label resulting from the ELPAC test results would not help teachers provide it.
However, in at least one instance, there was some mild frustration from the teachers of DLL TK students because they felt “hindered” not being able to use the initial and summative ELPAC to measure student progress during the school year. Eliminating this tool may limit the identification of the need for services and could mean that districts miss out on an opportunity for LCFF funding.
Regardless of what is or is not provided for DLL TK students, our interviews with superintendents and TK administrators revealed that DLL children’s families may prefer to keep their young children home with “grandmas and grandpas.” In some more recent immigrant communities, families did not feel children under the age of six should be in formal schooling.
TK Enrollment Is Growing, but Participation Has Declined
Despite overall statewide enrollment decline, more children than ever are enrolled in California’s TK program (Figure 1). The first year of expanded eligibility (2022–23) saw over 115,000 children enrolled—a big increase over the pandemic school years. As eligibility expanded further in 2023–24, over 150,000 children enrolled. Nevertheless, TK enrollment levels are lower than originally projected due largely to decreased take-up rates (Melnick et al. 2022).
Dramatic enrollment increases since TK inception
Enrolled student count

SOURCE: California Department of Education (CDE) TK Census Day enrollment.
California is reaching a reasonable proportion of eligible children compared to universally available programs, which cluster around 60 to 70 percent of children participating (Stanford 2023). At this juncture, understanding take-up rate trends is critical. They reveal whether eligible families are accessing TK and can also help identify potential barriers to participation across different communities.
Since we have had the data to track it, TK take-up has always been at or above 70 percent—starting in its second year, when just 17 percent of four-year-olds were eligible (Figure 2). From 2014–15 through 2021–22, the share held steady at 25 percent. But participation increased from 71 to over 80 percent until the pandemic. During the year of remote instruction (2020–21) it declined to 70 percent.
Take-up recovered somewhat in 2021–2022 but did not keep pace in 2022–23 when more students were eligible. The most recent year saw many more students enrolled in TK, but take-up rates fell to those of the peak pandemic year and the earliest years of the program (70 percent). Once eligibility reaches 100 percent, it is unclear if rates will climb as they did during the steady period of eligibility from 2014–15 to 2019–20, or if current participation will persist.
TK take-up has fallen with expanding eligibility
State TK take-up rate (%)

SOURCE: California Department of Education (CDE) TK Census Day enrollment.
TK take-up rates vary throughout the state (Figure 3). Coastal Southern California has relatively high rates. These counties have large school districts. Some districts offer early TK where students too young for TK can participate. This accounts for a good deal of the entire state’s take-up rate. Rural counties in the north are a mix—some with high and some with far-below-average rates.
Wide variation in TK take-up across California

SOURCE: California Department of Education (CDE) TK Census Day enrollment.
NOTES: Map of counties with below 70 percent, the state average take-up, are red, while counties at or above the average take-up rate are blue. Map of districts includes only elementary and unified districts serving kindergarten students. Take up rates could exceed 100 percent because some districts offer TK to younger four-year-olds who are not yet eligible according to state guidelines.
Some Districts Use TK to Offset Declining Enrollment
Recent increases in TK enrollment have helped offset some of the state’s enrollment declines (Lafortune et al. 2024). Some districts report that TK is a part of their enrollment strategy. The hope is that through the TK program they are drawing at least some students into the district who would otherwise not have come, and will be able to keep them through 12th grade.
One district we interviewed reported that their rapid TK expansion was explicitly intended to stem the impact of declining enrollment. It allowed them to avoid layoffs by reassigning teachers from older grades to TK and kindergarten. Another has seen TK draw students in from neighboring districts—they are one of the few providing it in their rural county. Their program is going well, district test scores are rising, and families are bringing their TK and older students to the district. To accommodate more students, a district with space constraints switched from full- to half-day TK. This strategy increases their enrollment count and the size of their LCFF grant.
How Has Expansion Changed Which Children Participate?
California intends for TK to be universally available to four-year-olds by the 2025–26 school year. Though overall participation is currently 70 percent, TK may provide early education services for families who might otherwise struggle to access them. In this section we examine take-up rates by racial and ethnic group, as well as language, socioeconomic status, and special education needs.
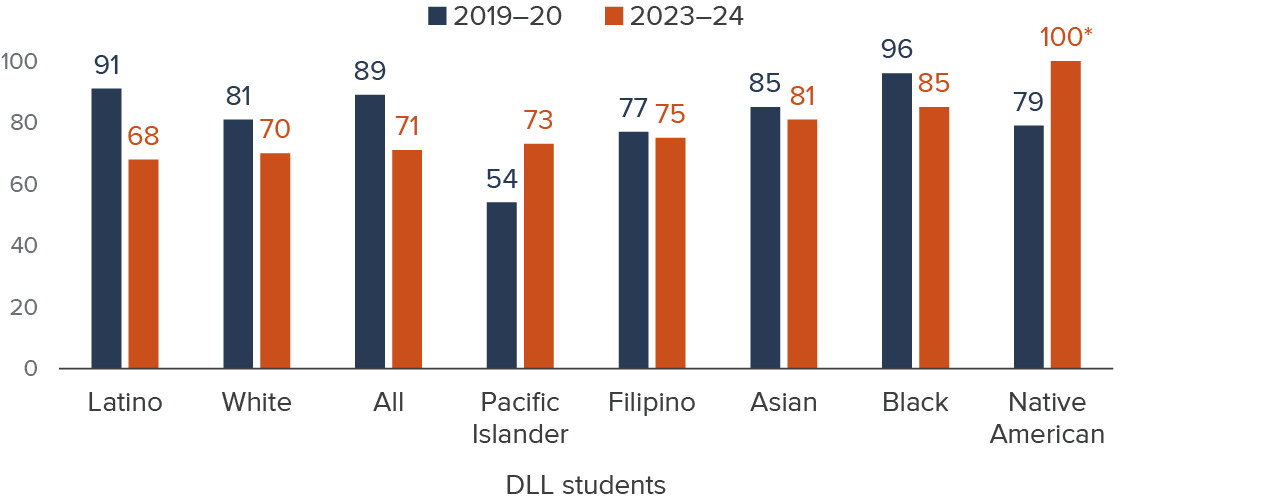
Prior to expansion, Native American, Black, and Pacific Islander children were the least likely of all four-year-olds to participate in TK. That remains true in 2023–24 (Figure 4). Comparing 2019–20 and 2023–24, overall take-up rates declined by 12 percentage points. Asian and Pacific Islander students saw little change, and declines were moderate for white and Filipino students. The largest drop was for Black and Latino students—16 percentage points. We find that children who are socioeconomically disadvantaged (SED, or those who receive free and reduced-price lunch) were about as likely as all children to participate (Figure 5). The 2023–24 school year was the first in which CDE released TK counts by special education status, so we cannot report changes in those rates over time, but at 73 percent it is higher than students overall.
Latino students show largest decline in take-up rates since pre-expansion peak
Take-up rates (%)
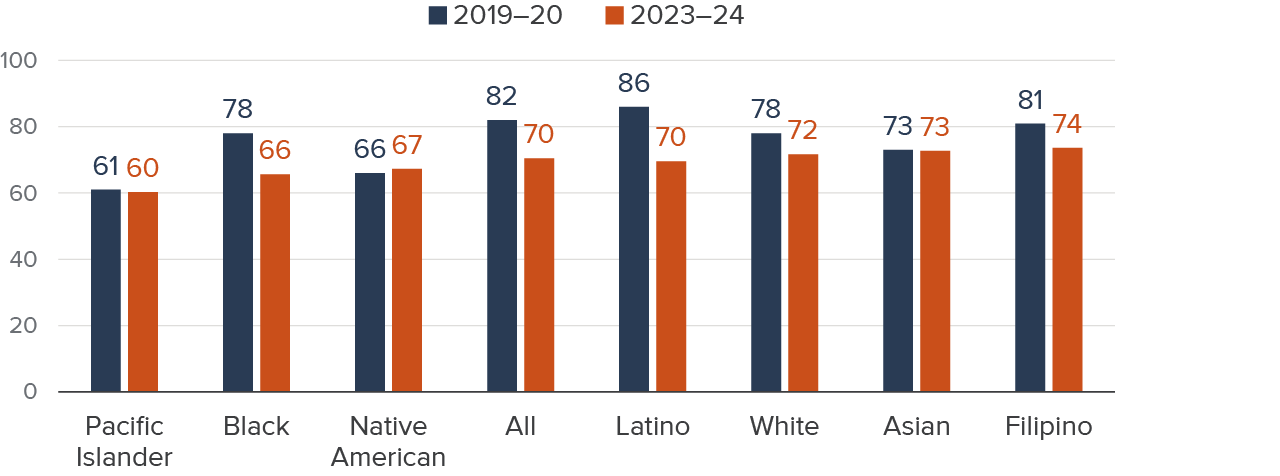
SOURCE: California DataQuest, Annual enrollment with ethnicity, 2019–20 and 2023–24.
NOTE: We use 2019–20 as our pre-expansion benchmark because most districts experienced pandemic-related declines in TK after 2019–20.
DLL children were more likely to participate in TK prior to the pandemic, but as Figure 5 shows, the rate declined dramatically from 89 to 51 percent (or 38 percentage points) from 2019–20 to 2020–21. We do not know why this happened, but some possibilities come to mind. Perhaps their families were less likely to enroll them in that year of mostly remote learning. Remote learning could also have made it difficult to identify DLL status. The assessment tool came on line during this time, but districts may not have focused on using it with the youngest of children. Indeed, CDE reports that in 2020–21, the language status of 15 percent of TK/K children was “TBD”— much higher than in the years that preceded (1.7 percent) and followed (1.5 percent). Now that school has returned to in-person learning, DLL take up-rates are below where they had been pre-pandemic (18 percentage points lower). Nevertheless, they are similar to those of all and children who are socioeconomically disadvantaged.
DLL children’s participation declined dramatically during the pandemic
TK take-up rates (%)
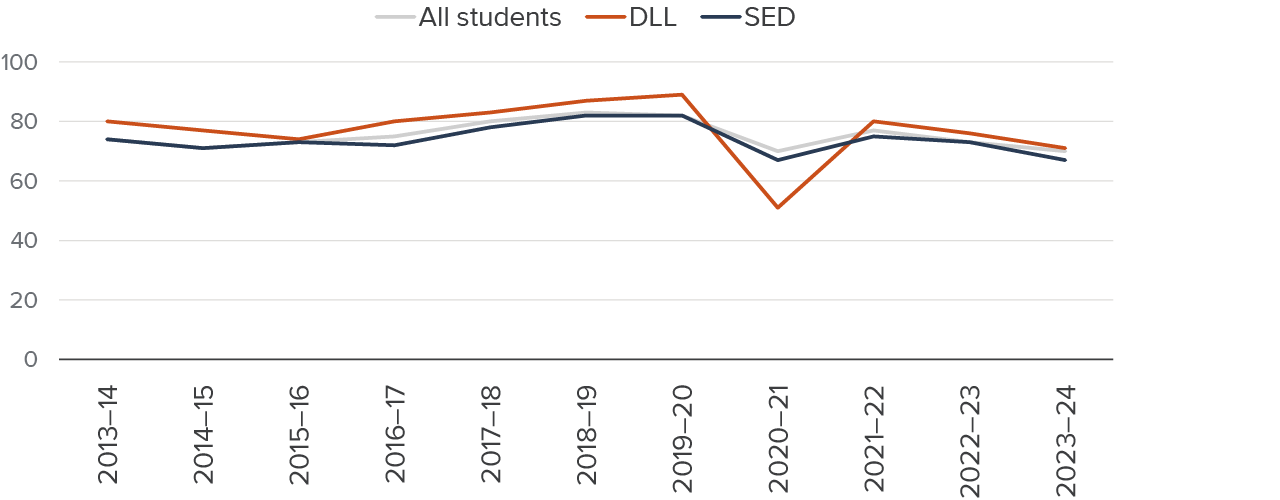
SOURCE: CDE TK and K Census Day enrollment.
NOTE: “SED” is based on proxy of student eligibility for free and reduced-price lunch.
Comparing pre-TK expansion to the current school year, the statewide decline in TK take-up was 7 percentage points for all children, 8 for children eligible for free and reduced-price meals, and 11 for DLLs. With its large district size, implementation of Early TK, and large share of DLL and low-income students, LAUSD’s numbers may influence these trends. Indeed, when we exclude LAUSD for DLL children, the decline in rates between 2019–20 and 2020–21 falls from 38 percentage points to 23 percentage points. (See Technical Appendix Figure B4.) LAUSD may also be driving our high take-up among low-income families. When we exclude LAUSD, take-up for children who are SED (64 percent) is lower than among all children (68 percent).
Latino children drive the average take-up rate for DLLs. They comprise the majority of DLL students—76 percent of DLL kindergarteners speak Spanish at home. Among these children, take-up is down 23 percentage points since before the pandemic—a dramatic hit (Figure 6). Native American and Pacific Islander DLLs are relatively few, so while their rates increased, this does not reflect a large change in the number of children served. Technical Appendix Figure B5 illustrates similar patterns for socioeconomically disadvantaged children by race/ethnicity.
Latino DLL take-up rates declined more than any DLL group
Take-up rates (%)
SOURCE: CDE’s DataQuest 2023–24 Annual enrollment data, DLL students.
NOTES: Native American DLL take-up rate exceeded 100 percent. There were 204 Native American DLL students in kindergarten (and we estimate 58%, or 118, were TK-eligible) and 121 Native American DLL students in TK in 2023–24. We use 2019–20 as our pre-expansion benchmark because most districts experienced pandemic-induced declines in TK after 2019–20.
The 2023–24 school year is the first in which CDE reports the disability status of TK children, so we cannot track it over time. As is the case among children from socioeconomically disadvantaged families, Native American and Pacific Islander students with disabilities are least likely of all those with disabilities to participate (Figure 7). Of course, the counts of these students are relatively small.
Pacific Islander and Native American children with disabilities have the lowest take-up rates
TK take-up rates (%)
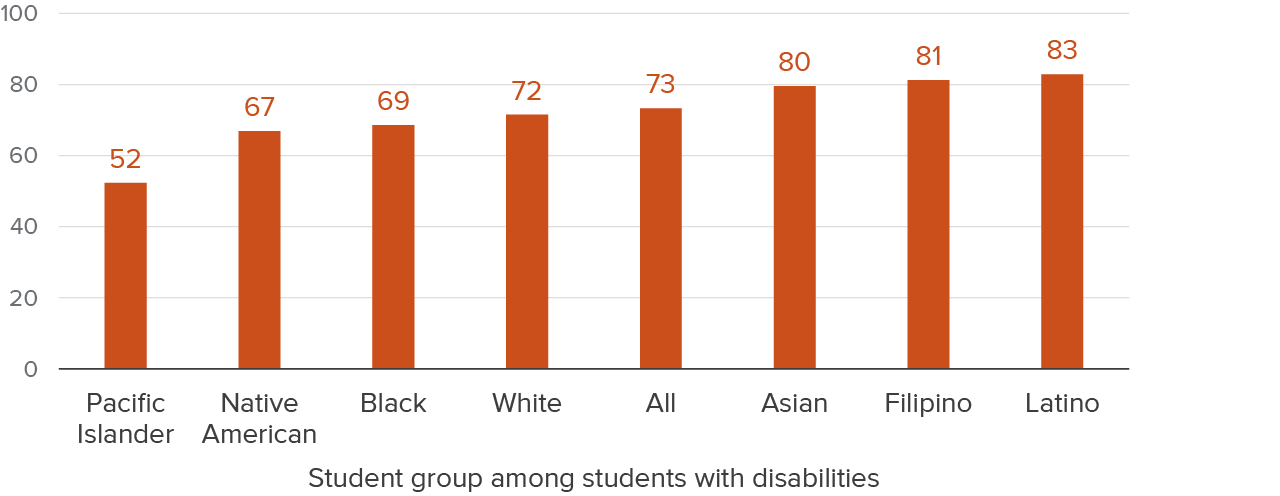
SOURCE: CDE’s DataQuest 2023–24 Annual enrollment data, students with disabilities.
NOTE: Pacific Islander students with disabilities numbered 44 in TK and 145 in kindergarten during 2023–24, while Native American students with disabilities totaled 66 in TK and 170 in kindergarten that same year.
Lack of Interest among Some Families
We were curious to learn if district staff interviewees were aware of the lower TK participation we observed among Black, Pacific Islander, and Native American families—and the steep declines among Latino families—since prior to the pandemic. Research has found that Latino parents are most likely of all California parents of children six and under to report that they “don’t know much about TK” (14 percent). The same is true for only 2 percent of white parents (Powell and Adejumo 2024). A survey conducted in 2022–23 with parents of children under the age of six found that moderate- and high-income families were much more likely to know about TK (91 percent) versus 62 percent of low-income families (RAPID-California Voices Project 2023).
As mentioned above, we heard that some families prefer to keep their younger children at home or in the care of grandparents or other close relatives. Some districts told us that Latino and Pacific Islander families sometimes find this alternative form of care from relatives more accommodating and welcoming compared to a structured TK program. One elaborated that these families are not enrolling their children in kindergarten either, or that they are experiencing high rates of chronic absenteeism.
One district administrator speculated that Native American families’ experience with the K–12 system may dissuade them from putting their child into non-mandatory TK programming. “… they don’t trust the system. This is a system that has failed them generationally.” A TK administrator echoed this sentiment:
Ostensibly UTK as a concept and as a program/initiative was rolled out because they believe it will help to address the opportunity gap. I think that’s interesting that they believe that schools are the answer to that when schools have never been the answer to Black and brown children’s education. So their answer is to give them more of what’s not working? That is deeply troubling for me.
When we asked districts about their recruitment efforts, we learned that targeting outreach to groups with low-take-up rate was rare except in one district, where it focused on low-income neighborhoods with low TK participation. In some districts, more affluent families were more likely to participate, while in others, these families are less likely than average to do so.
One district reported an increase in the population of families with unstable housing—a critical challenge for enrolling young children. To ease the transition to school for these children, they used the California Community Schools Partnership Grant to provide integrated wraparound services such as health care—including helping families receive required vaccinations. Two remote/rural districts told us their county is home to transient families that are established members of the community but do not send their children to the PK–12 system. These families may work in the area but are living in temporary non-standard housing.
This is a new phenomenon in these districts, and interviewees reported that families were fleeing higher costs of living in nearby counties. One district speculated that these families may not be sending their children to school out of fear. One described working to build trust with families through connection and community services, hoping they would enroll their children in schools.
What Drives District Variation?
Here, we attempt to understand more about what might explain district variation in take-up rates as well as differences among race/ethnic, socioeconomically disadvantaged students, and Dual Language Learners. We first report on participation among the 10 largest districts. Then we explore districts’ funding sources and characteristics as factors. Finally, we examine the role of access at local schools.
Prior to TK expansion, a number of school districts opted to provide TK to four-year-olds without eligible birthdays. LAUSD and San Diego Unified (SDUSD) were among those that had enrolled large numbers of such students, which drove up TK take-up numbers throughout the state. It also likely contributed to large take-up rates among DLL and Latino students because these two districts alone are responsible for serving 18 percent of DLL and Latino TK children statewide.
And it may have had a similar effect on the relatively high take-up rates among children from socioeconomically disadvantaged families. In 2023–24, take-up in SDUSD exceeded 100 percent (because younger four-year-olds not yet officially eligible for TK are included in the counts), and LAUSD was at 93 percent (Figure 8). Take-up in San Francisco Unified is the lowest among the state’s largest school districts, but San Francisco provided preschool to low-income families even before TK was available and continues to offer a range of options to families.
Districts that expanded TK early still have the highest take-up rates in 2023–24
District TK take-up rates for the top 10 largest districts (%)

SOURCE: California Department of Education (CDE) TK and Kindergarten Census Day enrollment.
NOTE: Take-up can exceed 100 percent if younger children have access to TK—as they do in some districts.
We find little variation in take-up between rural or high-poverty districts, or those with high Black, Latino, or DLL populations (see Technical Appendix Figure B6). However, districts with high shares of DLL students participate in TK more. At 68 percent, rural districts are slightly below the average district take-up rate (69 percent). Take-up is highest in districts where EL students make up at least one-quarter of all students (73 percent).
We explored if district demographic characteristics might help explain Latino and DLL take-up rates. (For our regression analyses, see Technical Appendix B.) Interestingly, we found no consistent differences between pre-expansion TK districts and those that only started offering it recently, nor differences among districts that are expanding more rapidly. Thus, which types of districts have expanded their offerings does not seem likely to be related to the lower take-up rates we observe among Latino, Pacific Islander, Native American, or Black families. This trend would benefit from more research.
Basic Aid Districts
Because Basic Aid districts do not receive funding through the state’s funding formula (LCFF) for each TK student, some have decided it is too expensive to provide. However, that does not relieve districts of their obligation to do so. But so far no penalties have been assessed for any districts (Basic Aid or not) failing to offer TK. Reporting on the question illustrates the tensions that some Basic Aid districts face. To fulfill the community’s desire for the extra year of schooling without any additional state funds would require districts to reduce program offerings for older students (Aguilera 2022). Moreover, some Basic Aid districts consider UPK an unfunded mandate (Jones and Yee 2024).
However, the share of both LCFF and Basic Aid districts offering TK has increased—and more dramatically among Basic Aid districts (Figure 9). Prior to the pandemic, fewer than two-thirds of Basic Aid districts provided TK and now 80 percent do. LCFF districts increased their provision by 7 percentage points, and now nearly 93 percent provide TK. Despite this progress, we estimate that of the eligible children residing in a district without TK, 55 percent live in a Basic Aid district. Below, we explore how Basic Aid districts decide whether to provide TK, and how many children might be losing access to TK because they reside in districts that do not offer it.
Districts funded through LCFF are more likely than Basic Aid district to provide TK
Share of districts providing TK (%)
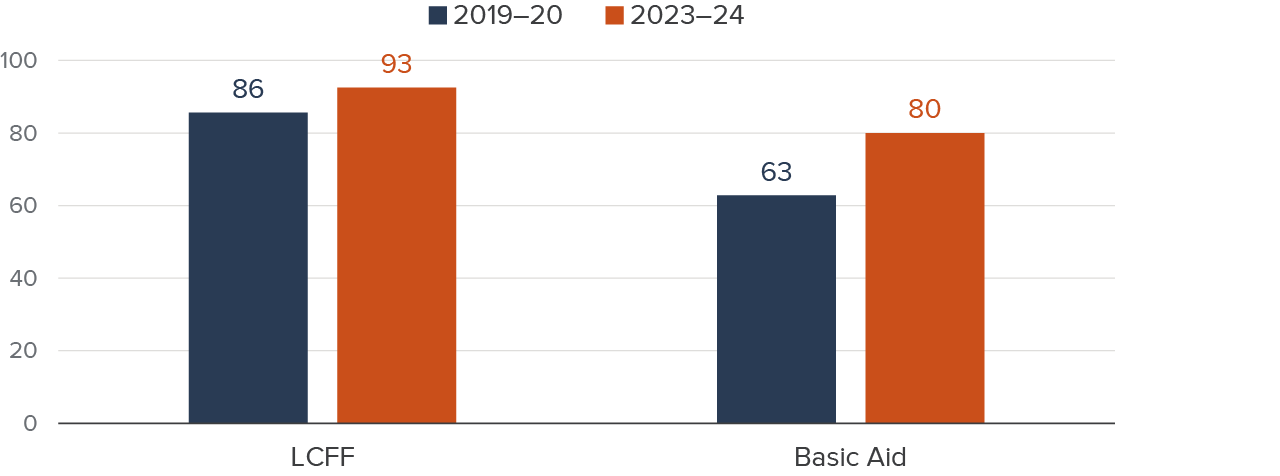
SOURCE: California Department of Education (CDE) TK and Kindergarten Census Day enrollment and Basic Aid status.
NOTE: We use 2019–20 as our pre-expansion benchmark because most districts experienced pandemic-induced declines in TK after 2019–20. We use Basic Aid status from 2022–23 school year for 2023–24.
We interviewed two Basic Aid districts that provide TK and two that do not. One Basic Aid district leader said it decided to offer TK because children were arriving to kindergarten unprepared. This leader had worked previously in a district with robust TK and early education options. They wanted to strengthen community offerings in their new district, despite its Basic Aid status. They noted: “[We have] child care that’s under-the-table care, taking care of our community kids, but they are not providing exploration of colors, numbers, skills like holding a pencil.” They also mentioned that providing TK without additional per-pupil funding was a challenge. Likewise, another district mentioned the importance of funding from a foundation to support a TK coordinator position.
The primary reasons for the two Basic Aid districts we spoke to not providing TK was the required additional expense of preparing facilities and employing additional staff. Both reported that their communities had robust private preschool options and that children were arriving in their district academically ready for kindergarten (although less behaviorally ready post-pandemic). And while both districts had seriously considered starting a TK program, they have determined the economic impacts on their budgets were not worth it. Even so, they revisit the decision regularly.
In one of these districts, the superintendent has found a way to provide TK for families that want it. While they had LCFF, a neighboring district with TK accepted the Basic Aid district’s children into their program. When that district’s property tax revenue increased enough to move them out of LCFF status, they were no longer interested in receiving overflow TK children. In those years, the superintendent was able to find a nearby charter school that accepted the TK children for a fee. The superintendent reports regularly reevaluating whether it is the right time to offer TK, and that the district is in regular conversation with the community preschool options, as that would impact these businesses.
One district reported that when TK expansion was announced, it became clear there were no fiscal consequences for not offering it, and that the state had passed up an opportunity to tighten Ed Code to require it. One district pointed out that some Basic Aid districts just barely miss qualifying for LCFF. They balance on the edge, moving in out of Basic Aid status from year to year. These districts may switch back and forth between offering TK, which was the case for his district. Another district superintendent described balancing on the edge between LCCF and Basic Aid as follows:
We’re seeing you know, a couple of districts in [ County] that are Basic Aid have announced that they’re reducing or eliminating their program. We’ve seen reductions in programs here in [County] just because of the cost aspect of it.
This same superintendent understood that sympathy from the state for Basic Aid districts “is probably hard to come by,” but argued that perhaps districts that move between Basic Aid and LCFF status could provide a more stable program if there was additional state funding. This instability makes it hard for families to plan. However, without any enforceable requirements from the state, the issue is unlikely to change.
What are the potential consequences for families if Basic Aid districts do not provide TK? While Basic Aid districts have high property values, not all families living there have high incomes. Approximately a third of TK families in Basic Aid districts are SED (Figure 10). We estimate that 19 percent of eligible students in Basic Aid districts without TK are SED.
About one-third of enrolled Basic Aid TK students are socioeconomically disadvantaged
Share of enrolled TK students (%)
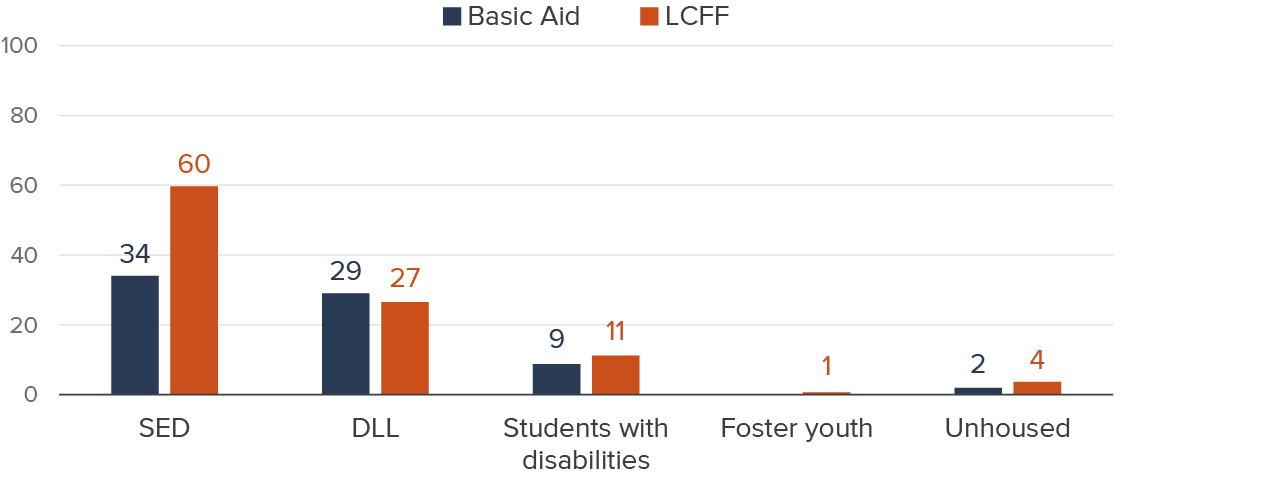
SOURCE: California Department of Education (CDE) 2023–24 TK and Kindergarten Census Day enrollment.
The Basic Aid districts providing TK have done so largely because they aimed to serve the needs of families—they thought most could benefit from a free year of preschool education to increase kindergarten readiness. In the two Basic Aid districts we spoke to that are not providing TK, the majority of children do participate in other paid options for preschool or child care prior to kindergarten. Few would be eligible for subsidized care or CSPP. But these private preschool options are expensive, and in one of the two districts, this presented a hardship for a few families. Some districts have taken a different approach, for example offering TK with limited slots—prioritizing students in high-need student groups such as foster youth, unhoused youth, and low-income students.
Does School Access Explain Participation?
Although all districts with kindergarten programming are required to offer TK, they have the flexibility to choose which schools will provide it. While California aims for universal access to TK by 2025–26, not all districts are able to guarantee it to all eligible four-year-olds. As mentioned above, districts have experienced challenges with locating adequate space and facilities to accommodate additional TK classes at all schools (Staveley and Thornton 2024). According to our take-up estimates based on public school enrollment, approximately 74,000 children were eligible for TK but not enrolled at their neighborhood schools in the 2023–24 school year. How much of this appears related to school access?
Since TK expansion began, the number of children who seem to lack access because it isn’t provided at their district or school has declined dramatically. We estimate that in 2023–24, 63 percent of children who are eligible but not enrolled have TK at their school, compared to 31 percent in 2019–20 (Figure 11). In 2023–24, only 4 percent of unenrolled children did not have TK in their district, compared to 8 percent in 2019–20.
Most eligible, unenrolled children are near a school that offers TK

SOURCE: California Department of Education (CDE) TK and Kindergarten Census Day enrollment.
NOTE: We use 2019–20 as our pre-expansion benchmark because most districts experienced pandemic-induced declines in TK after 2019–20.
TK school and district access varies by district characteristics. Eligible but not enrolled children in Basic Aid districts appear more likely not to be enrolled because they lack convenient access: 29 percent are in a district with no TK, 33 percent in a district with TK that is not at a nearby school, and 39 percent do have TK at their school (Figure 12).
Unenrolled four-year-old children in Basic Aid Districts are those least likely to have it offered at their district
Share of students at district type (%)
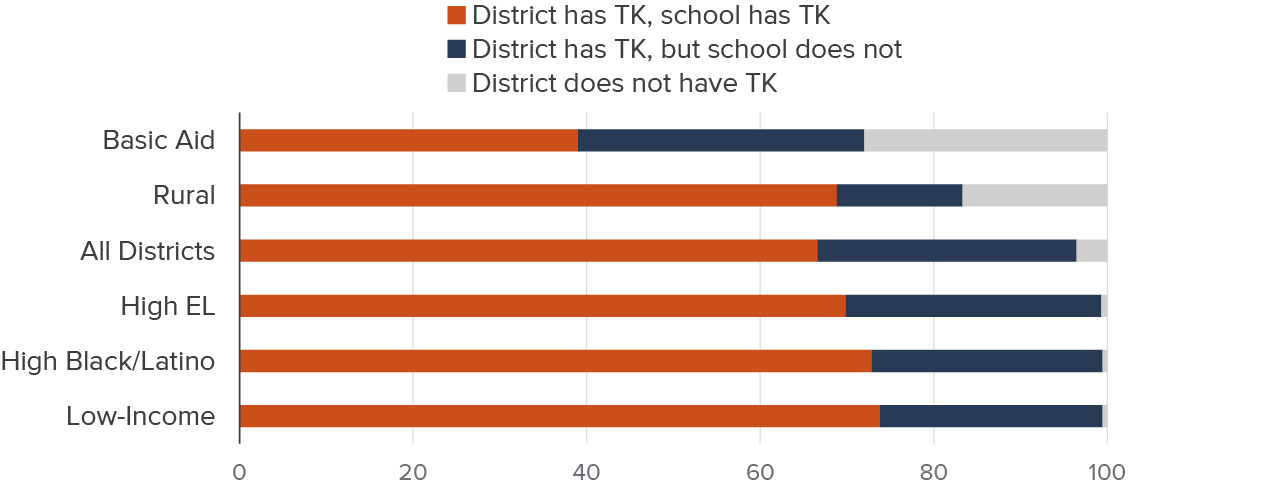
SOURCE: California Department of Education (CDE) 2023–24 TK and Kindergarten Census Day enrollment.
NOTE: We define Rural as located in a rural area (National Center for Education Statistics definition), High EL as 25 percent or more of the students are EL/DLL, High Black/Latino as 75 percent or more of the students are Black or Latino, and Low-income as 75 percent or more of the students are eligible for free or reduced-price meals.
Children in rural districts who are eligible for TK but not enrolled are quite likely to have it at their school (69 percent), but many of these are single-school districts. Seventeen percent of these districts do not offer TK. Unenrolled children in high EL, high Black/Latino, and high low-income districts almost universally have access in their districts—fewer than 1 percent do not.
What about participation when TK is offered at school? In all cases, participation is higher than the state average (Figure 13). When TK is offered at a child’s school, participation rates are 10 percentage points higher (80%) than TK participation overall. However, residing in a neighborhood where families can access TK does not close gaps in take-up rates between Black, Latino, Pacific Islander, and Native American children and those for white, Asian, and Filipino families.
Take-up rates are higher when TK is offered at a child’s school
TK take-up rate (%)
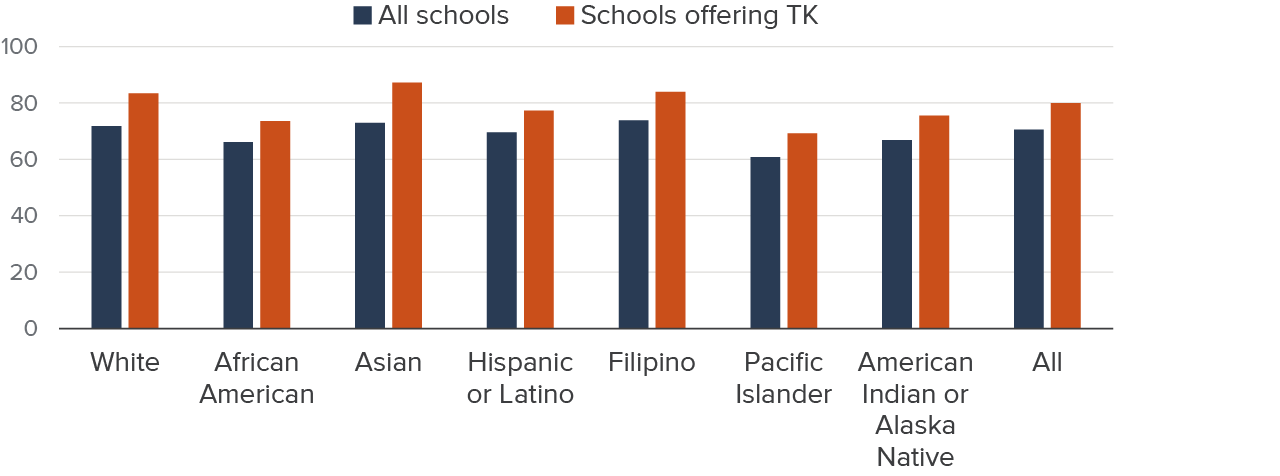
SOURCE: California Department of Education (CDE) 2023–24 TK Census Day enrollment.
NOTES: Our estimates of TK take-up at the school level may overestimate the number of birthdate-eligible TK students because some students whose neighborhood school does not offer TK will attend at a different district school; it may also underestimate the number of birthdate-eligible TK students since some districts offer TK to an expanded group of four-year-olds.
Conclusions and Implications for Further Expansion
California’s Master Plan for Early Childhood Education aims to create a universally accessible and high-quality program in the K–12 system that will prepare children for elementary school. TK has grown dramatically since the pandemic and the start of expansion in 2022. More children are enrolling as more become eligible, partially helping to offset enrollment declines across the state. However, take-up rates have not yet returned to pre-pandemic levels despite the efforts of many districts to increase and improve their offerings.
In the summer of 2024, some schools were fined because they did not have the appropriate staffing ratio in their TK classrooms. However, districts that do not offer TK at all have not been fined or penalized despite legal requirements to do so. Currently, there is no mechanism for incentivizing or penalizing Basic Aid districts that opt not to provide TK.
In the 2024–25 school year, TK children speaking a language other than English at home will not be identified for EL services with the state’s EL assessment tool. Some district administrators were happy with this development, but at least one reported her dual language immersion teachers were not happy to have lost the only tool they had to measure their students’ progress. According to the CDE’s survey and echoed in our interviews, the most common EL support is English instruction, with home language support. However, many interviewees reported myriad ways in which the play-based curriculum and having two teachers in the classroom (often one who spoke Spanish) helped children develop English language skills. It will be important to understand if losing access to the assessment tool hinders English language development in the TK year.
For many years, Black, Pacific Islander, and Native American children were less likely to participate in TK than their white and Asian peers. And since the pandemic, the same is true for Latino children. These lower take-up rates do not appear to be because these families are less likely to live in communities where TK is offered or expanding. Interviews with district administrators suggested that some communities may be reluctant to enroll children so young in the K–12 system due to a lack of trust. This report has not surfaced all the issues that may be keeping families from enrolling. However, as TK increasingly lives up to its promise as a universally available, high-quality, and free option, gaps in kindergarten readiness may widen between those who participate and those who do not.
Given that enrolling their children in TK is optional for families, the current 70 percent take-up rate may reflect their preferences for the care of their four-year-olds. Families consider a variety of factors when deciding on early childhood education options—including programmatic learning environment, availability and duration of childcare, location, and curriculum. We observe that fewer unenrolled children live in districts or schools without TK, and thus most of the children eligible but not enrolled are likely explained by their families making other choices rather than lacking access. For UTK to be successful, families must have clear, accessible information about local TK programs, including where it is offered and eligibility requirements.
To truly understand both the need for and impact of TK, it is essential to have integrated data on the other types of care available (including the capacity) in local markets. In our conversations with districts, they were keenly aware of the tensions between TK and the other ECE/childcare options (e.g., CSPP, Head Start, and subsidized/private childcare providers).
We observed that while many districts have identified challenges to integrating increasingly younger four-year-olds into their school settings, they are all focused on improving the TK curriculum, staff training, and physical settings. The evolution of a more fully play-based curriculum—with teaching staff who are increasingly prepared and committed to administering it—may draw in more families over time.
Topics
Immigrants in California K–12 EducationLearn More

Enrollment Growth in Transitional Kindergarten Partially Offset Broader Declines

Transitional Kindergarten in California, Explained

California’s Changing Child Care Landscape

Experts Discuss California’s Transitional Kindergarten Expansion

Californians Support Universal Preschool, but Take-up of Transitional Kindergarten Is Uneven

Setting the Stage for Universal Preschool
