Key Takeaways
In California, counties that have adopted the Voter’s Choice Act (VCA) have in-person voting options that are consolidated into fewer and larger “vote centers” available to any voter in the county. While much about the VCA is convenient, changes to in-person voting tend to place the typical voter farther from their nearest voting location.
This report extends earlier PPIC work that showed lower turnout among Latino and Black voters in the wake of the VCA; here, we examine newer data and explore potential causes for the decline. We come to a number of conclusions:
- Turnout patterns differ between recent midterm and presidential elections. Between the 2018 and 2022 midterms, turnout declined statewide (14%), but more so in counties that switched to the VCA (15.5%). The opposite was true between the 2020 and 2024 presidential elections: turnout was slightly better (0.9%) in counties that switched to the VCA.
- Turnout did not consistently improve or worsen for any racial or ethnic group. Switching to the VCA appears to have hurt turnout among Latino voters in 2022 and among Black voters in 2024.
- Patterns are mirrored in young voters. New young voters ages 18 or 19 turned out at lower rates in VCA-switching counties in 2022, and at higher rates in 2024. Turnout fell most among Latinos in 2022 and increased most for white/other voters in 2024.
- Distance to the nearest voting location has mixed effects on voter turnout. For the two elections for which we have data, the relationship between distance and turnout was generally flat, and if anything turnout was somewhat higher at the farthest distances.
- Experience with voting can shape these effects. Latino voters with a history of voting in person were much less likely to vote in 2022 under VCA-switching counties, while Asian American and Latino voters with an in-person history were somewhat more likely to vote in 2024. Black voters with a more irregular turnout history were much less likely to vote under VCA-switching counties in 2024.
- There are few signs that turnout improves as voters get more experience with the VCA. In fact, counties that implemented earlier often had lower turnout than those that implemented more recently.
The effects of the VCA have generally fallen short of the reform’s original goal of a larger and more representative electorate. At the same time, evidence is limited that the distance to voting sites makes much difference to participation in California, perhaps because every voter already has a mail ballot to fall back on should the in-person options prove too distant. While this does not mean that any distance would have the same effect, it ought to inform discussions about the density and siting of in-person locations moving forward. The findings highlight the need for more research into messaging, the effect of the local context, and the VCA experiences of Latino and Black voters in particular.
The Voter’s Choice Act
California has made a number of changes to the way elections are conducted over the last decade in an effort to elevate turnout and bring more voters of color and young people into the electorate. In 2016, the state passed the Voter’s Choice Act (VCA), a reform intended, among other things, to increase turnout by making voting easier and more convenient. The reform brought the “Colorado model” of elections to California, copying what had been tried first in the Centennial state. The California Legislature did not mandate the VCA, but rather permitted each county to adopt it if they chose. However, any county implementing the VCA was required to take a series of steps as part of the transition:
- Mailing all voters a vote-by-mail ballot by default.
- Replacing traditional neighborhood polling places with a smaller number of professionally-staffed “vote centers” available to any voter in the county.
- Making a minimum number of early voting sites available starting 10 days before election day, followed by still more early voting sites 3 days before. The minimum number varied by the registered population of the county (see text box).
- Making a minimum number of unstaffed drop boxes available starting 28 days before election day.
- Forming advisory committees on language access and voting accessibility to ensure communication with and responsiveness to the needs of foreign language voters and voters with disabilities during the transition to the new system.
- Submitting a detailed plan for voter outreach and education to the Secretary of State for approval.
Lawmakers hoped the VCA would increase overall turnout while improving participation for voters of color and young people in particular. Indeed, safeguards to ensure equitable participation are woven throughout the text of the law (see text box). The Secretary of State has been required to report on the voter experience in VCA counties after every election, and to specifically break out each statistic by race, ethnicity, age, and a range of other characteristics.
The rollout of the VCA has been staggered. Five counties started to use it in the first available election in 2018; 10 more followed in 2020, 12 in 2022, and 2 in 2024 (Figure 1). The 29 counties now using the VCA comprise 78 percent of the state’s registered voters. Most of the largest counties in the state now use the system, including all but three counties in the Bay Area (Contra Costa, San Francisco, and Solano) and one county in Southern California (San Bernardino). The VCA has rapidly shifted from a small-scale experiment to the dominant method of voting in California.
Some aspects of the VCA are no longer exceptional. To limit in-person voting during the COVID-19 pandemic, the state mailed every voter a vote-by-mail ballot regardless whether their county had adopted the VCA or not. This practice was made permanent through AB 37 in 2021. Thus, a county’s decision to switch to the VCA is now primarily a question of in-person voting options, since the vote-by-mail requirement already applies everywhere.
The VCA is also part of a large number of voting reforms that have been passed and implemented in the last 15 years. These include an automatic voter registration system that strongly encourages voter registration at the Department of Motor Vehicles; the effective end of registration deadlines through “conditional registration,” which makes it possible to register up to and including on Election Day; and a “pre-registration” option that allows 16- and 17-year-olds to add a dormant record to the voter file that activates upon turning 18. While all these reforms ultimately aim to increase voter turnout, the VCA is the most prominent reform that specifically targets voter turnout, as opposed to the registration process that precedes it.
Voter’s Choice Act counties now cover many parts of the state and most voters
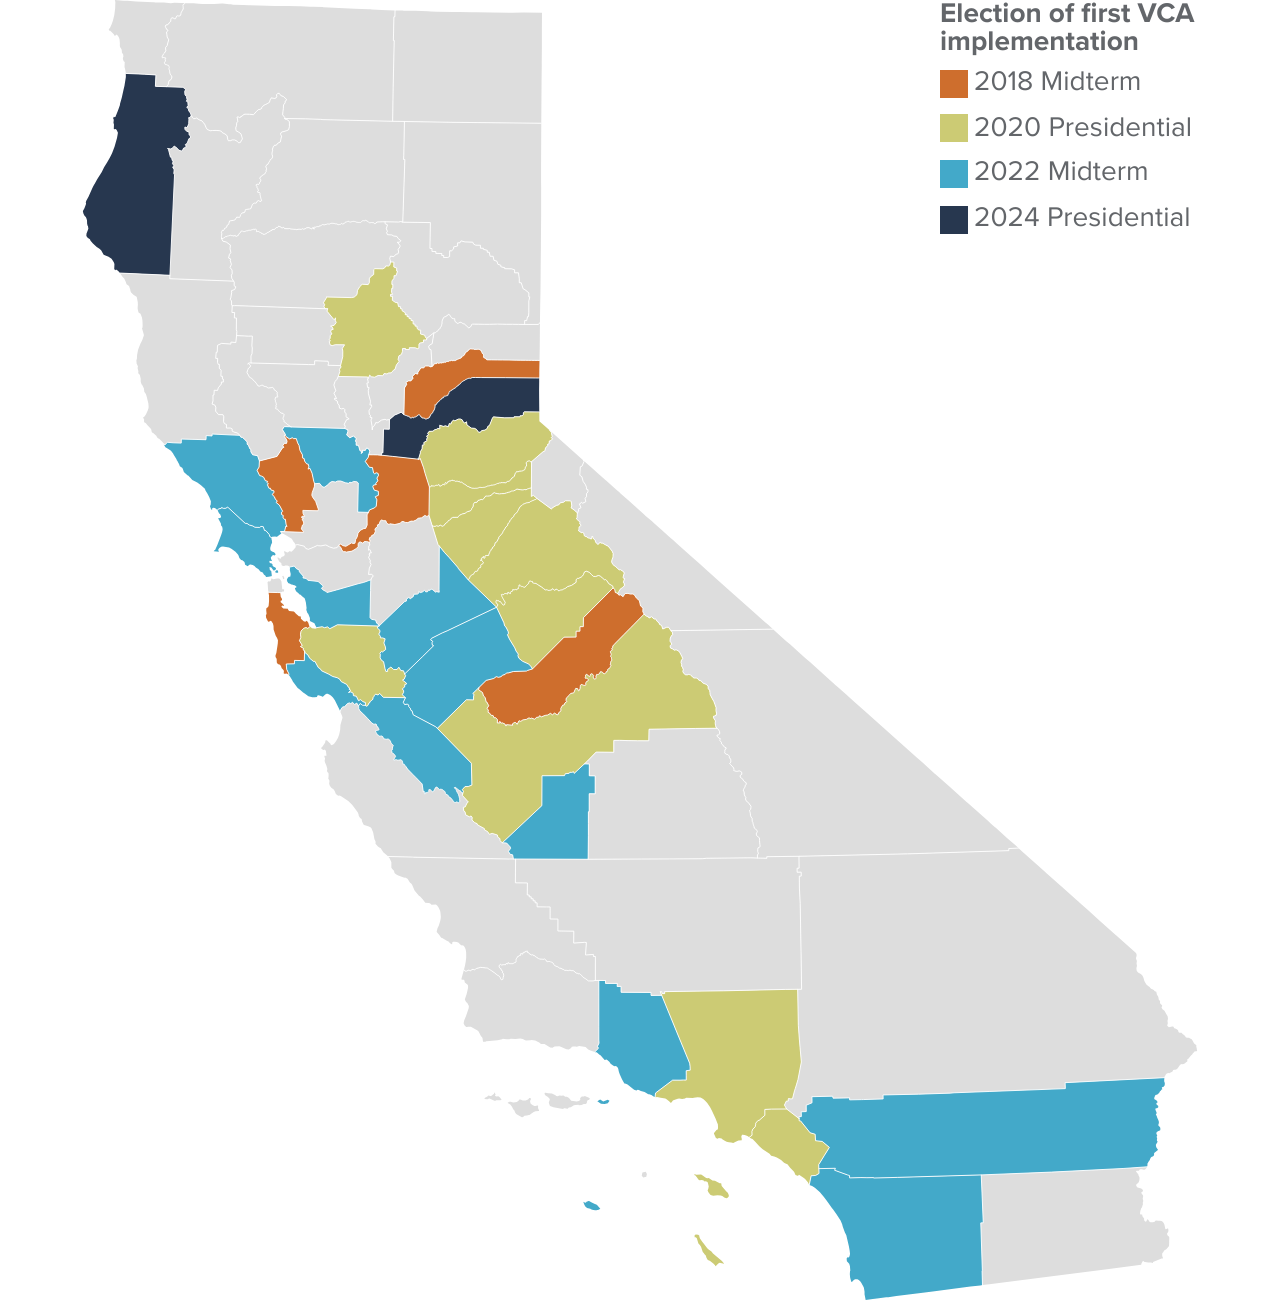
SOURCE: California Secretary of State.
The VCA made in-person voting flexible but farther away
In terms of likely effects on turnout, the VCA’s changes to in-person voting options are a mixed bag. In several ways, the VCA is more convenient. It breaks the connection between a voter’s residence and voting location because voters can go to any in-person location they like within their county. Voters can choose a location near work, school, shopping areas, or any other place they might visit outside of their residential communities. VCA counties also offer a far more extensive network of early voting sites and drop boxes than found in traditional polling place counties.
However, the VCA does limit the number of in-person sites compared to the traditional model. And there is no guarantee that one of these sites will be in a voter’s neighborhood. For voters used to going to their neighborhood voting location, the shift might be disorienting. Earlier PPIC work (McGhee, et al. 2022) found that the VCA lowered turnout for Black and Latino voters during the pandemic election of 2020. Research has shown that voters of color are particularly likely to prefer voting in person; that is, a change to in-person voting options has a greater effect on these voters (Meier and Romero 2024).
Figure 2 shows that the distance in miles to the nearest voting location—whether drop box or vote center—increased between the 2018 and 2022 midterms in every county switching to the VCA between those two elections. The increases were about a quarter of a mile on average, though considerably more in a few small rural counties.
Between the 2018 and 2022 midterm elections, distances to the nearest in-person voting location increased in VCA counties
Change in median distance (miles)
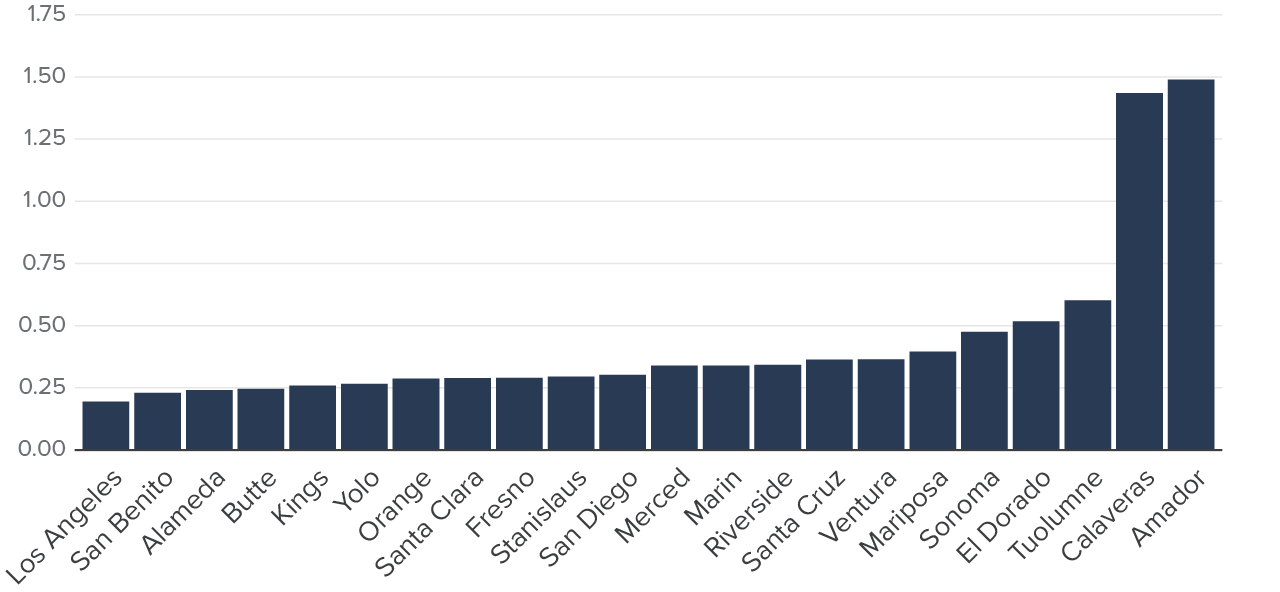
SOURCE: Political Data, Inc voter file, 2018; VoteCal voter file, 2022
NOTE: Plot includes the counties that implemented the VCA after 2018, omitting the five original VCA counties (Madera, Napa, Nevada, Sacramento, and San Mateo) that did not switch between these elections.
Over the same period, distances to voting sites have increased in some counties with the traditional system and decreased in others, although most of these changes were quite limited (Figure 3). It is worth noting that VCA counties have generally over-complied with the density requirements for both vote centers and drop boxes (see Figures A1 and A2 in the technical appendix). Thus, the greater distances are likely an unavoidable consequence of the consolidation itself.
In non-VCA counties, distances to the nearest in-person voting location have not consistently changed between 2018 and 2022
Change in median distance (miles)
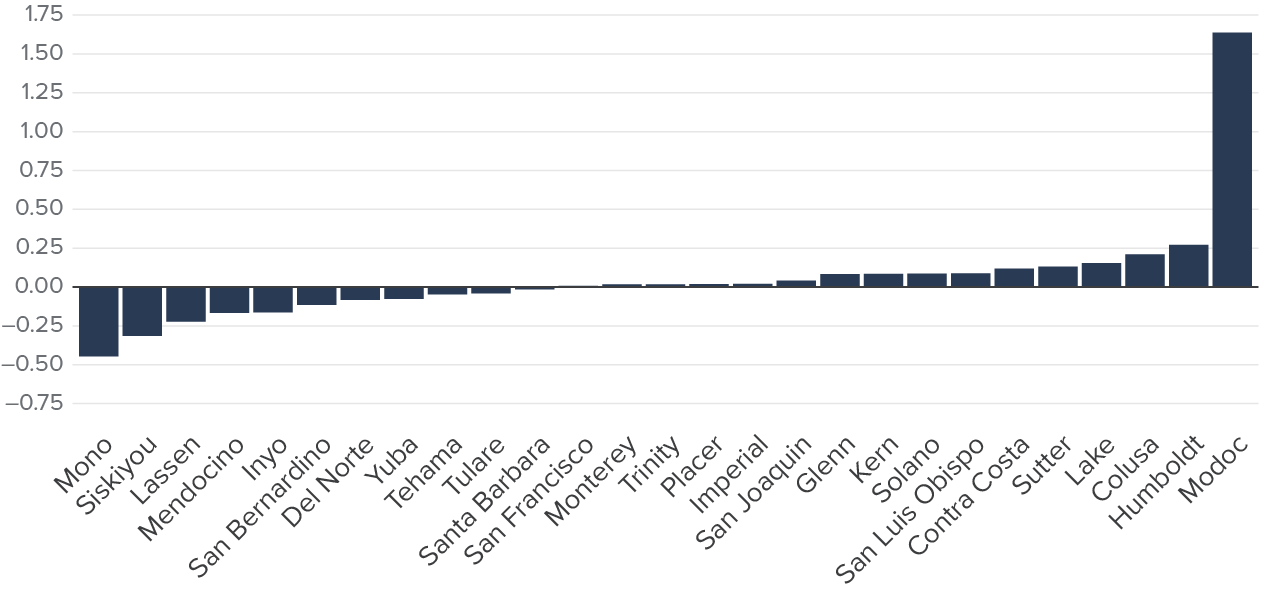
SOURCE: Political Data, Inc voter file, 2018; VoteCal voter file, 2022
NOTE: Plot includes the counties that did not implement the VCA by the 2022 election.
Research on the siting of in-person voting locations generally finds that moving voting locations farther away leads to lower participation at those sites, on the order of 2 percent to 5 percent (Bitzer, et al. 2023; Cantoni 2020; Clinton, et al. 2021). Likewise, participation tends to go up as the density of alternative methods like early voting and drop boxes increases (Kaplan and Yuan 2024; Lou et al. 2020). These effects tend to be larger among voters of color and in midterm or primary elections as opposed to presidential contests. Such findings are consistent with the PPIC results for California in the 2020 election.
At the same time, research has shown that such effects on participation are often counteracted if those who find themselves farther from their nearest voting location replace in-person voting with other forms, particularly voting by mail. This substitution effect can sometimes completely undo the effects around in-person voting, leaving no meaningful change in turnout at all. Moreover, this existing research was conducted in the context of traditional voting systems, so its conclusions might not apply to the VCA. While the VCA does limit in-person options, it also increases voting flexibility in the ways described above. As such, the VCA reform may increase turnout rather than decreasing it. Accordingly, the remainder of this report explores the evidence for a VCA effect with data from recent elections.
The VCA’s Effect on Turnout
The most direct way to understand the effect of the VCA is to compare turnout among the same registered voters before and after they voted under the VCA system to voters who voted under the same system in both elections. We look at changes in voting over time between elections of the same type, by comparing 2018 to 2022—both midterm elections with no presidential candidate on the ballot—and 2020 to 2024—both elections where the president was on the ballot.
It is safest to compare elections of the same type in this way, since the turnout dynamics of midterm and presidential elections are very different. Many voters will consistently vote in presidential contests amid the intense media coverage and excitement of the race, but they may vote in midterms only if the cost of voting is low or they receive concerted outreach to participate.
For our analysis, we start with voters registered in the state at both points in time—what we call “continuing” voters. Then we move to young voters who are new to voting in each election. Our analysis always looks at individual voters, and the consequence of changing the voting system they experience from a traditional system to the VCA.
Because the pandemic led the state to mail all voters a ballot in every county, comparing change in the VCA-switching counties to change in control counties isolates the effect of the shifting in-person options. To facilitate this comparison, when comparing 2018 and 2022 we mostly drop the five counties that adopted the VCA in 2018, since they had already switched to all vote-by-mail before the rest of the state made the change. By contrast, when we compare 2020 and 2024, we include all the counties because the entire state was all vote-by-mail over that period.
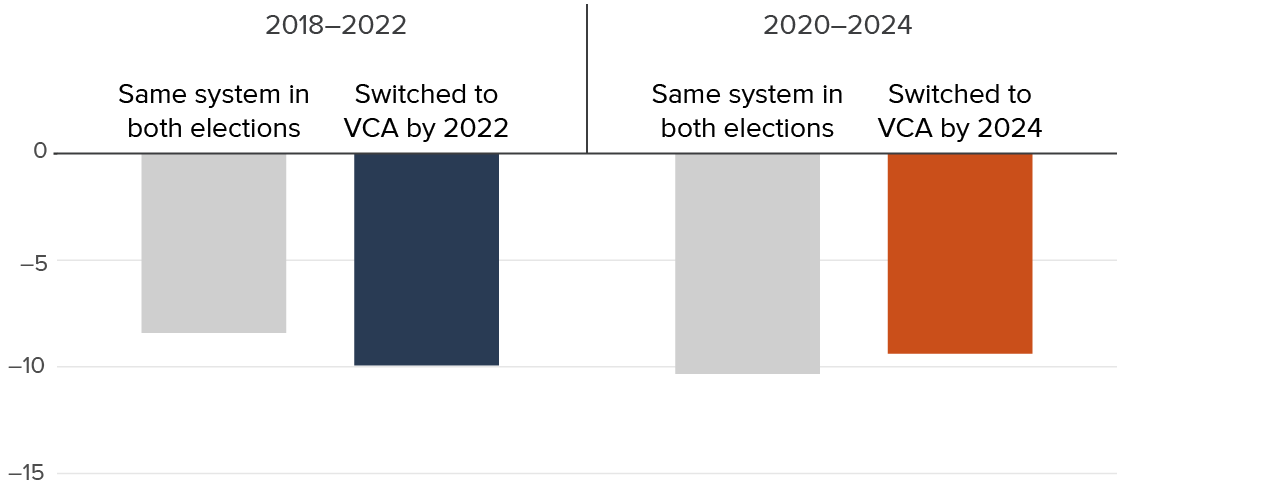
Turnout declined among all registered voters by about 14 percentage points (pp) between 2018 and 2022 and about 9 pp between 2020 and 2024, so we should expect some decline among voters in both VCA-switching and control counties in both cases. The question is whether the decline was larger or smaller among voters who started using the VCA. (See text box for more details.)
What was the overall effect of the VCA on voter turnout?
Between the 2018 midterm and the 2022 midterm, the drop in voter turnout was about 1.5 pp larger in counties that switched to the VCA, suggesting a negative effect of the reform. However, the pattern was reversed between the 2020 and 2024 presidential elections: turnout fell by 0.9 pp less in counties that switched to the VCA, suggesting a positive effect (Figure 4).
The drop in turnout for VCA counties was larger in the 2022 midterm but smaller in the 2024 presidential election
Turnout change (%)
SOURCE: Political Data, Inc voter file, 2018 and 2020; VoteCal voter file, 2022 and 2024
NOTE: Bars represent the average shift in turnout among individual voters between 2018 and 2022 and between 2020 and 2024. The five counties that were already using the VCA in 2018 (Madera, Napa, Nevada, Sacramento, and San Mateo) have been omitted from the top plot but not the bottom.
What was the effect on turnout among racial and ethnic groups?
The effects on voter turnout were limited for most racial and ethnic groups in either election year (Figure 5). For most groups, turnout fell more with the 2022 midterm and improved with the 2024 presidential election, but by far less than even a single percentage point. However, Latino voters saw a more substantial decline in 2022 (–3.0 pp) while Blacks voters saw one in 2024 (–1.7 pp).
We tested all these differences with panel regression models. The results were virtually identical in every case. These results are in Tables A1 and A2 of the technical appendix.
The VCA negatively affected Latinos in 2022 and Blacks in 2024, but other groups did marginally better
Turnout change (%)

SOURCE: Political Data, Inc voter file, 2018 and 2020; VoteCal voter file, 2022 and 2024
NOTE: Bars represent the average shift in turnout among individual voters between 2018 and 2022 and between 2020 and 2024. The five counties that were already using the VCA in 2018 (Madera, Napa, Nevada, Sacramento, and San Mateo) have been omitted from the top plot but not the bottom.
Do new voters react differently?
By comparing the same voters over time, the plots above help isolate the direct effects of the VCA while controlling for many other explanations for the patterns, such as differences in the types of voters who are in VCA-switching and control counties. But an analysis of this kind is only possible for individuals who are registered to vote in both general elections—either 2018 and 2022, or 2020 and 2024. This experience with voting might make them less responsive to changes in the voting process because they already have the habit of voting, or more responsive because they expect to vote in the way that they always have before.
A significant group of new voters is young people who have recently turned 18 and become eligible to vote. Young voters have been an important focus of voting reform efforts in California. By limiting the analysis to 18- and 19-year-olds, we can also ensure that we are looking at a group that has never before voted in a fall general election and so has limited experience with the voting process.
The patterns for these new voters are almost identical to those for continuing voters (Figure 6): the VCA had a negative effect on turnout in 2022 and a positive effect in 2024.
New young voters struggled with the VCA in 2022 but not in 2024
Turnout change (%)

SOURCE: Political Data, Inc voter file, 2018 and 2020; VoteCal voter file, 2022 and 2024
NOTE: Points represent the aggregate shift in turnout between 2018 and 2022, and between 2020 and 2024, among voters aged 18 or 19. The five counties that were already using the VCA in 2018 (Madera, Napa, Nevada, Sacramento, and San Mateo) have been omitted from the plot of 2018 and 2022 data.
What was the VCA effect for new voters by race/ethnicity?
The patterns within racial and ethnic groups for new voters (Figure 7) also look similar to overall turnout, with lower turnout in 2022 for young Latino voters in VCA-switching counties and for young Black voters in such counties in 2024. However, because these are new voters, we are not looking at the same people in both elections, and the results might reflect shifts in the number of voters from different counties who end up in the analysis. To take that into consideration, we ran regression models that account for any variation across counties in characteristics that might be correlated with adoption of the VCA but are not caused by it. These models confirm lower turnout for young Latino voters in 2022 but show a slight improvement in turnout for young Black voters in 2024, as well as a slight decline for young Asian American voters in the same year (Tables A3 and A4 in the Technical Appendix).
Turnout was lower in VCA-switching counties for young Latino voters in 2022 and young Black voters in 2024
Turnout change (%)

SOURCE: Political Data, Inc voter file, 2018 and 2020; VoteCal voter file, 2022 and 2024
NOTE: Points represent the aggregate shift in turnout between 2018 and 2022, and between 2020 and 2024, among voters aged 18 or 19. The five counties that were already using the VCA in 2018 (Madera, Napa, Nevada, Sacramento, and San Mateo) have been omitted from the plot of 2018 and 2022 data.
Distance to In-Person Voting
VCA counties consolidated their in-person voting options into fewer and larger vote centers available to any voter in the county, while also adding more drop boxes; these changes tended to place the typical voter farther from their nearest voting location though in most counties the change was quite small (less than ½ mile). We were able to obtain in-person voting locations only for the 2018 and 2022 elections, so this portion of the analysis is limited to these election years. The distance to the nearest voting location had mixed effects on voter turnout.
How did distance to voting location affect overall turnout?
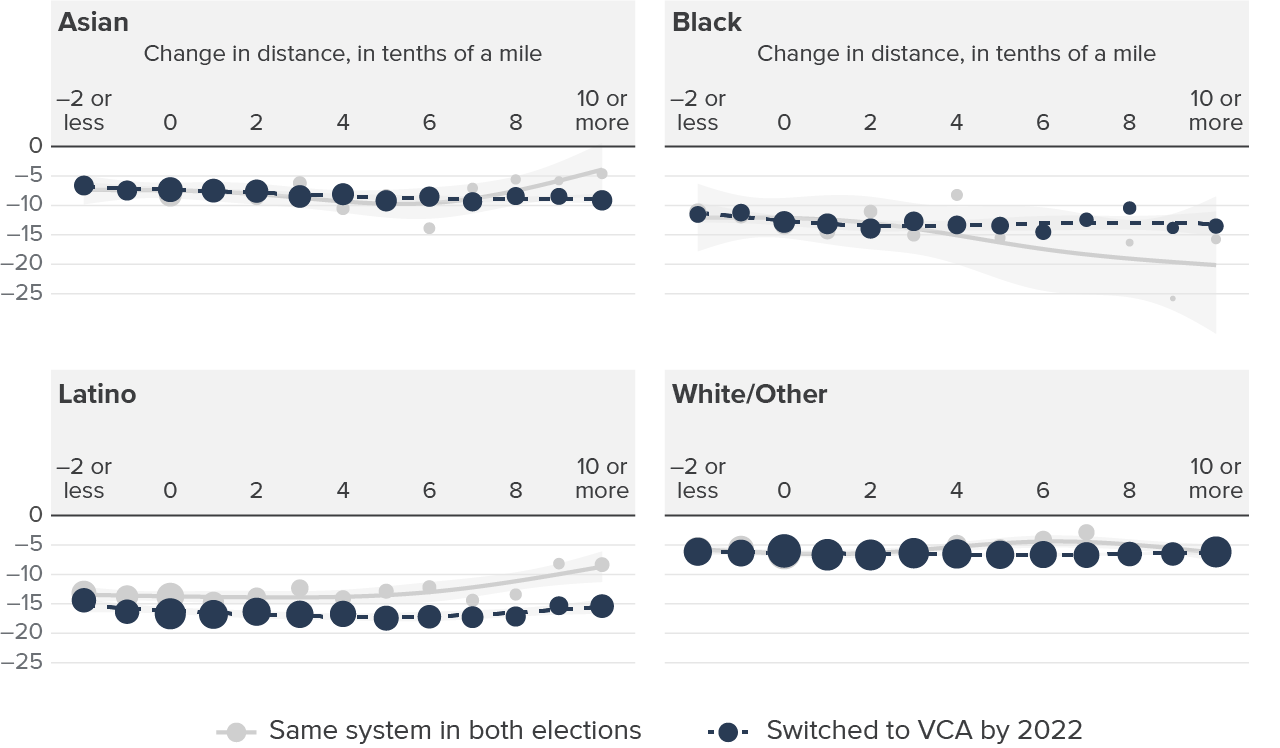
In our analysis of continuing voters, we calculated the straight-line distance to the nearest polling place, vote center, or drop box for each voter; then we calculated how these distances changed from the first election to the second. If distance were an impediment to voting we would expect the lines in Figure 8 to slope down and to the right as turnout fell with a greater increase in distance. Instead turnout held relatively steady: the lines are mostly flat, showing that the change in distance did not change turnout much—if anything they rise very slightly at the farthest distances. And the gap between VCA and non-VCA counties also closed slightly for the farthest distances, after expanding in the medium range.
Distance to nearest voting location had only a modest effect on turnout
Turnout change, 2022–2018 (%)

SOURCE: Political Data, Inc voter file, 2018; VoteCal voter file, 2022
NOTE: Points represent the average shift in turnout among individual voters between 2018 and 2022, separately by each binned change in distance from the nearest voting location. The lines represent a natural spline fit with three degrees of freedom. Size of points reflects the number of voters at that binned distance and type of county. The shaded grey areas are 95% confidence intervals for the spline fit. The five counties that were already using the VCA in 2018 (Madera, Napa, Nevada, Sacramento, and San Mateo) have been omitted.
This flat relationship is broadly the same within each racial and ethnic group (Figure 9). Counties that did not switch to VCA had some variation in turnout by distance: most notably, at the very farthest distances in 2022, turnout improved among Latinos in these control counties. At the farther distances, turnout fell among Black voters from the same year.
Our panel data regressions suggest some differences from the plots. Turnout declined for Latino and Asian American voters in 2022 for closer distances in control counties, with a largely flat relationship otherwise. Turnout also fell for Black voters in 2022 for closer distances, but in VCA-switching counties instead of control counties. (See Table A5 in the technical appendix.)
The effect of distance to voting on turnout varies some by race/ethnicity, but it is mostly small
Turnout change, 2022–2018 (%)
SOURCE: Political Data, Inc voter file, 2018 and 2020; VoteCal voter file, 2022 and 2024
NOTE: Points represent the average shift in turnout among individual voters between 2018 and 2022, separately by each binned change in distance from the nearest voting location. The lines represent a natural spline fit with three degrees of freedom. The size of the points reflects the square root of the number of voters at that binned distance and type of county, to reflect the statistical uncertainty of the data point. The shaded grey areas are 95% confidence intervals for the spline fit. The five counties that were already using the VCA in 2018 (Madera, Napa, Nevada, Sacramento, and San Mateo) have been omitted. Race and ethnicity are imputed at the block level using the WRU package for R, version 1.0.1.
How did distance to a voting site affect new young voters?
It is more complicated to analyze the effect of distance for our young voters. Because they are new to voting by definition (i.e., they are ages 18 or 19), we cannot calculate changes in their distance to the nearest location since the last election. Instead, we must be content with looking at changes in turnout for the same age group at the same distance between the two elections, knowing they are different people. This makes the distance more a contextual factor that conditions the size of the change. Even if distance to in-person voting lowers turnout for these voters, the change in turnout between the two elections might be the same across all distances. The question instead is whether being closer to an in-person location mitigated the broader factors that led to turnout declines for all voters.
Figure 10 shows that the pattern is very similar among new young voters. Turnout is 2 to 3 pp lower in VCA counties among this group, and as before, turnout appears higher in both groups as distance to voting increases.
Distance to in-person voting did not impact young voters in 2022
Turnout change, 2022–2018 (%)

SOURCE: Political Data, Inc voter file, 2018 and 2020; VoteCal voter file, 2022 and 2024
NOTE: Points represent the aggregate shift in turnout between 2018 and 2022 among voters aged 18 or 19, separately by each binned distance from the nearest voting location. The lines represent a natural spline fit with three degrees of freedom. The size of the points reflects the square root of the number of voters at that binned distance and type of county, to reflect the statistical uncertainty of the data point. Blue points are voters in counties that were not VCA counties in the first year but became VCA counties by the second. The grey points are voters in counties that never switched to the VCA. The shaded grey areas are 95% confidence intervals for the spline fit. The five counties that were already using the VCA in 2018 (Madera, Napa, Nevada, Sacramento, and San Mateo)have been omitted.
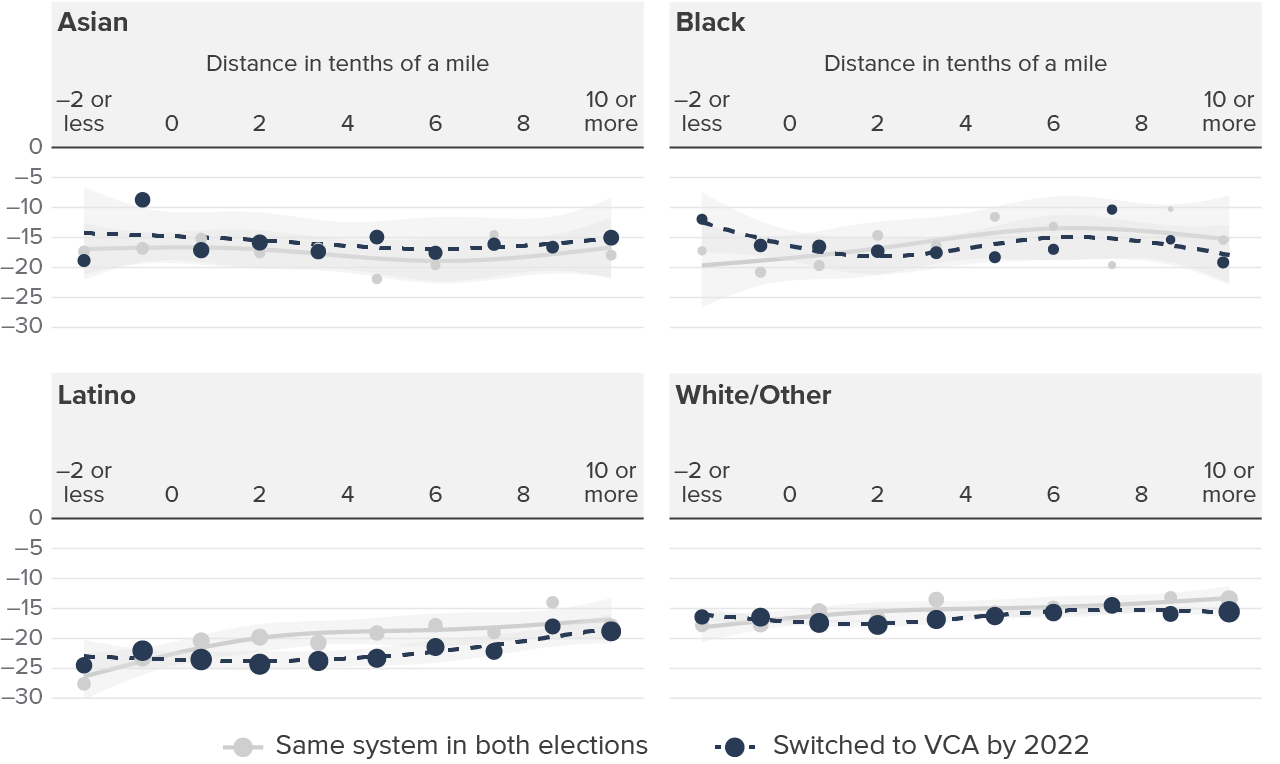
The same pattern is visible when broken out by race and ethnicity (Figure 11), though the drop in turnout with greater distance is strongest for Latino voters, at least at medium distances.
Our regression models that account for differences between counties were able to look more directly at the relationship between distance and turnout (Table A12 in the appendix). In both elections, turnout tends to increase with greater distance in control counties, at least for distances up to the median (about half a mile). In VCA-switching counties, Asian Americans closer than the median distance also see their turnout decline the farther out they get. For every type of county and every election, distances above the median have little relationship with turnout.
For youth voters, the impact of distance on turnout in new VCA counties was small across racial and ethnic groups
Turnout change 2022–2018 (%)
SOURCE: Political Data, Inc voter file, 2018; VoteCal voter file, 2022
NOTE: Points represent the aggregate shift in turnout between 2018 and 2022 among voters aged 18 or 19, separately by each binned distance from the nearest voting location. The lines represent a natural spline fit with three degrees of freedom. The size of the points reflects the square root of the number of voters at that binned distance and type of county, to reflect the statistical uncertainty of the data point. The shaded grey areas are 95% confidence intervals for the spline fit. The five counties that were already using the VCA in 2018 (Madera, Napa, Nevada, Sacramento, and San Mateo) have been omitted.
Other Explanations for Low Turnout
If the VCA is sometimes leading to lower turnout, especially among Latino voters in the midterm elections, it is important to understand the mechanism behind this effect if we can. The analysis above already casts some doubt on distance to the nearest voting location as a meaningful factor, which suggests the cause is likely to be something about the act of switching to the VCA by itself. The VCA, as a new method of voting, may be confusing or disruptive.
Testing the effect of disruption on voting
One way of testing whether the act of switching methods may have a role in lowering turnout is to compare the effect of the VCA between voters experiencing different levels of disruption.
Voters with a history of voting by mail before either the VCA or universally mailed ballots should be less confused and dislocated than those with less voting experience overall or those who had voted at polling places. The mail voters were able to mail in their ballots both before and after the switch to the VCA or the adoption of universal vote-by-mail.
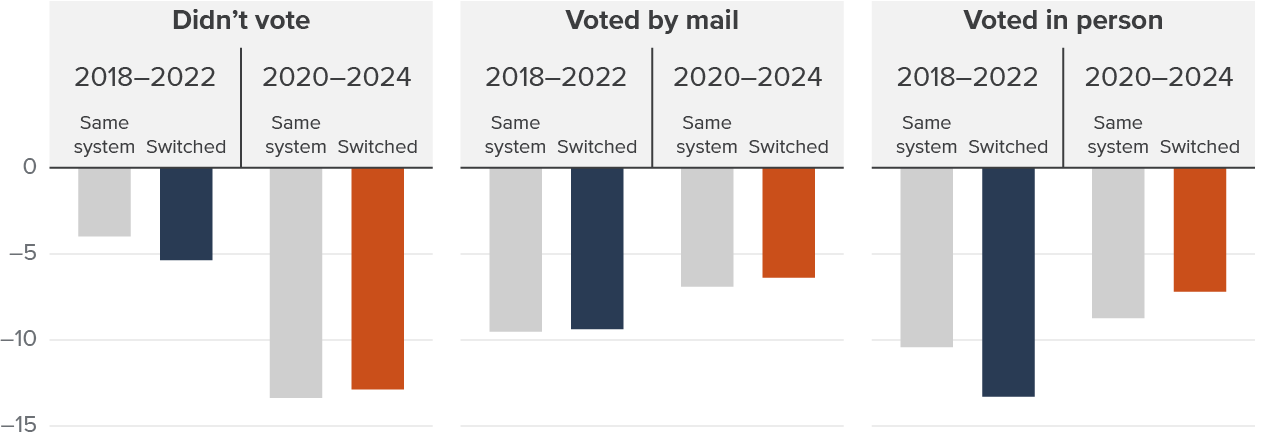
Figure 12 shows the plot from Figure 4 earlier, this time separating the results by voting behavior in the election year before the first year in each pair: 2016 for the 2018 and 2022 midterm elections, and 2018 for the 2020 and 2024 presidential elections. Voting behavior is divided into those who did not vote, those who voted by mail, and those who voted in person. This gives a sense of who experienced the most and least change based on their past engagement.
In the midterm elections, there is almost no difference in turnout between VCA-switching and control counties among those who voted by mail, but far more substantial differences among the other two groups. The largest and most consistent differences fall among those who previously voted in person. On average, turnout dropped 3.2 pp for in-person voters in VCA-switching counties, compared to 1.3 pp for previous nonvoters and just 0.2 pp for mail voters. While in-person voters had voting experience to fall back on, that experience differed from the new status quo, possibly contributing to confusion.
As before, the picture is very different for the presidential elections. Among previous nonvoters and vote-by-mail voters, turnout is about the same in VCA-switching and control counties. And for previous in-person voters, turnout is actually somewhat higher in VCA-switching counties, in stark contrast to the lower turnout in the midterms.
In the midterms, in-person voters and infrequent voters had the largest drop in turnout in VCA-switching counties.
Turnout change (%)
SOURCE: Political Data, Inc voter file, 2018; VoteCal voter file, 2022
NOTE: Points represent the average shift in turnout between 2018 and 2022 among individual voters, separately by each binned distance from the nearest voting location and voting method history. Voting method history is based on voting experience in 2016. Analysis is restricted to those 24 or older who had the opportunity to vote in 2016 (but may or may not have been registered for that election). The lines represent a natural spline fit with three degrees of freedom. The size of the points reflects the square root of the number of voters at that binned distance and type of county, to reflect the statistical uncertainty of the data point. The five counties that were already using the VCA in 2018 (Madera, Napa, Nevada, Sacramento, and San Mateo) have been omitted.
Figure 13 shows the average decline by voting experience and race. Most differences between VCA-switching and control counties are small, but there are some notable exceptions.
Among Latino voters, turnout dropped most in VCA-switching counties for prior nonvoters and in-person voters in the midterm elections. But Latino turnout improved a modest amount with prior in-person voters in the presidential elections. Black voters show few differences in the midterms but a notable drop in turnout among prior nonvoters in presidential elections. All of these results are largely confirmed in panel data models (see Tables A13 through A22 of the Appendix).
We also explored separating Latino and Asian American voters by language preference to see if those with less proficiency in English struggled more. The results are largely the same, though foreign-language Latino voters do struggle somewhat more in the midterms, and foreign-language Asian Americans in presidential elections (see Tables A10 and A11 in the Technical Appendix). The same is true when we further break down language preference by earlier voting method. Thus most of the decline in turnout in VCA-switching counties emerges from something other than language preference, even though there are some effects related to that factor.
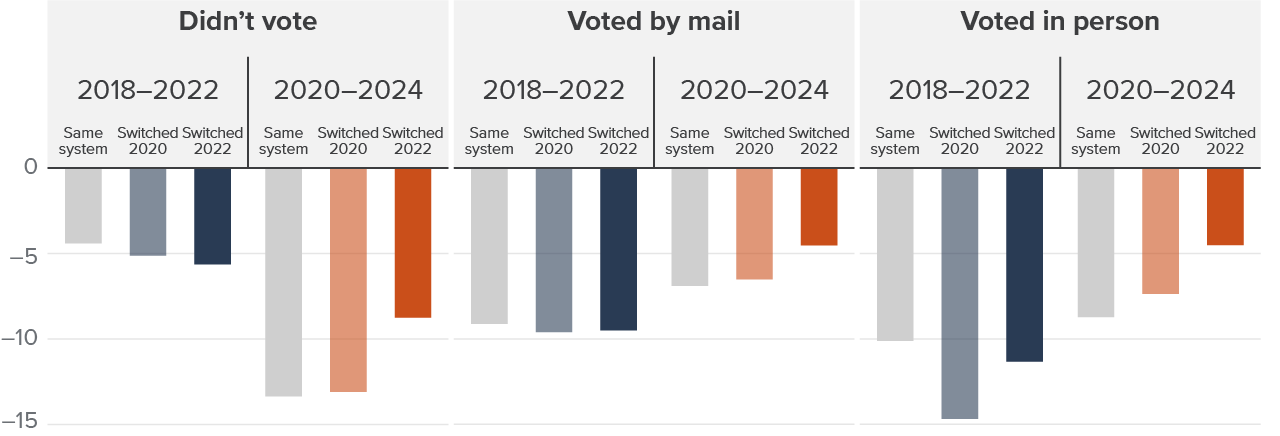
For prior in-person voters, Latinos had the largest decline in turnout in VCA-switching counties
Turnout change (%)

SOURCE: Political Data, Inc voter file, 2018 and 2020; VoteCal voter file, 2022 and 2024
NOTE: Bars represent the average shift in turnout between 2018 and 2022 among individual voters, separately by voting method history. Voting method history is based on voting experience in 2016. Analysis is restricted to those 24 or older who had the opportunity to vote in 2016 (but may or may not have been registered for that election). The five counties that were already using the VCA in 2018 (Madera, Napa, Nevada, Sacramento, and San Mateo)have been omitted.
Do voters learn to navigate the VCA as they spend more time with it?
If voters who had voted in person found something confusing or difficult about the transition to the VCA, their turnout might improve with more experience under the new system. If so, counties that implemented the VCA earlier might see better turnout than those that implemented later.
The data offer little support for this idea (Figure 14). In both the midterm and the presidential elections, observed turnout fell more in earlier adopting counties. It is worth being somewhat cautious about the results for counties adopting in 2024, since only two counties switched that year—Humboldt and Placer—and idiosyncrasies of either might strongly shape the results. But on its face, the pattern is inconsistent with greater learning over time.
Among Latino voters in the midterms, turnout fell more for those who had experience voting in person in counties that switched in 2020. Beyond this exception, the overall patterns in Figure 14 look broadly similar within each racial group. In our regression models, Latino voters in the midterms have the largest turnout decline of any racial or ethnic group, and this holds regardless of the length of experience with the VCA (see Tables A6 through A9 in the technical appendix).
Turnout often declined most in counties with more experience under the VCA
Turnout change (%)
SOURCE: Political Data, Inc voter file, 2018; VoteCal voter file, 2022
NOTE: Bars represent the average shift in turnout between 2018 and 2022 among individual Latino voters, separately by voting method history and year of implementation. Voting method history is based on voting experience in 2016. Analysis is restricted to those 24 or older who had the opportunity to vote in 2016 (but may or may not have been registered for that election). Implementation is based on the year the VCA county actually used the new VCA system. Counties that implemented the VCA in 2018 and those that have no in-person voting (Alpine, Plumas, and Sierra) have been omitted.
Since Latino voters generally had the largest drop in turnout of any group, we also break out Latino turnout by individual county in the Technical Appendix (Figure A3). We can confirm that in counties that have never implemented the VCA, turnout tends to decline the least between either the two midterms or the two presidential elections. Moreover, some of the biggest drops in turnout for Latino voters across both sets of elections are in those counties that switched in 2022 in particular.
Nonetheless, there is also a fair amount of variation. In several counties that implemented in 2020—Butte, El Dorado, Fresno, and to a lesser extent, Santa Clara—Latino voters had a relatively small drop in turnout in 2022, while a never-VCA county—San Joaquin—had the largest drop in Latino voter turnout of all counties in 2024. In fact, among the cohort of counties implementing in 2020, the largest declines in Latino turnout in 2022 were in the two counties with the most voters: Los Angeles and Orange.
Conclusion
The Voter’s Choice Act was designed to ease voting and facilitate turnout, but so far the effects have been mixed: sometimes slightly better turnout, sometimes little effect, and sometimes sharply worse turnout. The lower turnout has been concentrated among Latinos and in recent midterm rather than presidential elections.
There are few signs that voters become more acclimated to the system over time, as the turnout decline is not necessarily smaller in counties that have used the VCA system longer. And while the VCA reform places in-person voting locations farther away from voters on average, distance to the nearest voting location bears little relationship to the turnout decline. Universal vote-by-mail voting may minimize the effect of distance by allowing voters to substitute mailed ballots when the burden of in-person voting gets too onerous.
While there are some signs of lower turnout in both 2022 and 2024, the notably larger declines in 2022 deserve some attention. It is always possible that something unusual about the two elections led to the pattern; only time can tell if the VCA voters always struggle more with midterms. However, the excitement of presidential elections may motivate voters to push through any challenges they confront in a way that they are less willing to do in a midterm election. The fact that the midterm-presidential difference is especially notable among young people—who are just learning how to engage with the political system—fits with this explanation.
These results point to a number of policy and research implications.
First, the voter experience under the VCA needs to be better understood, especially the experience among Latino voters. The fact that declines are sometimes concentrated among new voters and voters with a demonstrated preference for voting in person suggests that something about the VCA system may be confusing for those who experience the biggest change under this new system. Targeted communication to these voters in particular would likely help alleviate some of this confusion. More detailed research on the preferences and experiences of these voters could also help zero in on messages that are most informative.
Second, the absence of a clear relationship between turnout and the distance to voting suggests that more or better in-person siting may not improve turnout declines. While evidence suggests that distance has generally hurt turnout in other states and election years, it may play a smaller role in a state like California where every voter receives a ballot in the mail by default. Likewise, early voting and drop box sites are far more readily available in VCA counties, and yet turnout is sometimes lower.
Third, and finally, turnout declines vary a great deal across counties in between elections. This decline makes it clear that more than the VCA is at work. While we have worked to ensure that any such factors do not explain away our estimates of the VCA effect, they may still independently affect turnout. More important to this report, they may condition the VCA effects. VCA effects may be larger or smaller among, for example, different communities or different education or income levels. Given some of the declines in Latino turnout in the large-population Los Angeles and Orange Counties, these counties might deserve special focus. These are all worthy topics of future research.
Some important caveats apply to these conclusions.
Apart from Latino voters in the midterm elections, the effects of the VCA on turnout overall or on turnout equity are small. In most cases the issue is less that the VCA lowers turnout and more that it doesn’t lead to the large turnout increases that were expected from the reform.
Moreover, all of the results presented here are embedded within the broader shift to mailing every voter in the state a ballot. In contrast to the in-person changes of the VCA, mailing all voters a ballot has boosted turnout and improved equity (McGhee, et al. 2022). But the state is now all vote-by-mail in every county, whether VCA or not. That renders the change invisible to the particular analysis conducted here. As a consequence, the results of this report concern only the VCA’s changes to in-person voting and should not be construed to suggest a problem with all vote-by-mail.
The state has been extraordinarily ambitious in the number and scope of reforms it has adopted to encourage more voter participation and close equity gaps. Given this scope, not every reform is likely to have worked exactly as intended. Moving forward, it seems worth transitioning into a broader examination of these reforms to understand better which have worked, which have not, and how all might be improved. The Voter’s Choice Act, for all its good intentions, is a good place to start.
Topics
Political LandscapeLearn More
Changes to Voting Options Disrupted Turnout for Some Voters

California’s Voter Turnout Sank in 2024

Low-turnout Communities Have a Smaller Voice in California’s Democratic Process

Equity in Voter Turnout after Pandemic Election Policy Changes