
Table of Contents
- Key Takeaways
- Introduction
- CSU Is the Leading Destination for Community College Transfer Students
- Who Applies for Transfer?
- Admission Rates Are High for CCC Applicants to CSU
- Enrollment Rates Are High Too
- CCC Transfer Students Have High Graduation Rates
- Conclusions and Recommendations
- Notes and References
- Authors and Acknowledgments
- PPIC Board of Directors
- Copyright
Key Takeaways
California’s community college system serves over 2.1 million students, with most expressing transfer intent. But transfer rates are low—only one in five students transfer within four years of initial enrollment. Even modest improvements could substantially increase four-year enrollment and degree completion.
In this study we analyze transfer patterns between the California Community College (CCC) system and the California State University (CSU). As California pursues a goal of 40 percent baccalaureate completion among working-age residents by 2030, optimizing this critical pathway will be essential for meeting statewide educational objectives.
Major findings:
- The typical CSU applicant spends nine terms enrolled in the community college system prior applying to CSU. However, some applicants are able to apply for transfer sooner, especially those who reach key milestones during their first year of community college.→
- Despite high acceptance and enrollment rates in CSU, many qualified students do not apply: 21 percent of ADT recipients between academic years 2018–19 and 2022–23 never applied to CSU despite guaranteed admission. More than half of these students (32,500) do not seem to have continued on their path to a bachelor’s degree.→
- CCC transfer students are admitted at very high rates: 92 percent of CCC transfer applicants are eventually admitted to at least one CSU campus. However, admission is not a linear process. Three in ten applicants apply in more than one term. Almost half of these students (47%) had all their applications denied the first time around but were admitted at a later term.→
- A large majority (69%) of admitted transfer applicants in our sample choose to enroll in CSU. Among admittees who did not, 47 percent (62,700 applicants) did not appear to have enrolled at any four-year college. This group represents the most immediate opportunity for enrollment gains at CSU.→
- For students who do enroll in a four-year institution, issues of proximity or cost do not seem to be why they did not enroll in CSU. But for students without enrollment in any four-year institution these factors may have been deterrents.→
- Students successfully transferring to CSU achieve encouraging results: 76 percent of fall 2020 enrollees graduated by spring 2024.→
When the transfer pathway works, it works. High admission rates and high graduation rates among successful transfer students validate investment in improving access to this proven route to baccalaureate completion. The challenge lies in ensuring that more California community college students are able to get to the point of applying, and that CSU has the capacity to welcome them in the campuses and majors of their preference.
Introduction
California has the largest and most diverse public higher education system in the country. The biggest and most connected parts of that system are the California Community Colleges (CCC) and the California State University (CSU). The community college system is composed of 116 colleges that serve more than 2.1 million students, while CSU’s 23 campuses enroll almost a half million students. A key component of the state’s higher education framework is the ability to transfer from the community college system to a four-year college. CSU is the leading destination of community college transfers, who make up over 40 percent of the university’s new undergraduate enrollment.
California has set an ambitious goal for postsecondary attainment, including substantial increases in baccalaureate completion: 40 percent among working-age Californians by 2030. A well-prepared workforce is a crucial part of ensuring that our state has a healthy economy for decades to come. Moreover, by increasing postsecondary attainment, particularly among underserved populations, California aims to reduce income inequality and create opportunities for all residents to achieve economic success. A four-year degree still gives most individuals the best chances of economic prosperity (Cuellar Mejia, Alesi Perez, Hsieh, and Johnson 2025; Levine and Pardue 2024).
Critical to achieving those goals is increasing the number of community college students who transfer to CSU. Most recently, CSU has taken important new steps in this direction. In their new systemwide strategic plan, CSU commits to increase transfer enrollment by 15 percent during the next three years as one of their strategies to improve educational and economic mobility in California.
It is an especially opportune time to undertake these efforts. After years of strong increases, the number of high school graduates is expected to stop growing and may even start to decline, limiting the pool of first-time freshmen (Johnson and Alesi Perez 2024). Some CSU campuses have experienced outright enrollment losses in recent years, and are looking for new students. At the same time, the community colleges enroll hundreds of thousands of students whose primary intent is to transfer.
But most of those students do not end up transferring: only one in five transfer within four years of initial enrollment (see Technical Appendix Figure B2) and large racial/ethnic and geographic disparities persist (California State Auditor 2024; Cuellar Mejia et al. 2023; Velasco et al. 2024). This means that even small improvements in the share of students transferring can have large effects on enrollment at four-year colleges.
In short, the community colleges offer a large pool of students who want to earn a bachelor’s degree, and CSU is in a prime position to capitalize on that desire.
This report answers fundamental questions about the transfer pathway that have been understudied until now:
- Who is applying for transfer? And who is getting in?
- What happens with admittees who decide not to enroll in CSU? Where do they end up?
- What role do factors like proximity, selectivity, and cost play in explaining enrollment decisions among CSU admittees?
- How well do transfer students do at CSU? What educational markers in community college correlate to later success in CSU?
We close the report with recommendations for improving transfer from CCC to CSU, with a focus on students who are close to transferring but never successfully do so.
CSU Is the Leading Destination for Community College Transfer Students
For decades, CSU has been the leading destination for transfer students from the CCC. Partly this is to be expected: most transfers are looking to attend a public college within California, and CSU is a much larger system than the University of California (UC) system. The CSU system also offers a broader geographic spread that covers both urban and rural areas. And students often enroll in campuses that are relatively close to their homes or where they completed their previous education (Segovia & Cooper 2024; Cuellar Mejia et al. 2023).
In recent years, about 58 percent of community college students who successfully transferred to a four-year institution went to CSU. Another 17 percent went to UC, 10 percent to in-state private institutions, and 15 percent to out-of-state universities (Cuellar Mejia et al. 2023).
Transfer Applications and Enrollment Are Well below Pre-Pandemic Levels
Declines in community college enrollment, partly related to the COVID-19 pandemic, led to a subsequent decline in transfer applicants and enrollees between 2020 and 2023. Fortunately, some positive signs have started to emerge since then (Figure 1). In fall 2024, the CSU system received 3,430 more applications (a 4.2% increase) from community college transfer students than in fall 2023—but applications are still 16.4 percent below the 2020 peak. Fall 2024 applications resulted in 50,259 new transfer students enrolling in a CSU campus, a 6 percent increase over the prior year. Despite this increase, enrollment is 17 percent below the 2020 peak of 60,529 new transfer students.

This recent growth has not spread equally across the system. For example, campuses like San Diego State, Cal State Los Angeles, and San Francisco State continued to experience declines through fall 2024. Indeed, transfer enrollment in both Cal State Los Angeles and San Francisco State is still more than 30 percent below the fall 2020 peak. Other campuses where transfer enrollment is markedly down are Dominguez Hills, Northridge, and Cal Poly Pomona (see Technical Appendix Table B2).
At the same time, at five campuses—Fresno State, Fullerton, Sonoma State, Monterey Bay, and Chico State—transfer enrollment has surpassed the fall 2020 peak.
CSU depends on transfer enrollment more than UC and more than most public universities across the nation. Improving transfer rates not only increases enrollment, an issue at a growing number of campuses, it also enhances CSU’s ability to maintain programs and services. Improvements could also positively impact the size and diversity of the pool of California college graduates—broadening economic opportunity and reflecting more closely the demographic makeup of the state.
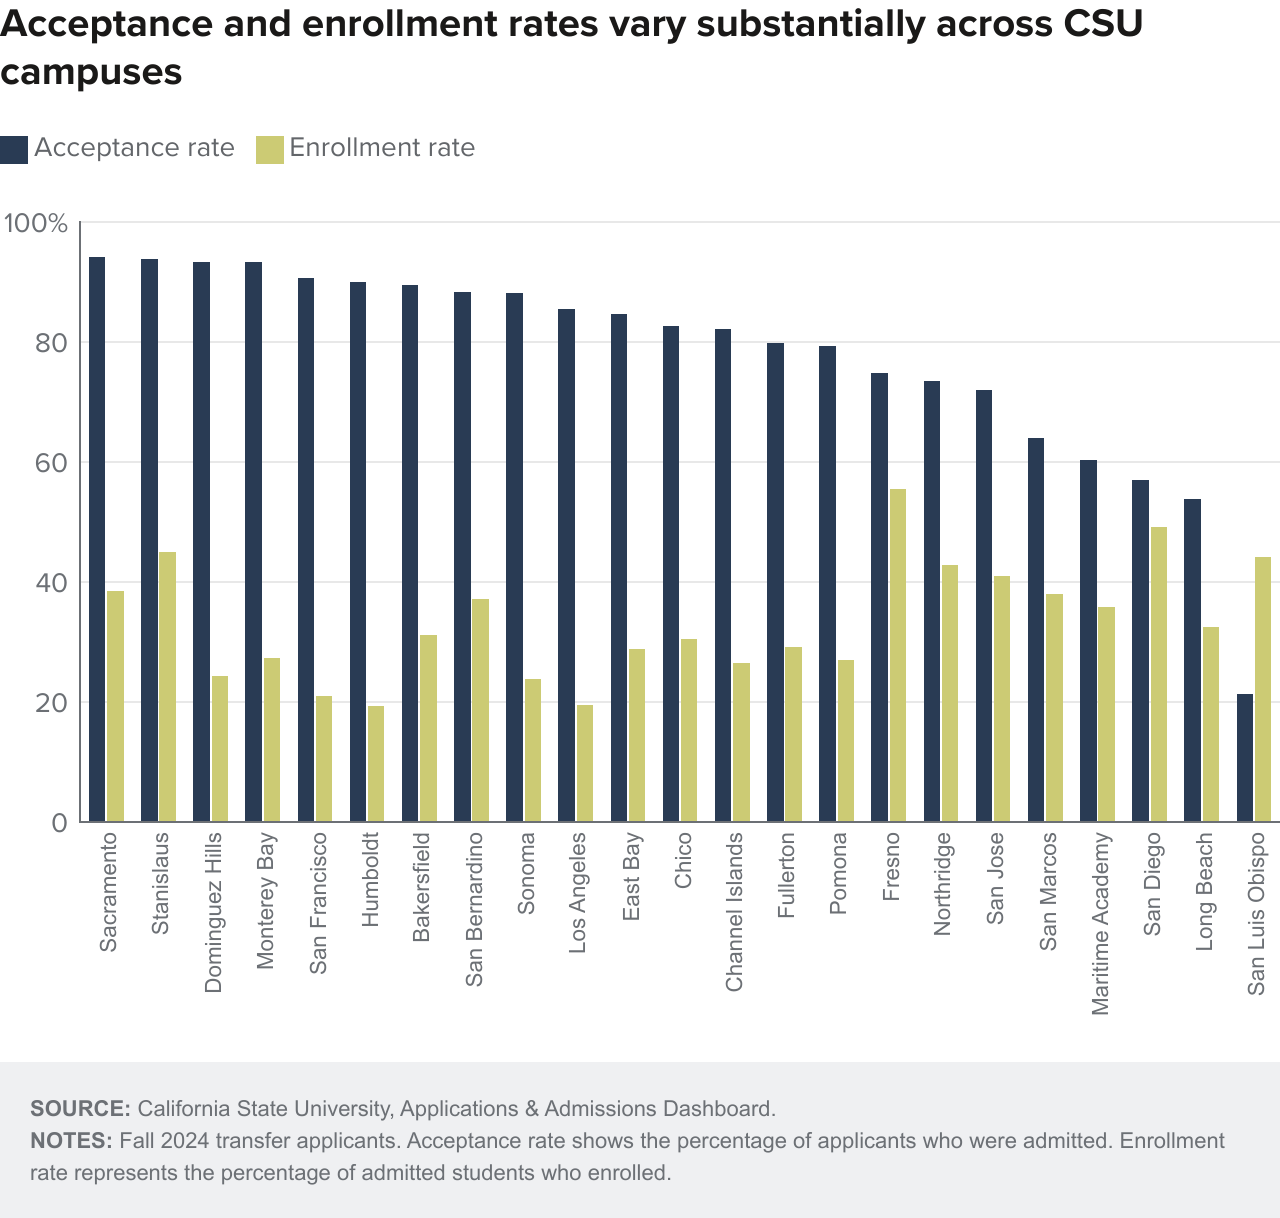
Admission and Enrollment Rates Are High Systemwide but Vary Widely across Campuses
The CSU system saw 91 percent of transfer applicants admitted to at least one campus for the fall 2024 term, and of those, 65 percent enrolled. However, both rates vary widely among the individual CSU campuses, influenced by factors including, but not limited to, campus selectivity, enrollment goals, and transfer agreements with local community colleges (Figure 2). On one extreme is Cal Poly San Luis Obispo, the most competitive and selective of the CSU campuses, with an acceptance rate of only 21 percent for transfer applicants. Other selective CSUs, though considerably less competitive than Cal Poly San Luis Obispo, include Cal State Long Beach (54%) and San Diego State (57%). And at the other extreme are campuses at Sacramento State, Stanislaus State, Dominguez Hills, and Monterey Bay, all with acceptance rates of over 93 percent.
Enrollment rates (the share of admitted applicants that enroll, also known as yield rates) are highest at Fresno State (55%), San Diego State (49%), Stanislaus State (45%), Cal Poly San Luis Obispo (44%), and Northridge (43%). Despite receiving the highest number of applications, the enrollment rate at Long Beach is 33 percent.
Who Applies for Transfer?
Transfer applicants include a wide range of students, demographically and in terms of academic preparation.
In our sample, 48 percent of applicants are Latino, 26 percent white, 15 percent Asian, and 4.5 percent Black. More than half (57%) are female, 72 percent are 24 years old or younger, and 75 percent received a California Promise Grant or Pell Grant at some point during their CCC journey (see Technical Appendix Table B3).
CSU transfer applicants who want to transfer with junior standing must have completed 60 semester transferable units as a minimum requirement for admission. The median student earned 71.5 transferable units in CCC before applying to CSU, with applicants in the bottom 25th percentile earning 62 and applicants in the top 75th percentile earning 85.
Seventeen percent of applicants applied with less than 60 units from the CCC system. Some of those students were deemed ineligible and denied admission, but others had earned credits through standardized external examinations—including Advanced Placement, International Baccalaureate, and College-Level Examination Program—or had credits from other colleges that we cannot track in our data.
The median CSU transfer applicant had a cumulative GPA of 3.13 (transferable units only) with applicants in the bottom 25th percentile having a GPA of 2.67 and applicants in the top 75th percentile having a GPA of 3.55.
Finally, 46 percent of all applicants had earned an Associate Degree for Transfer (ADT) prior to applying, and an additional 22 percent had earned a local associate degree.
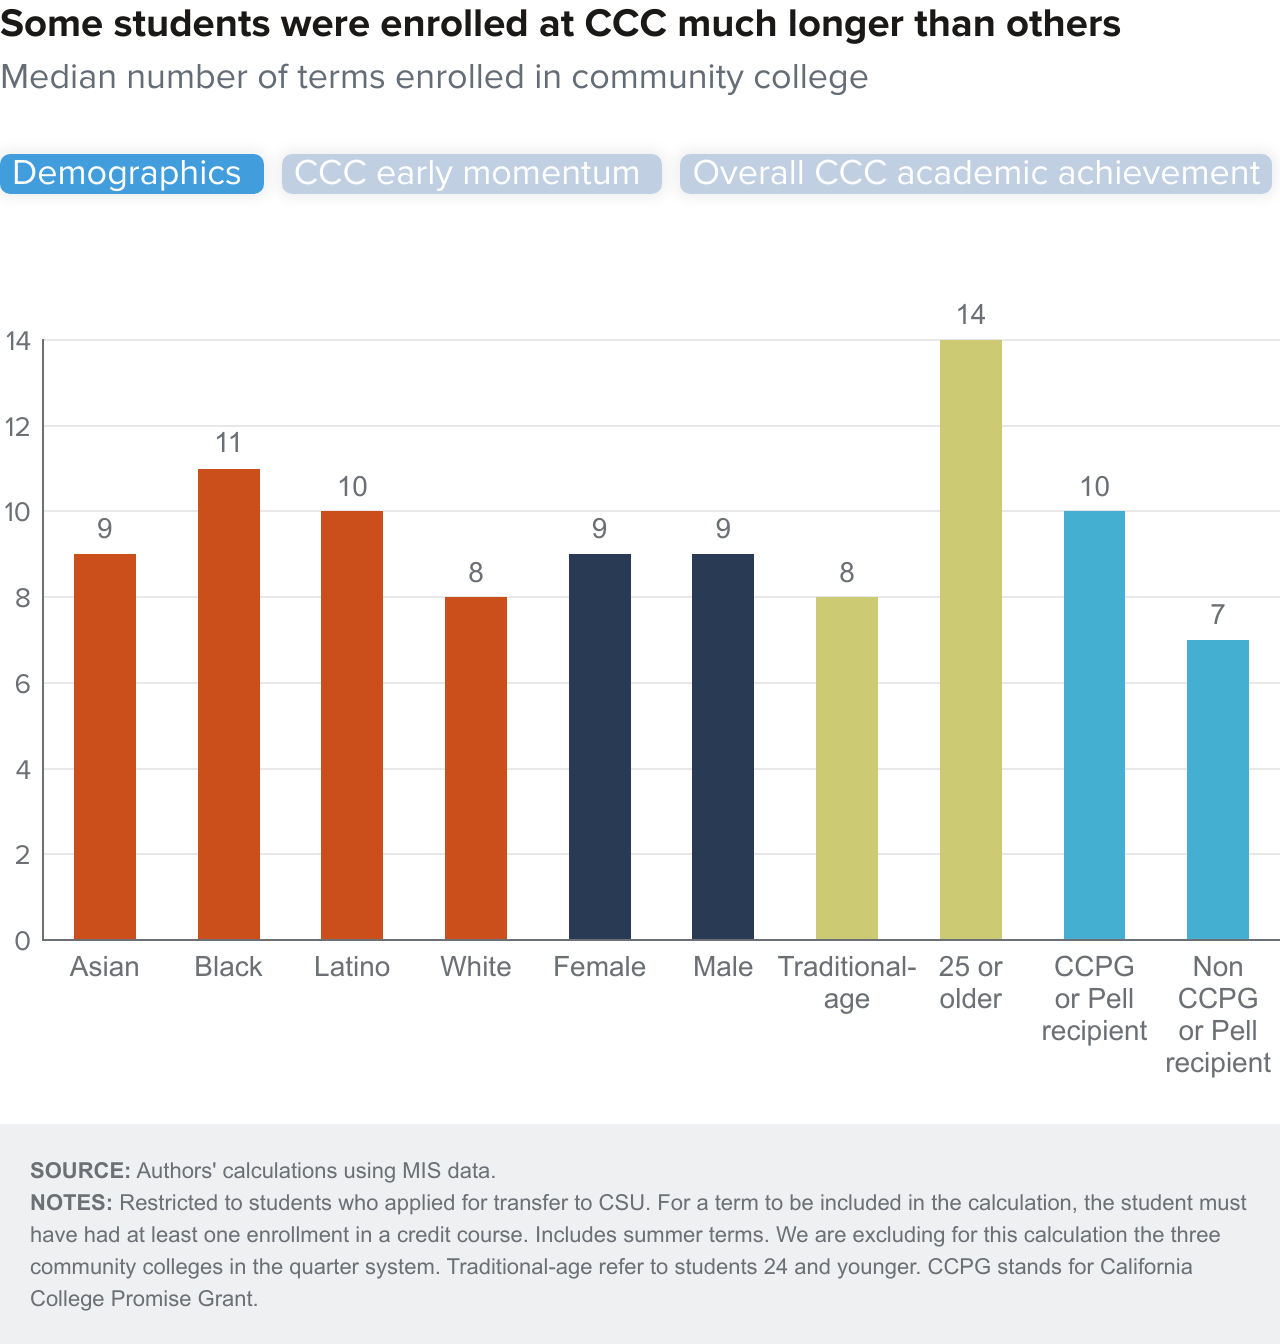
How Long Were Applicants Enrolled at CCC?
We find that the typical CSU applicant spends nine terms enrolled in the community college system prior to applying to CSU (with an interquartile range of six terms). However, some applicants are able to apply for transfer sooner, especially those who exhibited early momentum (Figure 3). For example, the typical student who successfully completed transfer-level math in their first year was able to apply to CSU after seven terms while the typical student who did not complete transfer-level math was not able to apply until attending for 10 terms. Other first-year outcomes (completing transfer-level English, or earning 24+ transferable units, and higher GPAs) are also correlated with more efficient transfer.
Students who are 25 or older, Black, or California College Promise Grant (CCPG) or Pell Grant recipients are less likely to meet these early milestones (see Technical Appendix Table B4), so it is not surprising that they are more likely to stay in CCC longer. Looking past first-year outcomes, students with higher cumulative GPAs tend to spend less time in CCC.


Many Qualified Students Do Not Apply
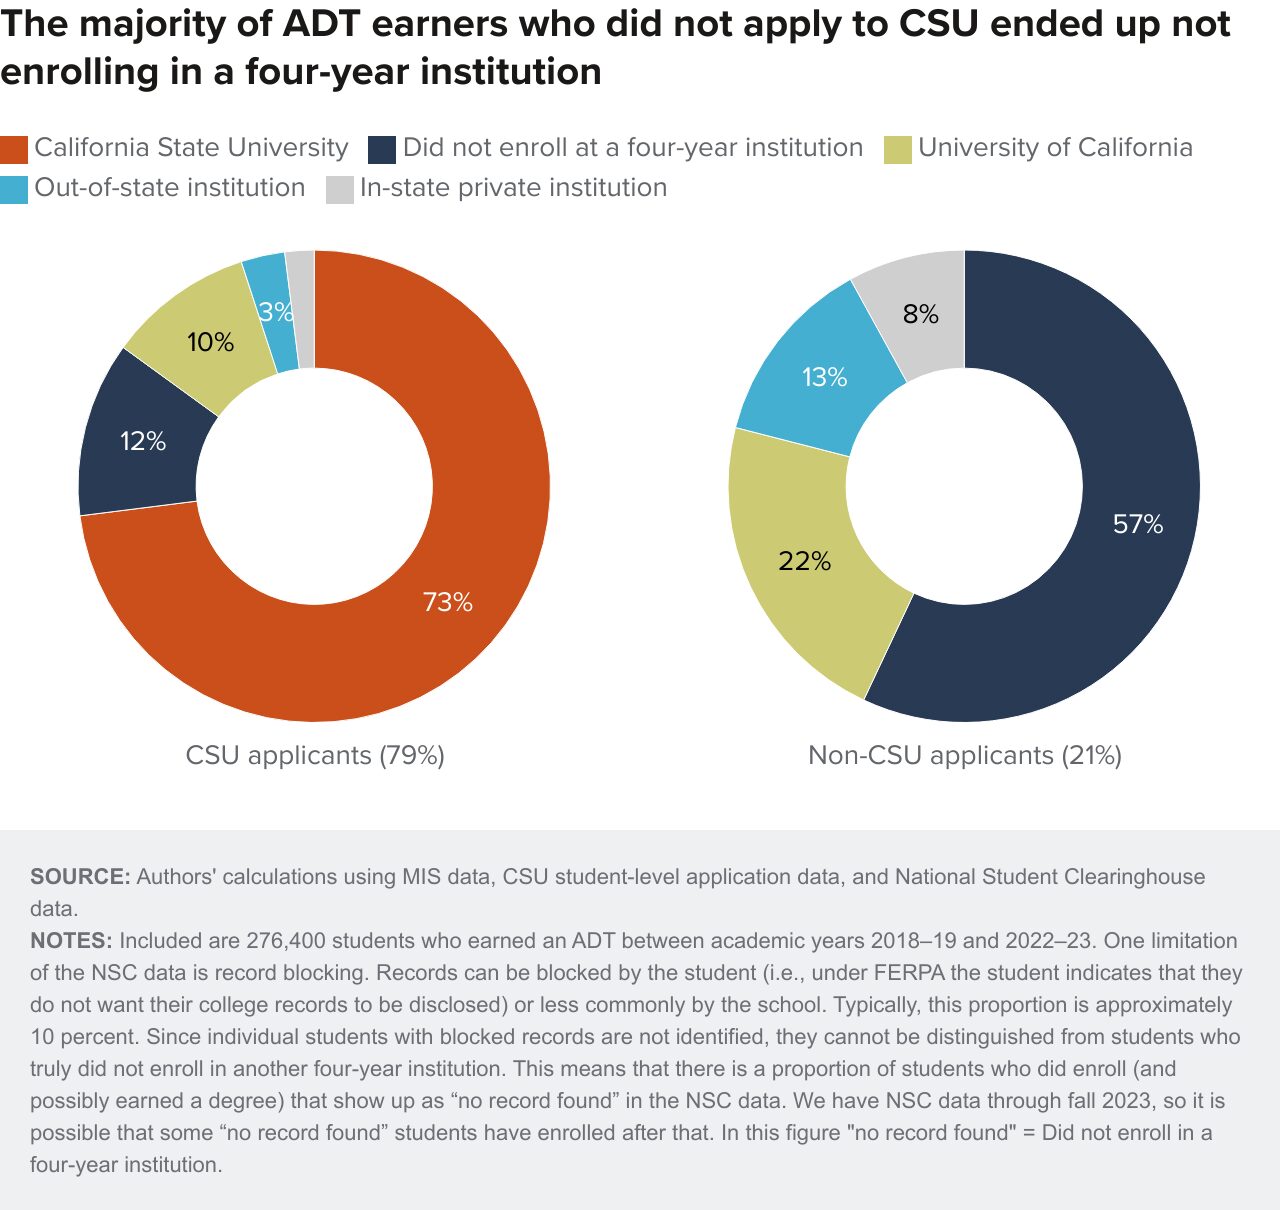
A large number of community college students who did not apply to CSU would have likely qualified for admission. One way to assess the size of this group is by examining transfer outcomes for students who earned an ADT. (Many students who did not earn an ADT also appear to be likely to have gained admission had they applied, but ADT recipients offer a convenient test group.)
Our analysis of 276,400 ADT recipients between academic years 2018–19 and 2022–23 reveals that 21 percent never applied to CSU. For the most part, ADT recipients who did not apply to CSU look similar to those who applied, with some exceptions (see Technical Appendix Table B5). They were more likely to be white (29% vs. 23%) and 25 or older (33% vs. 26%). They were also more likely to have higher cumulative GPAs (51% have GPAs greater than 3.25 vs. 45%).
Among ADT recipients who did not apply to CSU, 43 percent enrolled in some other university—with a slight majority choosing UC (which is consistent with their higher cumulative GPAs). But disturbingly, more than half (57%, nearly 33,000 students in our sample) did not have records in the NSC data through fall 2023, suggesting that they did not transfer to any four-year college (Figure 4). If we add these to the nearly 26,000 ADT recipients who applied to CSU but who did not seem to have enrolled in a four-year institution, then we have 59,000 ADT recipients who did not continue their path to a bachelor’s degree.
The big question is why. It is possible that some of these students never intended to transfer but earned an ADT because their advisors suggested it. However, we find that 87 percent of ADT recipients declared a transfer goal while in CCC. It is also possible that some of these students felt that a four-year degree was out of reach, whether because of financial considerations, inability to relocate due to family responsibilities, or because they needed to prioritize work. The strong labor market for workers without a college degree that characterized most of our period of analysis increased the immediate opportunity cost of attending college and could be another factor at play (Lafortune and Bohn 2023). Information about labor market outcomes for these students could help gain a better understanding of economic forces influencing this population.
Admission Rates Are High for CCC Applicants to CSU
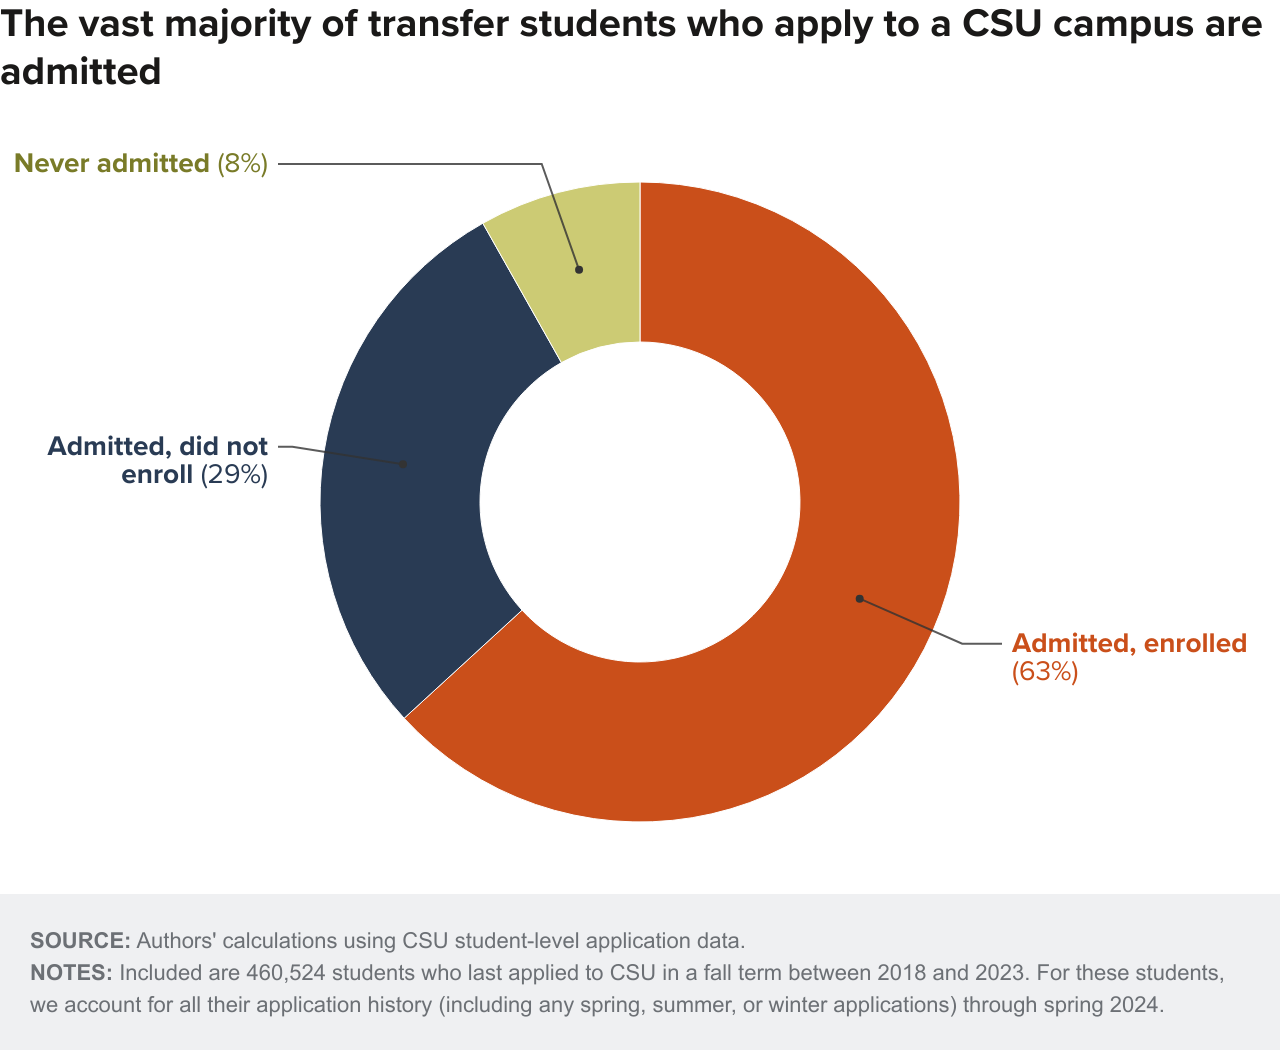
The good news is that the vast majority of CCC students who last applied to CSU between fall 2018 and fall 2023 were admitted to at least one campus (92%; Figure 5). This suggests that most community college students who go through the application process have met the minimum academic criteria to be eligible to transfer (see text box above).
Admissions are determined at the campus level and are influenced by department-specific requirements and capacity limitations. This means that a competitive applicant at one campus may not be competitive at another. So, it is not surprising that students often apply to multiple campuses and apply in more than one term.
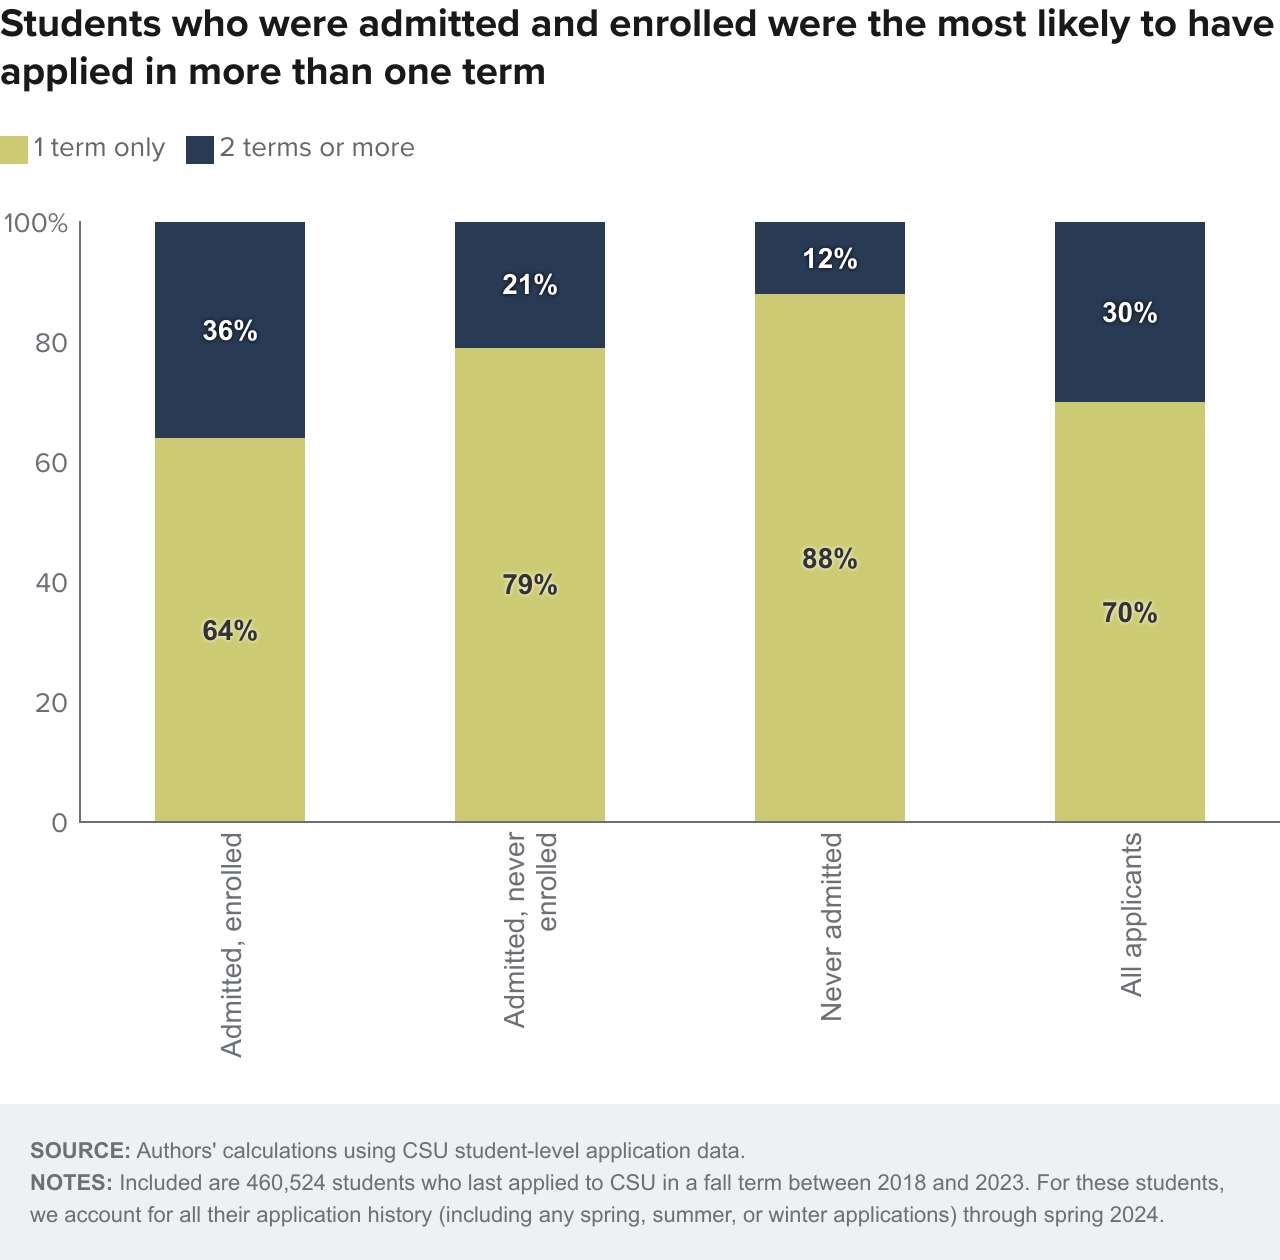
Persistence seems to pay off. A large share (36%) of those who end up enrolling applied in more than one term (Figure 6). It is possible that these students were initially rejected from the campus of their choice (or to all campuses), took more community college classes, and then gained admission. Indeed, 47 percent of students who applied in more than one term had all their applications denied the first time around but were admitted at a later term (see Technical Appendix Figure B4).
At the other extreme, the vast majority of students (88%) who were never admitted applied in one term only, and 61 percent of those applied to only to one campus. These students might have been discouraged by the initial rejection or did not see other campuses as viable options. (As we will show later in the report, some of these students enrolled elsewhere but many decided not to pursue a four-year degree.)
Admission Rates Are High across a Broad Set of Applicant Characteristics
Although there is some variation across applicants’ academic and demographic characteristics, admission rates are high across the board (see Technical Appendix Table B8).
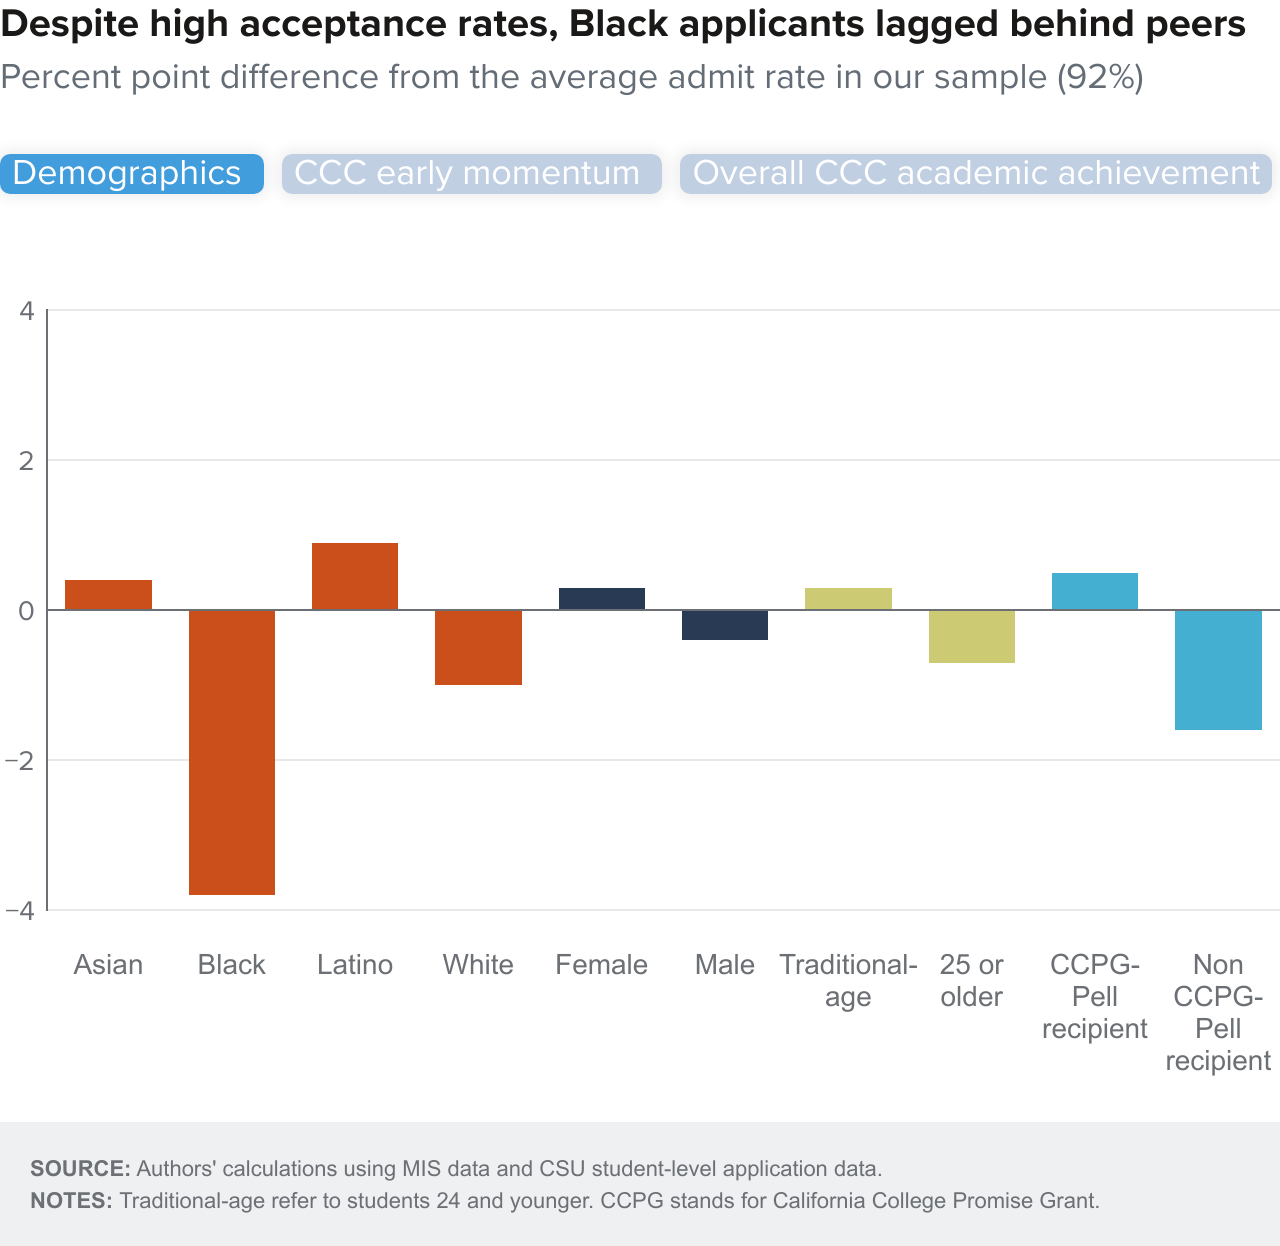
Across racial and ethnic lines, the admission rate for Black applicants, 88%, is 3.8 percentage points below the overall rate. The difference remains even after we control for other demographic and academic characteristics.
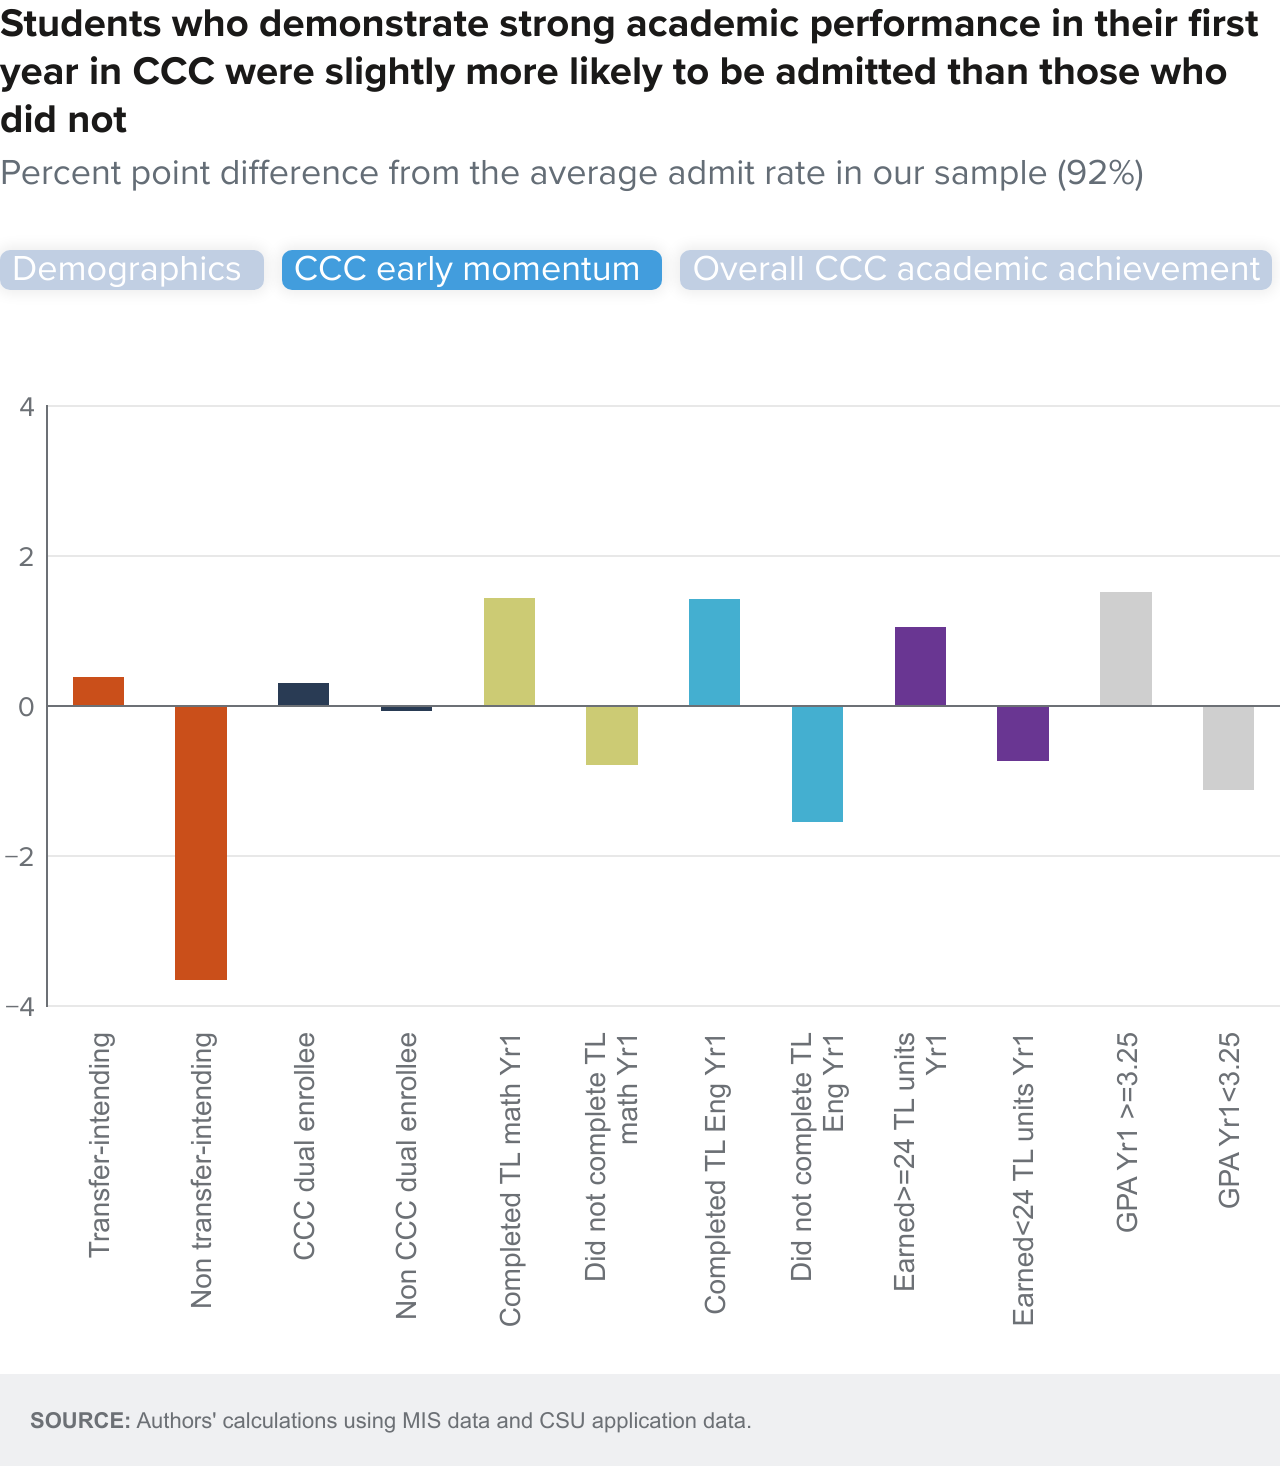
Early markers of academic success in CCC made applicants slightly more likely to get admitted (Figure 7, panel 2). For example, admission rates for students who took transfer-level math or English in their first year were 1.5 percentage points higher than those who did not meet that early milestone. The same was true for those who earned a high first-year GPA and those who earned 24 transferable units or more in their first year. CCC dual enrollment students—those who took community college classes while still in high school—were admitted at the same rate as non-dual enrollment applicants. Applicants who did not state a transfer goal while in community college were least likely to be admitted (88%), suggesting that stating a transfer goal early on seems to be correlated with successful outcomes.
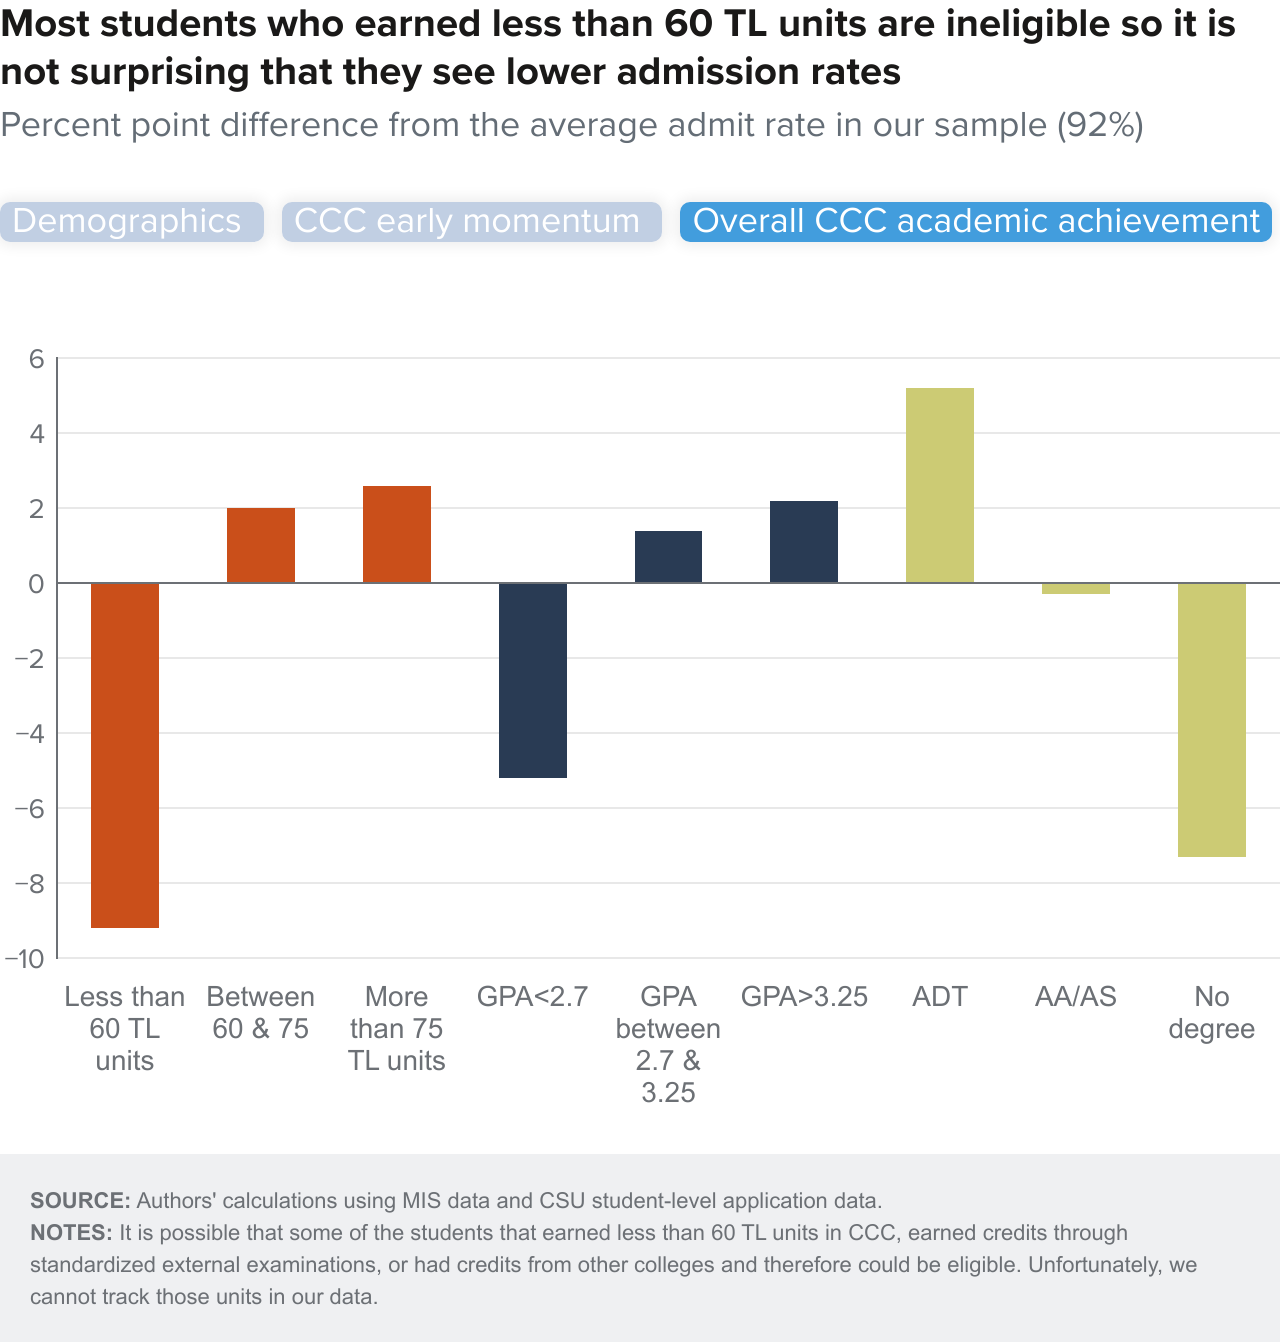
Not surprisingly, the primary predictor of admittance is a transfer applicant’s overall academic record (Figure 7, panel 3). Virtually all ADT applicants were admitted (97%, or 5.2 percentage points above the overall admission rate). Having a high GPA (3.25 or higher) was also associated with high rate of admittance (+2.2pp).
What Happens to Those Who Are Never Admitted to CSU?
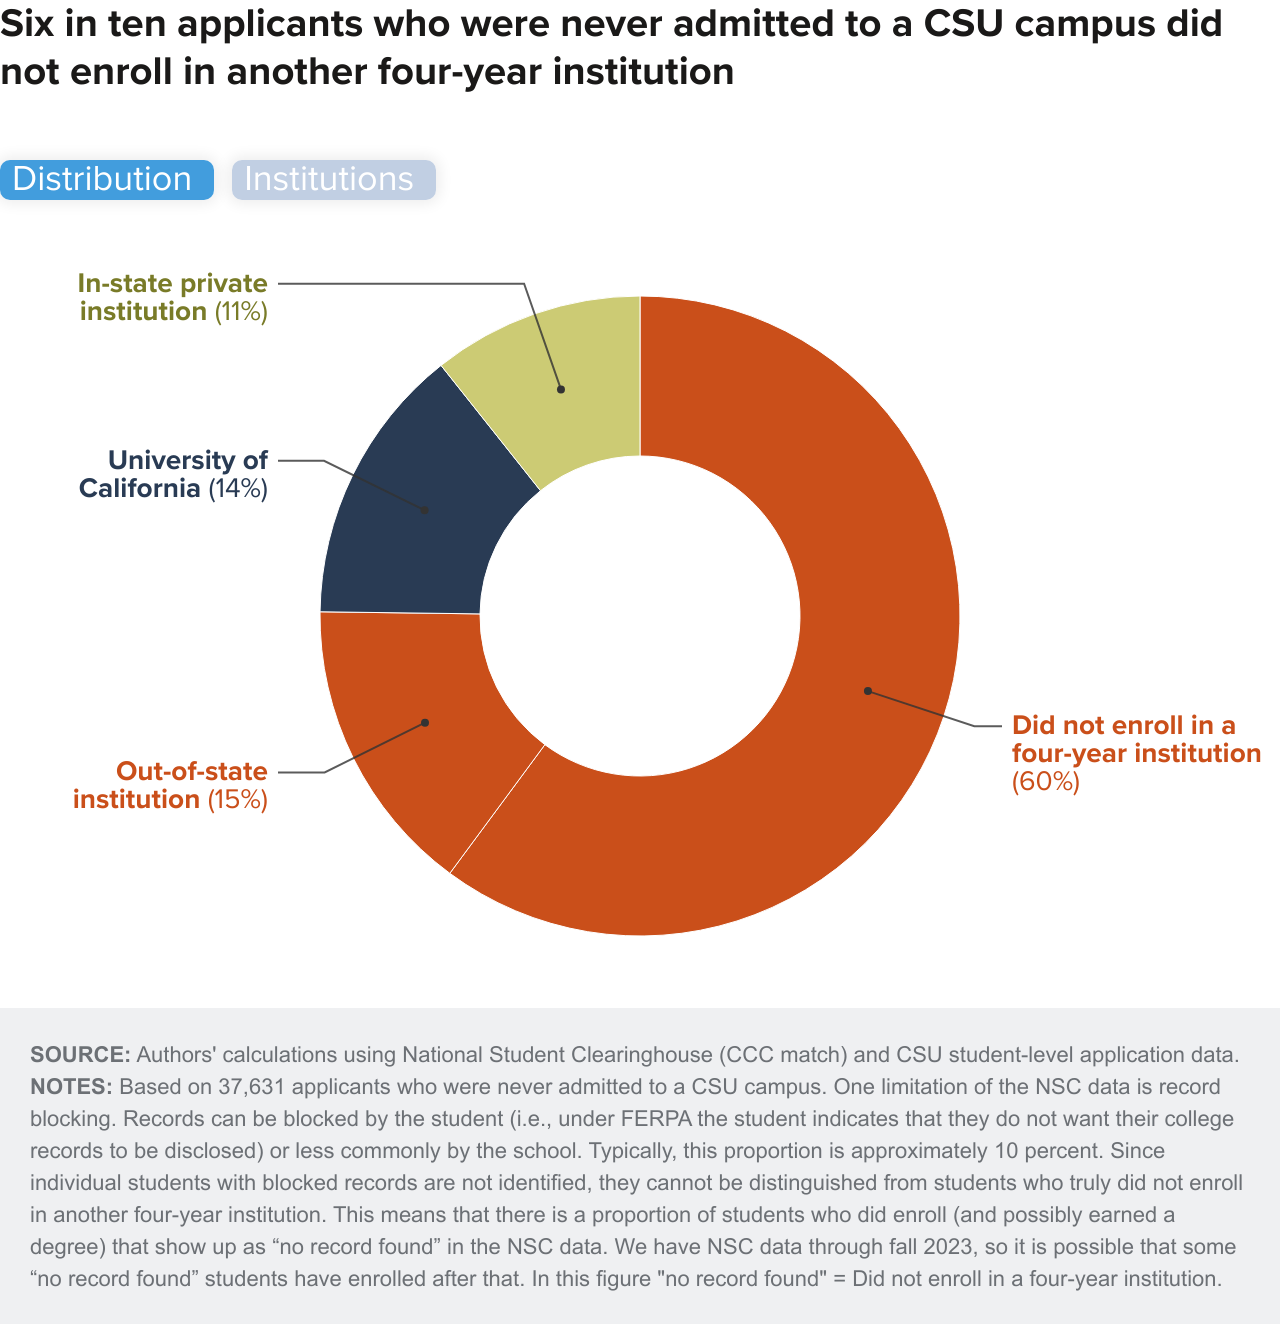
In our sample, almost 38,000 applicants (or 8%) were never admitted to a CSU campus. Six in 10 students in this group did not appear to have enrolled in a four-year institution in California or elsewhere, according to our analysis of NSC data (Figure 8). Of the remaining 40 percent, 15 percent went to out-of-state institutions, 14 percent to UC, and 11 percent went to a private college in California.
Those who were never admitted to a CSU campus and enrolled in a UC campus (about 5,300 applicants in our sample) represent an interesting group. Almost half (48%) of the applications submitted by these students were for three campuses: San Diego State (19%), Cal Poly San Luis Obispo (17%), and Cal State Long Beach (12%). These are the most selective CSUs, with acceptance rates of 57, 21, and 54 percent, respectively, for fall 2024. This pattern is consistent with the fact that these applicants had strong academic records despite being turned away by CSU (see Technical Appendix Table B9). UC San Diego received 18 percent of all CSU “never admitted” applicants that enrolled in a UC campus; UC Riverside and UC Santa Barbara were next in terms of enrollment.
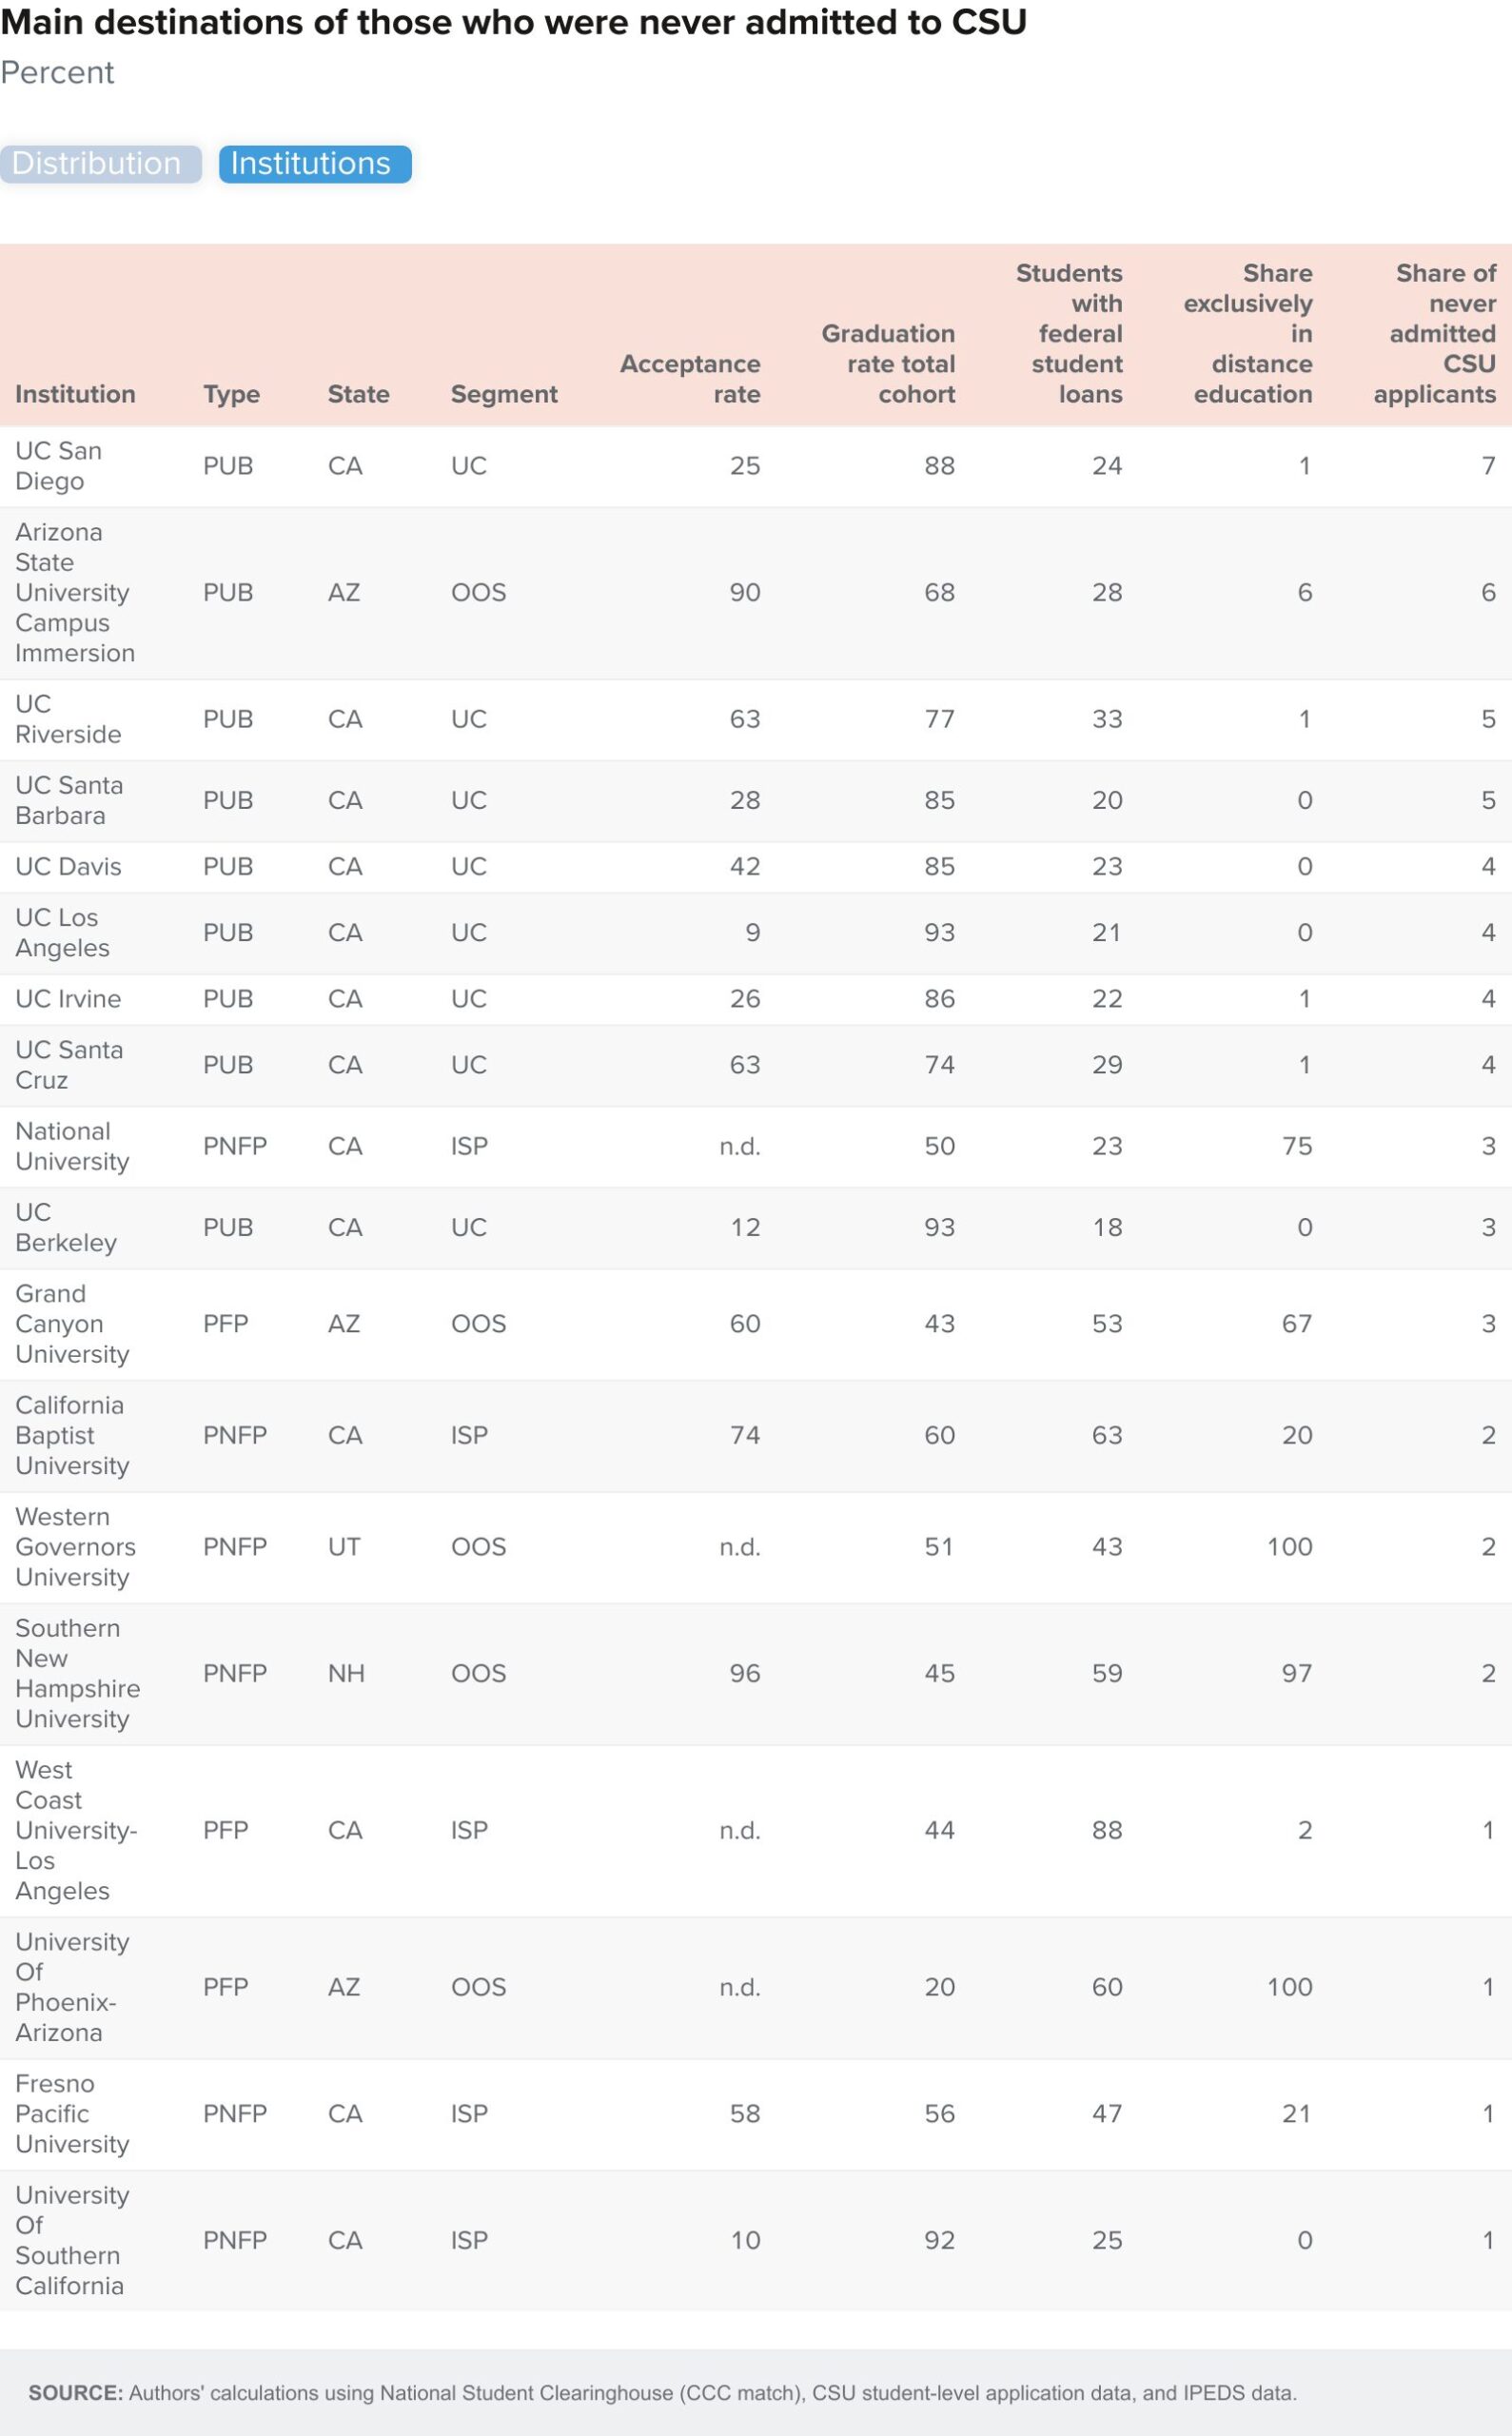
A similar number of never-admittees to the CSU (5,675 applicants) enrolled in an out-of-state institution (58% enrolled in a public institution, 26% in a private nonprofit institution, and 16% in a for-profit institution). Arizona State University, Grand Canyon University, Western Governors University, Southern New Hampshire University, and University of Phoenix together enrolled 36 percent of these applicants (Figure 8, panel 2).
While the flexibility that some of these out-of-state institutions offer could be very attractive to some students, the fact is that these particular institutions have low graduation rates (Guzman, McGuinness, and Turner 2025). White and Black students were overrepresented among those enrolling in out-of-state colleges (see Technical Appendix Table B9). Almost half of these students (47%) earned less than 60 transferable units while in CCC, indicating that their CSU admissions were most likely denied because they did not meet the minimum requirements for admission. Moreover, students who enrolled in these five universities had a median GPA of 2.7, which is noticeably below the median GPA among all applicants admitted to CSU. For those who enrolled at an in-state private institution, National University—which also has a large online presence and a low graduation rate—was the main destination.
Unsurprisingly, applicants with weaker academic backgrounds (lack of early momentum, less than 60 transferable units, lower GPA, no degree), and older applicants were overrepresented among those who do not appear to have enrolled in any four-year institution (22,600 applicants). However, about 7,500 applicants in this group (a third) either earned an ADT or earned at least 60 transferable units with a GPA of 3.25 or higher.
Enrollment Rates Are High Too
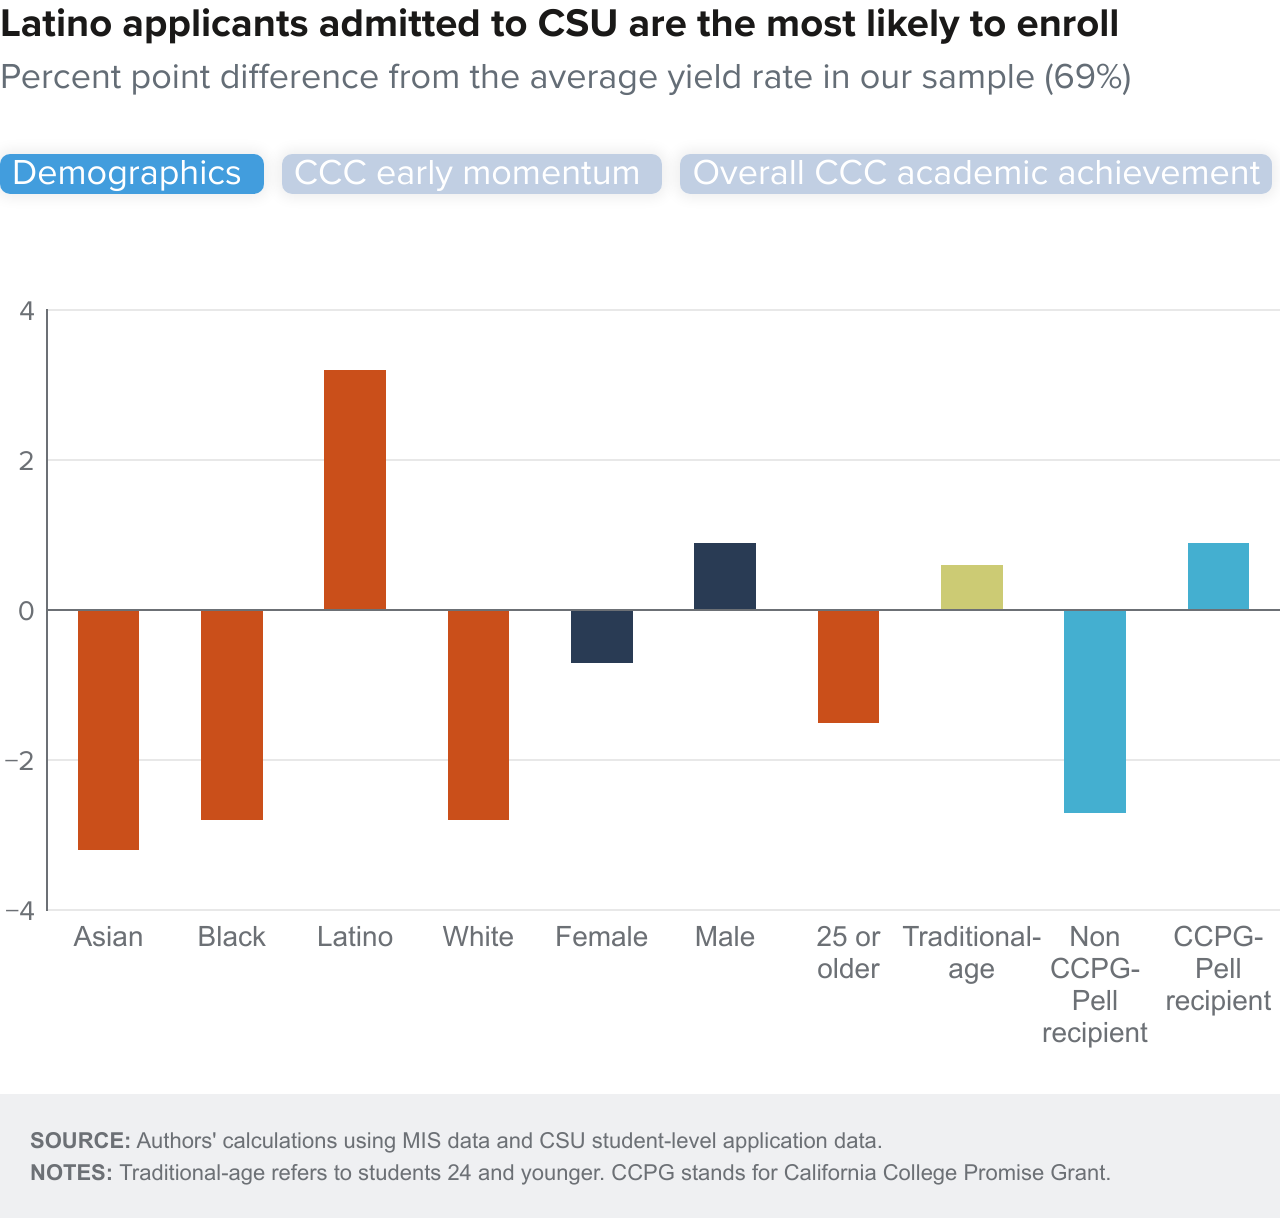
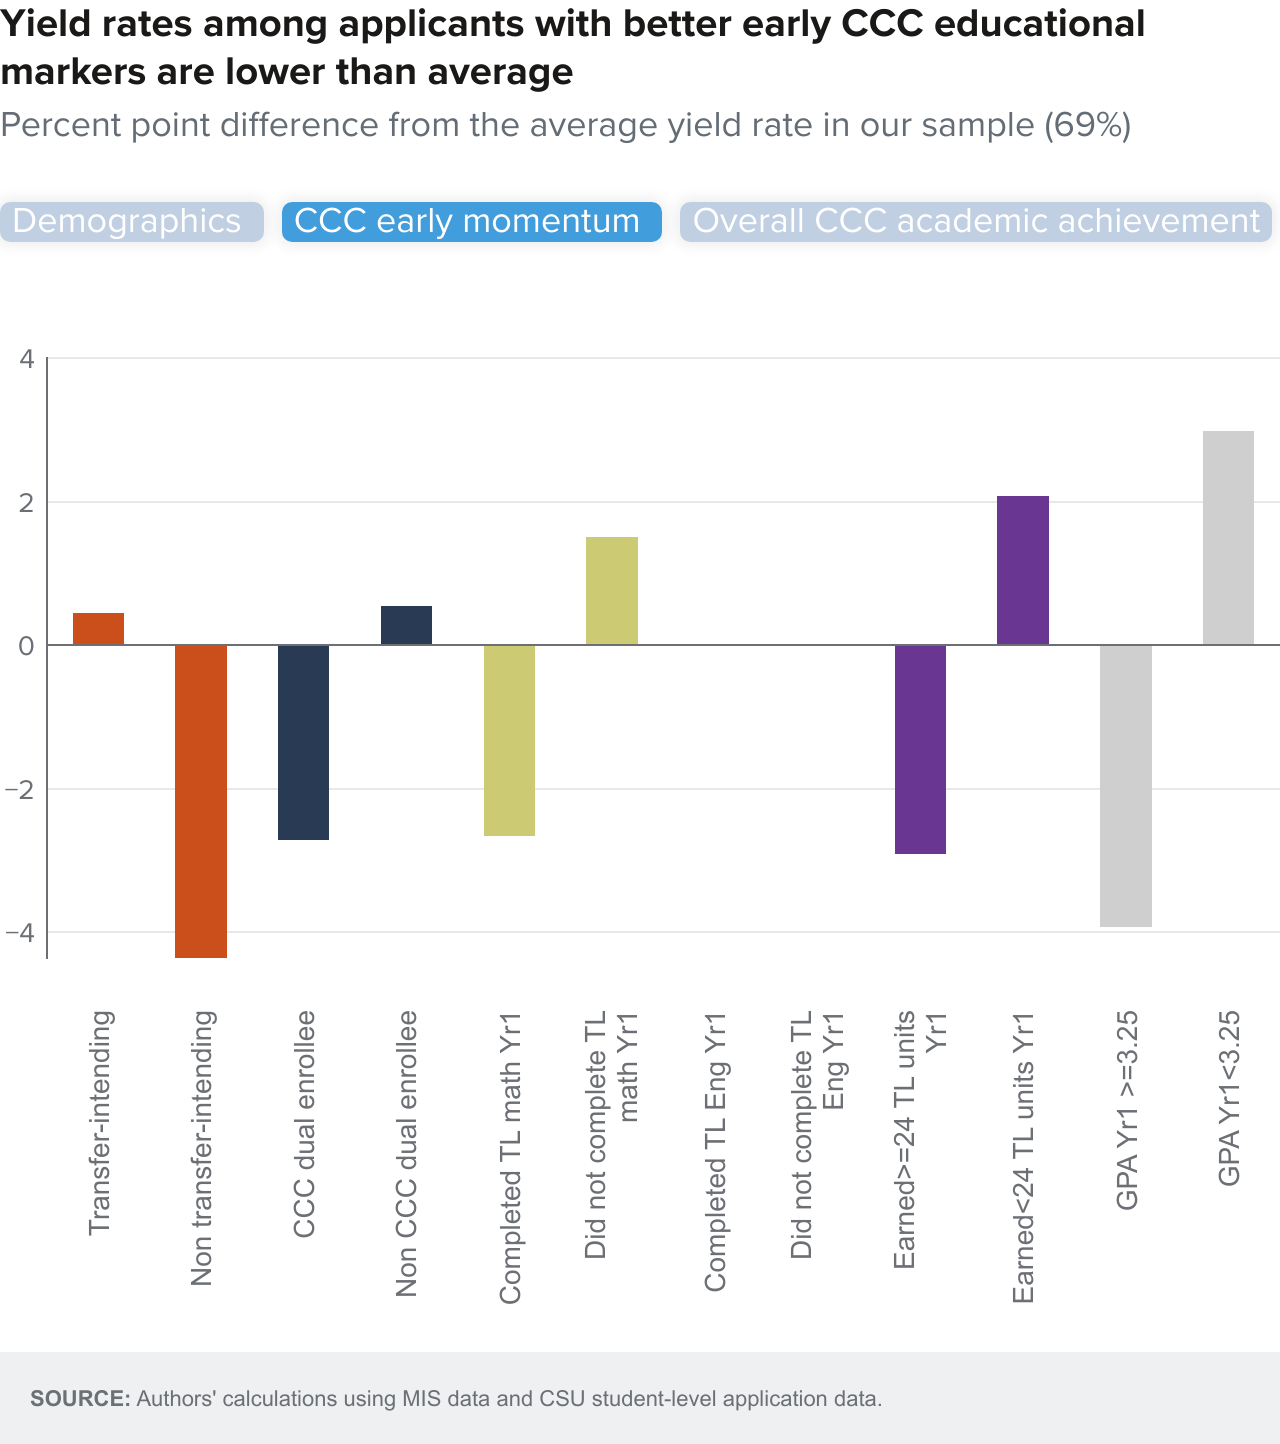
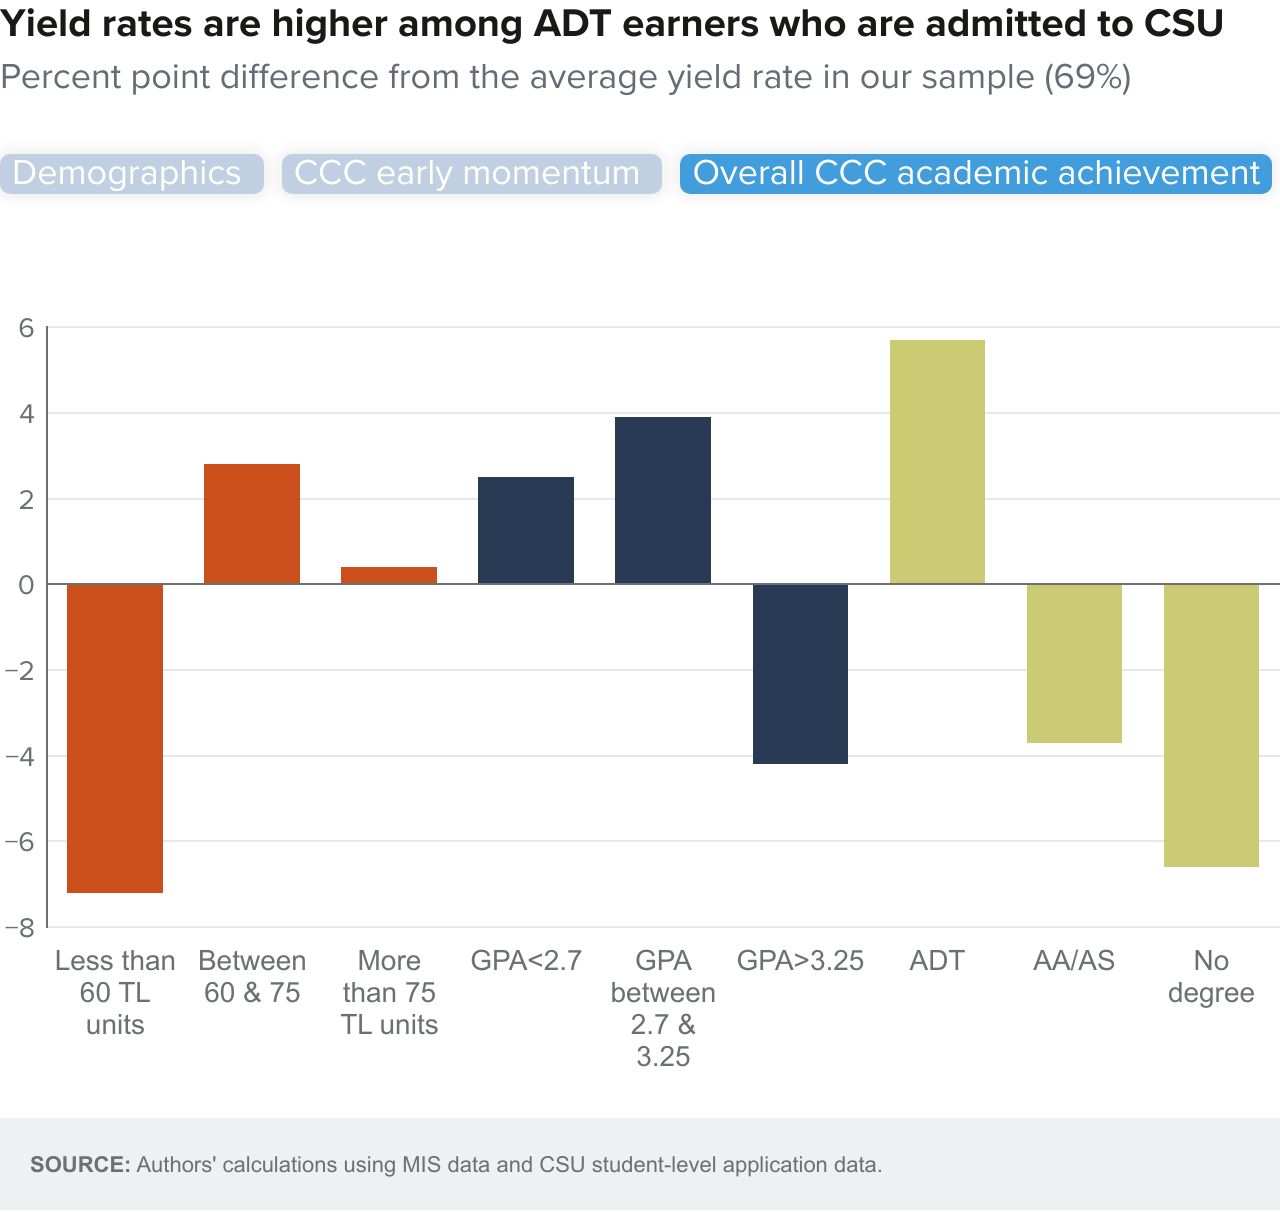
The large majority (69%) of admitted transfer applicants choose to enroll in CSU. In general, as shown in Figure 9, we find that those most likely to enroll were students with an ADT (+5.7pp), students with mid-range GPAs (+3.9pp), and students who earned between 60 and 75 transfer-level units (+2.8pp). Across racial and ethnic lines, Latino students were more likely to enroll than their peers (+3.2pp). This is consistent with the fact that CSU is a highly popular choice among Latino students, with 21 of the system’s campuses designated Hispanic-Serving Institutions.
Meanwhile, 31 percent of those admitted do not enroll at CSU. The students least likely to enroll were those who never declared a transfer goal (-4.4pp), those without any degree (-6.6pp), those who earned less than 60 transferable units (-7.2pp), and those in the higher GPA band (-4.2pp).
What Happens to Those Who Are Admitted but Do Not Enroll?
A third of CSU applicants who were admitted but decided not to enroll ended up in an UC campus instead (Figure 10). UC San Diego, UC Irvine, and UCLA were the preferred campuses. Students making this choice were more likely to be Asian and of traditional college-going age. They were also more likely to have taken dual enrollment courses, completed math/English in their first year in CCC, earned a GPA of 3.25 or higher, and accumulated more than 75 units before transferring.


In contrast are the students who did not enroll in a four-year institution in California or anywhere else; this group comprises almost half of those admitted to CSU but who decided not to enroll (47%, or 62,700 applicants). Black students, Latino students, students with GPAs below 2.7, those who earned less than 60 transfer-level units in CCC, and those without a degree were more likely to be in this group (Figure 11; Technical Appendix Table B10).


In all, the group of students who were admitted to a CSU campus but did not enroll is a bifurcated one. On the one side are students with strong academic backgrounds, while on the other are those with relatively weak records. The first set of students was significantly more likely to enroll at a UC campus, while the second was more likely to enroll in institutions like Western Governors, Grand Canyon University, Southern New Hampshire University, or Arizona State University, or not enroll at all in a four-year institution.
Proximity, Cost, and Selectivity in Enrollment Decisions
There are many factors behind student enrollment decisions including location, academic reputation/selectivity, flexibility, and financial considerations (Chavan 2024). Alternative college options and work opportunities also play a role.
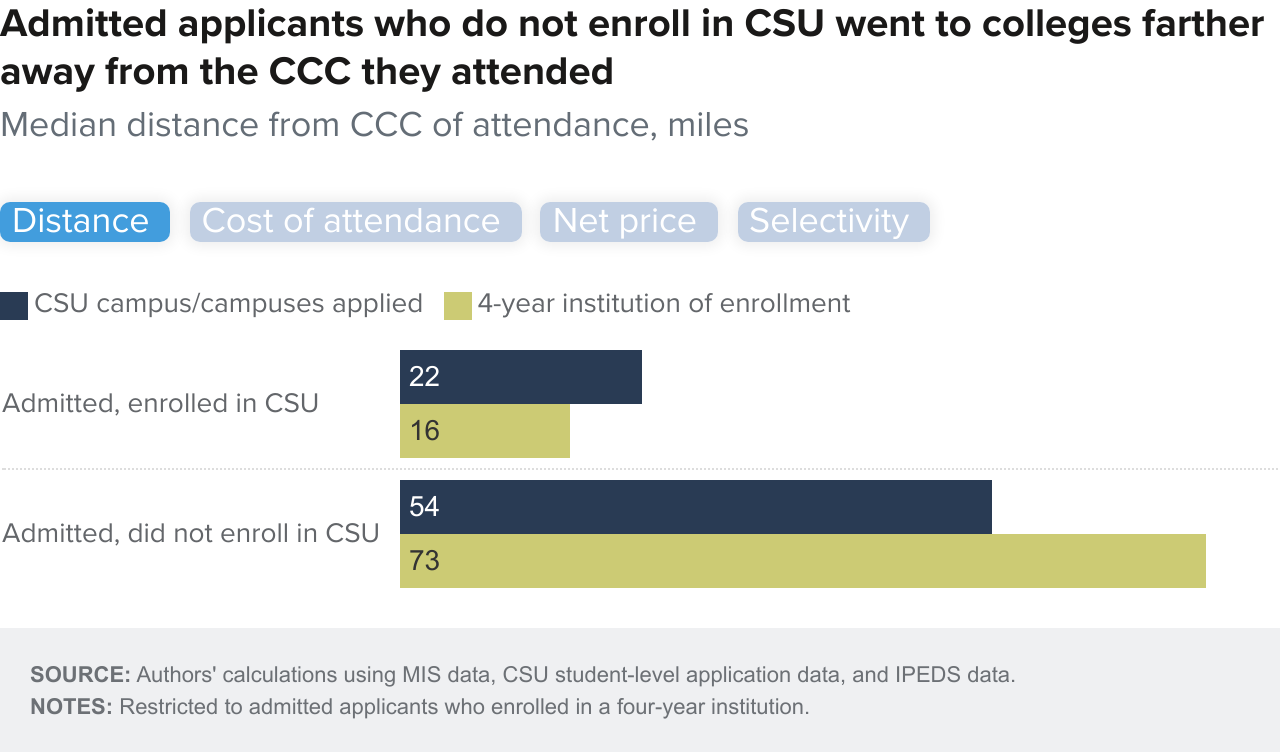
Interestingly, we find that proximity to CCC of attendance or net price—cost of attendance after subtracting grants and scholarships—do not seem to be deterrents for the typical CSU-admitted applicant who ended up enrolling in another four-year institution. In fact, the typical applicant who is admitted to CSU but decides not to enroll there ends up attending colleges that are farther away and more expensive compared to the typical applicant who enrolls in CSU (Figure 12).
They also end up enrolling in colleges that are more selective. The median acceptance rate of the four-year institutions chosen by those admitted but who did not enroll in CSU was 42 percent compared to a median acceptance rate of 92 percent of the CSU campuses chosen by those who did enroll. These trends hold true across different populations of students.


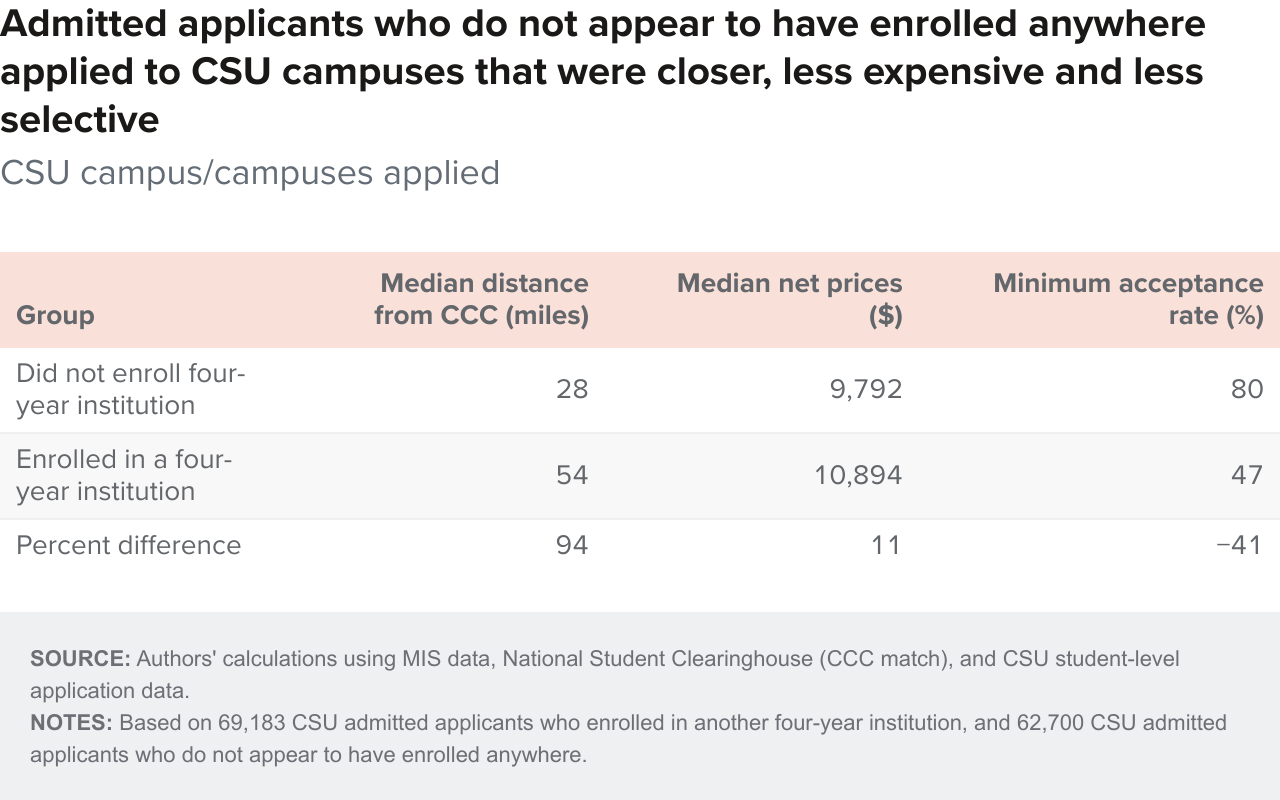
The story is different when we look at admittees who ended up not enrolling in any four-year institution (Table 1). We find that the median distance from applicants’ community college of attendance and the CSU campuses they applied to was significantly shorter for applicants without enrollments in any four-year institution compared to that for applicants with enrollments (28 vs. 54 miles). In terms of costs, we find that the net price of the campuses that students without enrollments in any four-year institution applied to was 11 percent lower than for students with enrollments in a four-year institution. Although we are not doing a causal examination, this analysis suggests that proximity and/or cost could have been deterrents for those who did not seem to have enrolled in any four-year institution.
Moreover, applicants without enrollments in any four-year institution applied to institutions that were less selective: the minimum acceptance rate of all the CSU campuses to which they applied was 80 percent. For those with four-year enrollments, the acceptance rate was 47 percent.
CCC Transfer Students Have High Graduation Rates
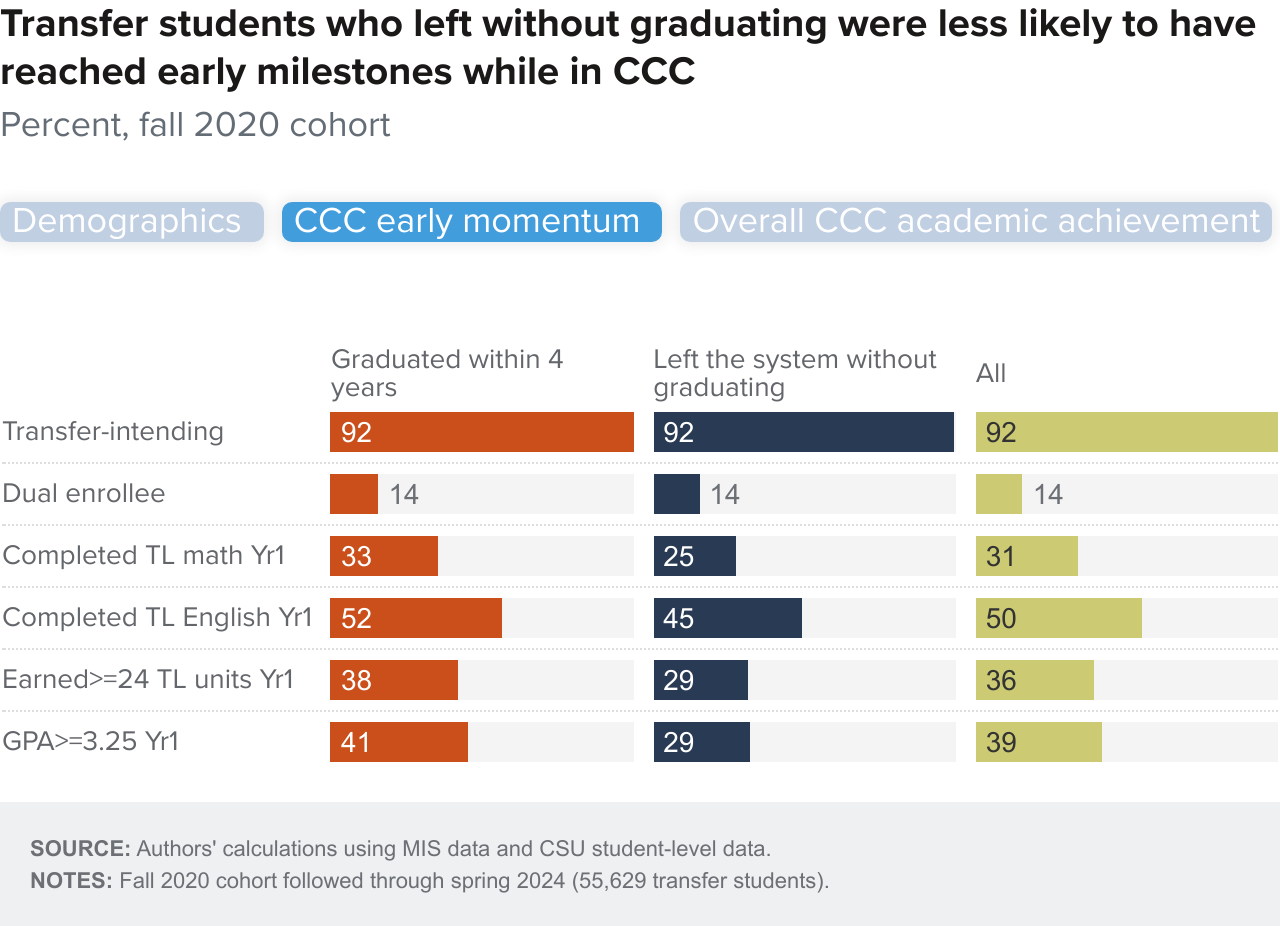
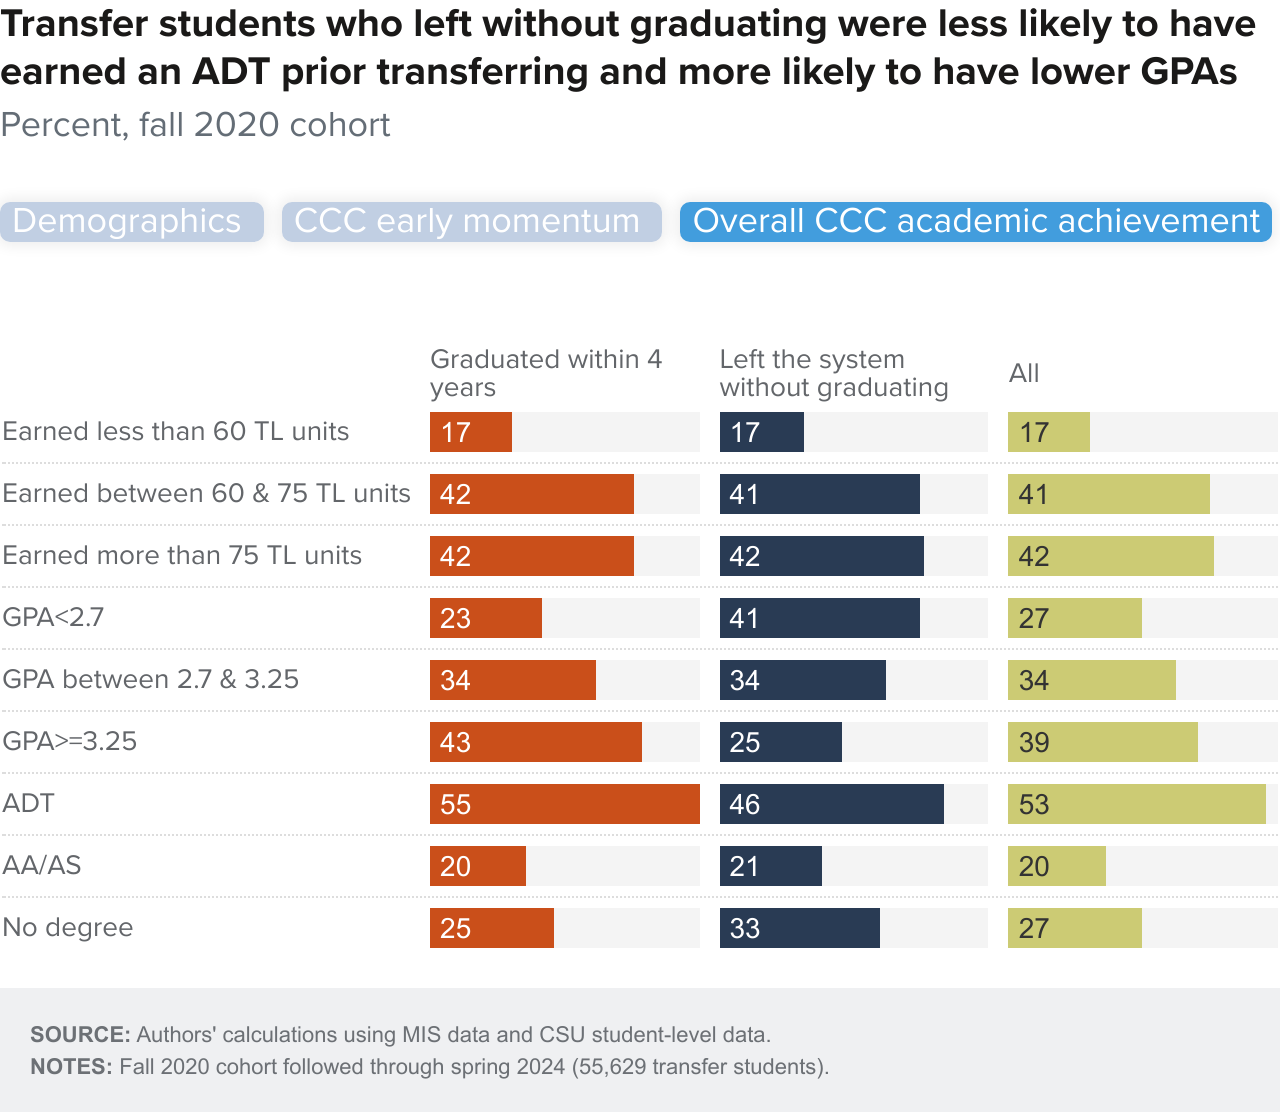
Students who transfer from CCC to CSU have high graduation rates, about the same as CSU students who persist to junior standing. Among the cohort of fall 2020 enrollees, 76 percent graduated with a bachelor’s degree by spring 2024, and of those 69 percent graduated within three years (Figure 13). Notably, the typical transfer student in the fall 2020 cohort, who graduated within three years, earned 48 units in CSU before graduating and the typical student who graduated in their fourth year earned 61 units (See Technical Appendix Figure B6). Meanwhile, the typical student who left the system without graduating (19%) did so after earning only 13 units.

Not surprisingly, we find that students with strong records of academic achievement while in CCC (including early momentum) were more likely than others to graduate and to do so within three years. Specifically, we find that having a CCC GPA of 3.25 or more, earning an ADT, and number of units accumulated in CCC are correlated positively with bachelor’s degree completion. Black, and older students were particularly less likely to graduate (Figure 14).

Time to graduation is a key concern for transfer students. Among those who were still enrolled after three years, we find that most were in computer science and engineering majors. This finding is consistent with the fact that there is no ADT for engineering. Engineering is a heavily sequenced and rigorous field, and the lack of an ADT pathway means that transfer students may face challenges in course articulation, credit transfer, and the availability of required lower division courses—all of which might slow down progress toward a bachelor’s degree.
Conclusions and Recommendations
A key component of the state’s higher education framework is the ability to transfer from the community college system to a four-year college. Our findings show that when the transfer pathway works, it works well. High graduation rates at CSU among successful transfers validate investments in improving access to this proven route to baccalaureate completion.
In this study, we find many encouraging results: the vast majority (92%) of community college transfer applicants are admitted to at least one CSU campus, and the large majority of those students choose to enroll in one of these campuses (69%). Importantly, the diversity of transfer students admitted and enrolled in CSU closely reflects the demographic composition of the state’s high school graduates. The ADT seems especially significant in improving admission and enrollment rates of transfer applicants. And the vast majority of transfers to CSU (69%) earn a bachelor’s degree within three years. However, as our previous research has shown, most students who wish to transfer never do, with large variation across racial and ethnic groups.
Multiple policies and programs have been enacted to improve transfer enrollment overall and for subgroups. These efforts span many points on the educational pathway, focusing on high school students to community college students who are nearing graduation. These ongoing efforts, in addition to the goals set forward in CSU’s new systemwide strategic plan, seem to be steps in the right direction. Our findings point to four important areas of opportunity:
Supporting early momentum in community colleges. Early in this report we showed that students who reached important milestones in their first year in CCC were able to apply for transfer sooner. Efforts to help students navigate and succeed during their first year should be prioritized. AB 705 implementation—which has helped many more students to complete introductory transfer-level math and English courses during their first year—and the expansion of dual enrollment, which allows high school students to take community college classes, have helped. But getting students to enroll in a full course load remains a challenge. The California’s Student Success Completion Grant is an important effort in this area but more efforts are needed. Better and more proactive advising, flexible scheduling, and increasing both on-campus work opportunities and work-based learning programs could potentially also help.
Understanding why some admitted students do not enroll. About 62,700 students (14% of admittees in our sample) were admitted to CSU but did not end up enrolling in any four-year college. Our data cannot determine precisely why these students did not enroll. Having information on the labor market outcomes of these students—as well as that for the roughly 59,000 ADT earners who do not apply/enroll—would help to explain students’ decisions and identify ways to help them find a place at CSU. Importantly, factors such as cost, selectivity, and proximity are ripe for inquiry and innovation. Our initial examinations suggest that these factors might deter many of these students in their pursuit for a bachelor’s degree, but more granular work is needed. A survey of students who were admitted but did not enroll could cast light on the primary barriers faced by these students.
Exploring campus-specific variation and student choice. Because there is high variation across individual CSUs in both acceptance and enrollment rates, the systems would benefit from a better understanding of challenges faced by specific CSU campuses and majors. Moreover, about 69,000 CSU-admitted applicants in our period of analysis decided to enroll in another four-year institution. Most (43,000) of those enrolled in UC, but many of the remaining 27,000 students enrolled in colleges with higher costs and lower graduation rates than CSU. Enhancing communication and support with prospective students throughout the matriculation process is one way to improve enrollment rates to CSU. In particular, CSU should actively and consistently provide information about the advantages of a CSU pathway, including low levels of student debt and high graduation rates. In the future, the state’s new Cradle to Career longitudinal data system should be leveraged to automate the admissions system, including alerting students about their eligibility for financial aid and safety net programs.
Ensuring more openings at the system’s most selective campuses and on-demand majors could be one way to improve transfer outcomes. Despite improvements, some CSU campus/majors continue to be impacted (Drummer 2025). From our analysis we know that some of the students who were never admitted to CSU were competitive applicants, but they applied to the most in-demand campuses (Cal Poly San Luis Obispo and San Diego State). With the goal of increasing capacity, further consideration should be given to strategies such as flexible course scheduling, co-locating CCCs and CSUs through shared campuses or satellite centers, and enhancing and expanding online degree programs. CSU’s new systemwide strategic plan aims to increase the flexibility of their offerings to better meet the needs of current and future students, including adaptive, personalized learning programs. Both co-location and online programs—which are gaining traction in some circles—have the potential not only to address capacity constraints that some CSU campuses/majors face but could also address location issues for students who cannot attend a college far from home. The efficacy of such innovations should be analyzed rigorously.
Ultimately, the biggest challenges in improving transfer from CCC to CSU are twofold. More California community college students must get to the point of applying to a four-year institution. And both CCC and CSU must work to ensure that students who have become transfer-eligible are able to successfully navigate the transfer process. The benefits of a four-year degree—both for individuals and the state—are notable and long-lasting. Improving the CCC to CSU transfer pathway is a critical way for California to spread those benefits widely.
Topics
Access Completion Equity Higher Education