
This year’s state legislative and congressional elections will be the first conducted under new district maps. The maps were drawn by the state’s independent redistricting commission, and they reflect the changes in population that have occurred since the previous lines were drawn in 2011.
We now have an official list of all the candidates running in these contests. While the new lines have shaken things up a little, particularly for incumbents, more notable is a decline in competitiveness in state assembly districts and an increasing focus on congressional contests.
Redistricting changes the political terrain, splitting some communities apart and binding others together for the first time. Redistricting in California can be particularly disruptive because the state’s independent commission ignores incumbency when drawing lines. Incumbents generally have an advantage in races, but they have built their coalitions on the old terrain. The new landscape may require them to run somewhere completely different, or to retire entirely from elected office.
This year, there is no incumbent running in 10% of congressional, a third of state assembly, and half of state senate contests—higher in each case than the average over the last decade. Among the incumbents who did decide to run, a third of their constituents are new on average. This weakens the power of incumbency and drives elections toward less predictable outcomes.
However, it’s important not to overstate this case, since the disruption to incumbents was actually greater in the last round of redistricting in 2012. That was the first redistricting conducted by California’s independent commission, a fairly radical change at the time, and it was coupled with the previously untested “top two” primary election system. Ten years ago, almost half (45%) of the typical incumbent’s constituents were new. There were also far more open seats (with no incumbent seeking reelection) for state assembly (35 in 2012 vs. 27 today) and Congress (9 vs. 5), with about the same number of open seats for state senate (9 vs. 10).
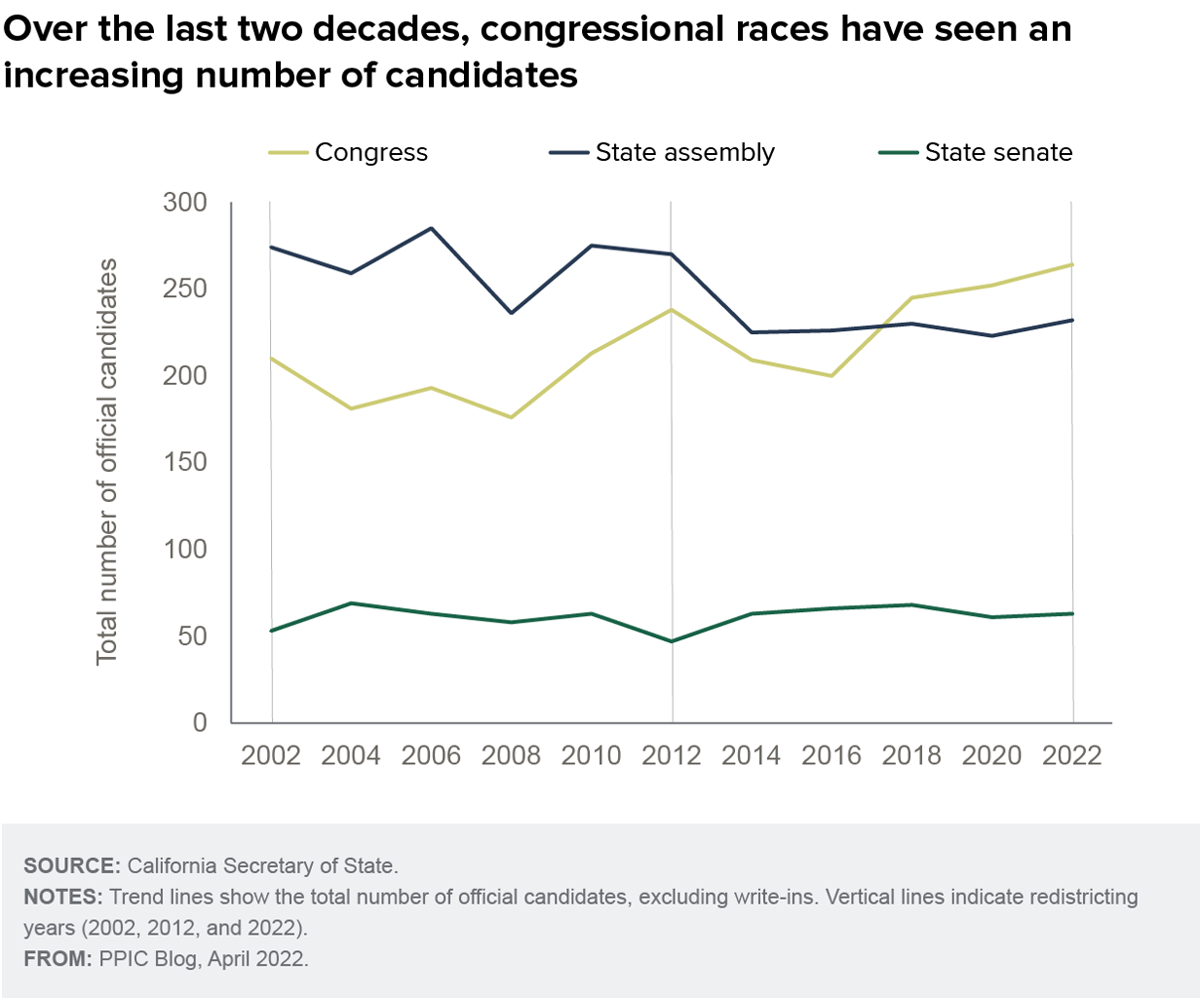
At the same time, the number of state assembly candidates willing to run at all shows signs of decline. The share of assembly races that are uncontested (i.e., candidates from only one of the two major parties are running) is about the same this year (26%) as in the last four elections (25%). But it is way up from the last redistricting election in 2012 (14%), and from the average of the decade before that (9%). The total number of state assembly candidates is also down, from an average of 266 in the first decade of this century (2002–2010), to 235 in 2012–2020, and 232 this year.
The attention has shifted instead to congressional races, as conflicts in Washington have consumed more attention in American politics. Only one congressional race in California is uncontested this year, just as in 2020. And the total number of congressional candidates has climbed from 195 per year (2002–2010) to 229 (2012–2020), to a high of 264 now. (Meanwhile, the total number of state senate candidates has been variable with no clear trend.)
Redistricting does add some uncertainty to California elections and helps shake up political representation in a way that is arguably healthy for democracy. But there are also worrying signs of declining competition in some state legislative races, and perhaps too much focus on US House contests instead. The roots of such shifts are likely complex and multifaceted, and PPIC will continue to explore these dynamics as the election year progresses.
Topics
Census decennial census elections Political Landscape political representation redistricting US Congress US House of RepresentativesLearn More
California’s Competitive House Districts
California’s Election Reforms at the Dawn of a New Decade
Understanding the Geography of California’s Final Redistricting Maps