Table of Contents
- Key Takeaways
- Introduction
- The Pandemic Prompted Quick and Lasting Changes in Law Enforcement Stops
- Assessing Racial/Ethnic Variation in Changes in Stops
- Examining Changes in Racial/Ethnic Disparities in Stop Outcomes
- Racial/Ethnic Disparities and Law Enforcement Officer Training
- Conclusions
- Notes and References
- Authors and Acknowledgments
- PPIC Board of Directors
- Copyright
Key Takeaways
California has taken several recent steps to address racial disparities in its criminal justice system. In 2015, the state legislature passed the Racial and Identity Profiling Act (RIPA), which requires detailed reporting on all pedestrian and traffic stops. We analyzed more than 15 million stops reported from 2019 to 2023 (the most recent year of data at time of analysis) by California’s 15 largest law enforcement agencies: 8 police departments, 6 sheriff’s departments, and the California Highway Patrol (CHP). Our aim is not to evaluate RIPA but to monitor changes in racial disparities in law enforcement stops.
- The number of stops by the 15 largest agencies dropped notably and quickly at the onset of the pandemic and stayed about one million below pre-pandemic levels in 2023. More than 60 percent of the decrease was in reported stops by the eight police departments.
- A million fewer stops overall mean fewer intrusive encounters—including searches, detention, use of restraints such as handcuffs, and incidents involving weapons—and less risk for both officers and community members. However, the possibility of unintended consequences of this reduction in stops should be considered, including its impact on crime and road safety.
- We find increases in the share of stops with searches, especially in stops made by police departments; we also find that the discovery rate increased. At the same time, stops with no enforcement dropped markedly across agencies. This suggests that stops were more selective and productive; it also points toward an increased likelihood of intrusive outcomes.
- We find significant decreases in racial disparities in the likelihood of being stopped, especially by police departments—for example, the difference between Black and white Californians dropped 57 percent. However, notable disparities remain. Black and Latino Californians continue to be stopped by police more often than white Californians. Asians experience the fewest stops per 100,000 residents across racial/ethnic groups.
- When it comes to experiences and outcomes during stops, our analysis—which makes statistical adjustments for key stop factors—reveals limited evidence of decreases in racial disparities. In stops made by police departments and CHP, Black and Latino Californians were no more likely than whites to be stopped with no enforcement (including warnings). However, Black and Latino Californians continue to be more likely than white and Asian Californians to have intrusive experiences—such as curbside detention and/or involvement of officer’s weapon—during stops by police, sheriff, or CHP.
- In addition to completion of RIPA-required officer training in racial and cultural understanding, we looked at use of force/de-escalation course-taking by officers in the 15 largest agencies. While trends are not consistent from year to year, officers have completed thousands of courses in these areas. A better understanding of the impact of investments in training would be helpful, as would identifying effective approaches.
Finally, we observed some patterns that point to the possibility that, at least temporarily, agencies may not have reported all stops. Efforts by the RIPA board and individual law enforcement agencies to ensure the completeness and fidelity of the reported data are crucial in preserving its value.
Introduction
California has taken steps in recent years to address racial disparities in its criminal justice system. Many Californians view the criminal justice system as biased against people of color, and this sentiment is especially prevalent among the state’s Black population. In recognition of the need for data and research on law enforcement stops, the state legislature passed the Racial and Identity Profiling Act (RIPA) in 2015. One key piece of the legislation—which was rolled out in waves based on the agency size, starting in 2018—requires all law enforcement agencies in California to begin collecting officer-perceived demographic and other detailed data for all pedestrian and traffic stops by 2023. The legislation also introduced officer training requirements on racial and cultural differences and established a board working to eliminate racial and identity profiling.
In this report, we analyze the most recent available data on more than 15 million stops over the five-year period (2019–2023) by the 15 largest law enforcement agencies that have reported stops since 2019: California Highway Patrol (CHP), eight police departments (Los Angeles, San Diego, San Francisco, Sacramento, Fresno, San Jose, Long Beach, and Oakland) and six county sheriff’s departments (Los Angeles, San Bernardino, Sacramento, San Diego, Riverside, and Orange Counties). We examine racial disparities in the likelihood of being stopped and having intrusive experiences, measured relative to the population; we also take a closer look at racial disparities in experiences and outcomes of individuals stopped by law enforcement officers.
Our work builds on our previous reports (Lofstrom et al. 2021 and Lofstrom et al. 2022), which analyze 2019 RIPA data and find that while differences in stop location and context—such as an outstanding warrant or a traffic violation—are significant drivers of racial disparities, notable inequities remain after accounting for such factors. This is the first research to examine whether racial disparities in law enforcement stops have decreased overall and across the three law enforcement agency groups.
Importantly, this report is not an evaluation of whether RIPA is achieving the goal of reducing racial disparities. Instead, we aim to examine and monitor changes in racial disparities in law enforcement encounters in the context of dramatic changes to the state’s criminal justice system during and in the wake of the pandemic. These changes make an evaluation of the RIPA legislation difficult. It is also important to note that this report does not evaluate the completeness or accuracy of the stops recorded, but that our examination of trends in the monthly number of stops reported reveals sudden swings that are seemingly unrelated to the pandemic. These swings (described in the text box below) may be related to lasting changes in driving patterns, new regulation of pretext stops, and changes in enforcement. However, they might point to incomplete or inaccurate reporting.
We begin by describing high-level trends in law enforcement stops between 2019 and 2023. We then examine racial disparities in changes in stops and stop outcomes—that is, changes in the likelihood of each racial/ethnic group being stopped and the experiences that follow. Next, we focus on changes in racial disparity in what happens during a stop and differences in the likelihood of being searched and other actions taken by the officer, including enforcement, followed by a high-level descriptive examination of requirements and completion of bias-related officer training.
The Pandemic Prompted Quick and Lasting Changes in Law Enforcement Stops
The pandemic brought serious challenges to the criminal justice systems, resulting in several local and state directives aimed at reducing the spread of the COVID virus that, in addition to local and state shelter-in-place orders and other directives, reduced law enforcement stops.
The Number of Stops Declined
In 2019 and early 2020, the monthly number of stops made by the 15 largest law enforcement agencies fluctuated between roughly 300,000 and 370,000. This quickly dropped well below 200,000 at the onset of the pandemic and averaged around 220,000 stops per month during its first year. It increased to 235,000 per month in 2022, on average, and rose to 247,000 in 2023, still 26 percent below 2019 monthly stops, translating to roughly a million fewer stops in 2023 (Figure 1). One important implication of this lasting change, at least as of 2023, is that there are many fewer intrusive encounters that carry risk for officers and Californians broadly.
Number of stops dropped quickly at the onset of COVID, and remained below pre-pandemic levels in 2023
Monthly number of stops

SOURCE: Author calculations using California Department of Justice, Racial and Identity Profiling Act (RIPA) data for the 15 largest law enforcement agencies, 2019–2023.
Law enforcement officers make stops for a variety of reasons, and while there were fewer stops for any reason in 2023 than 2019, stops motivated by several reasons declined by more than 50 percent—including consensual encounters resulting in a search (55.2%), student violations of school policy (53.4%), and stops of individuals on mandatory supervision, such as parole, probation, or post-release community supervision (52.4%; Technical Appendix Table A1). Stops for reasonable suspicion decreased by 44.5 percent. The smallest-percentage drops were in stops for outstanding warrants, stops of wanted individuals (20.5%), and traffic stops (22.4%). As a result, a higher share of stops overall were prompted by traffic violations and lower shares of stops were for reasonable suspicion, probation/parole supervision, and consensual encounters resulting in searches (Technical Appendix Figure A2).
Since agencies have substantially different primary missions, objectives, and jurisdictions, we examined stops by type of law enforcement: the statewide California Highway Patrol (CHP), city police departments, and county sheriff’s departments. The CHP is quite different from the other agencies; its mandate to enforce traffic laws and its statewide jurisdiction are reflected in the sheer number of stops it makes, as well as the reasons for these stops. Sheriff’s departments, which cover counties, and municipal police departments, responsible for incorporated cities, also enforce traffic laws but have a wider mandate to uphold public safety. Sheriff’s and police departments vary considerably in geography, the public safety environment, and the size, density, and racial/ethnic composition of the population.
The RIPA data shows that decreases in the number of stops vary notably across agency types. CHP had the smallest drop in stops (12.1%); sheriff’s department stops were down by 18.3 percent, while police department stops fell by 53.5 percent (Technical Appendix Table A2). The decreases also vary markedly across departments within each category of law enforcement. The San Francisco and Long Beach Police Departments reported the biggest drops (86.5% and 86.3%, respectively), while the Los Angeles and Riverside Sherriff’s Departments reported increases of 26.3 percent and 11.9 percent, respectively.
Across all agencies, the share of stops made by CHP increased from 54.4 percent in 2019 to 64.5 percent in 2023, and the share made by sheriff’s departments edged up from 14.7 percent to 16.2 percent (Technical Appendix Table A3). By contrast, stops made by police departments plunged from 30.8 percent to 19.3 percent of all stops.
There are a number of possible contributing factors to the notable decreases in number of stops, including the pandemic and the various local and state directives and policies implemented aimed at preventing the spread of the COVID virus. Other possible factors include protests in the wake of the George Floyd murder, limits to pretext stops and decreases in staffing.
Since levels of intrusiveness and the risk of escalation and use of force vary across both the reasons for stops and agencies (Lofstrom et al. 2021), it is likely that these notable compositional changes in stops have led to changes in stop experiences, intrusiveness, and risks.
Stop Outcomes Also Changed
The share of stops in which an officer searched the individual for contraband (such as weapons and drugs) has decreased somewhat, from 11.3 percent in 2019 to 10.5 percent in 2023 overall among the 15 largest agencies (Technical Appendix Table A6). The combined effects of the decline in the search rate and the drop in the number of stops mean that there were about 142,000 fewer Californians experiencing searches for contraband by law enforcement in 2023 compared to 2019 (Technical Appendix Table A4). The decrease in the overall search rate was driven by the decrease in number of stops by police departments, the agency group with the highest search rate. While the number of searches in stops by police departments fell by almost 137,000 between 2019 and 2023, the share of stops involving a search increased from 23.6 percent to 26.9 percent. The search rate in stops by CHP also increased (from 1.6% to 2.9%), while for sheriff’s departments it decreased from 21.4 percent to 21.1 percent.
Importantly, the share of searches in which a police officer found contraband (known as the discovery rate) rose from 23.2 percent in 2019 to 27.1 percent in 2023. The sheriff’s department discovery rate also increased, from 20.2 percent to 23.8 percent, while the increase in the CHP search rate coincided with a decrease in the discovery rate, from 11.1 percent to 9.7 percent. Overall, the discovery rate increased (from 21.4% to 23%), driven by an increased weapon discovery rate in police stop searches (from 4.8% to 7.7%) and a higher drug discovery rate in sheriff’s searches (14.0% to 16.1%). The net effect of fewer stops and searches with an increase in the discovery rates is fewer contrabands found, including about 1,200 fewer incidents where weapons were found (Technical Appendix Tables A4–A9).
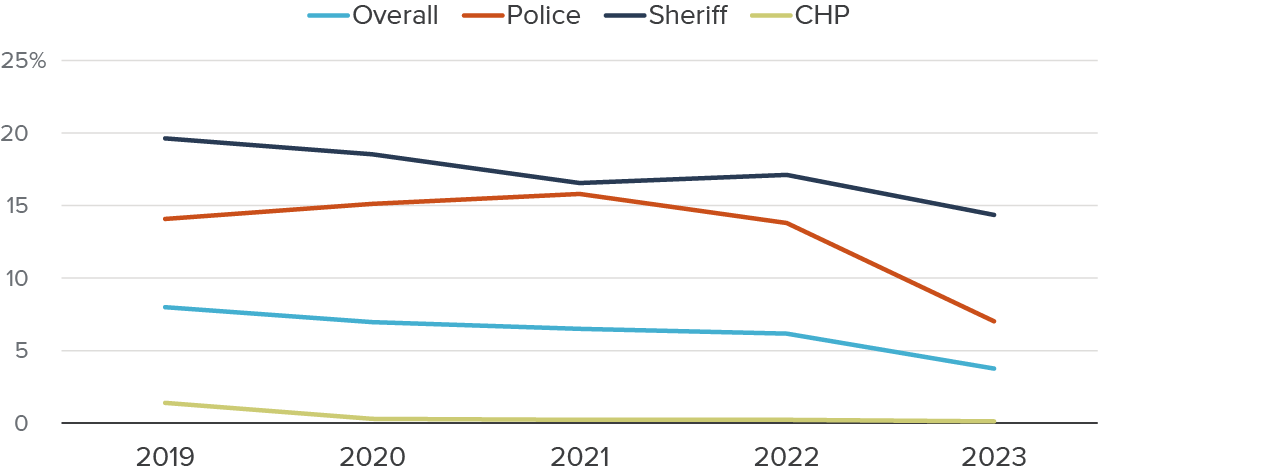
Another notable change is a reduction in stops that do not result in any enforcement, including warnings. No-enforcement stops represented 8.0 percent of stops overall in 2019, but only 3.8 percent of all stops in 2023 (Figure 2). As a result, about 208,000 fewer individuals were stopped by law enforcement without receiving a warning or any other enforcement. The decrease in no-enforcement stops can be seen across agency groups; the sharpest decreases are in police departments (from 14.1% to 7%) and sheriff’s departments (19.6% to 14.4%). The share of no-enforcement stops by CHP officers was very small in 2019 (1.4%), and it fell to 0.1 percent in 2023. This suggests that officers were more selective in stop decisions in 2023 than 2019, and as a result, more stops resulted in enforcement. For example, the share of all stops resulting in at least a citation grew from 64 percent to 65.7 percent over this period, and those resulting in a jail booking increased from 6.6 percent to 7 percent (Technical Appendix Tables A10–A14).
The share of stops with no enforcement dropped markedly between 2019 and 2023
Share of stops without any enforcement
SOURCE: Author calculations using California Department of Justice, Racial and Identity Profiling Act (RIPA) data for the 15 largest law enforcement agencies, 2019–2023.
At the other end of the scale, while fewer stops in 2023 resulted in intrusive experiences, such as curbside detainment, handcuffing, or the involvement of an officer’s weapon, the share of stops involving such experiences increased across agency types (Technical Appendix Table A15). For example, in stops by police departments, the number of incidents where individuals were detained curbside decreased by about 170,000, while the share of stops with curbside detentions increased from 30.8 percent to 36.4 percent. The number of stops by sheriff’s departments involving curbside detention decreased by almost 16,000; combined with a greater decease in the number of stops, this translates to an increase in the share of these stops from 26.3 percent to 29 percent. The number of curbside detentions by CHP increased by almost 29,000; the share went up from 1.7 percent to 3.5 percent. These patterns hold across our different measures of intrusiveness (Technical Appendix Tables A15–A18).
In sum, the overall decrease in stops between 2019 and 2023 has led to notably fewer intrusive and risky encounters. At the same time, of those stopped, we find that searches became more frequent, especially in stops made by police departments and the discovery rate increased. We also find that in these more selective stops, the likelihood of intrusive experiences, such as curbside detention, increased.
Assessing Racial/Ethnic Variation in Changes in Stops
While it is important to track overall changes in law enforcement stops, it is also essential to understand how racial disparities in stops and subsequent experiences have been affected. When it comes to stops overall, Black Californians saw the biggest percentage drop, while Latinos experienced the smallest decrease. Overall, Black individuals saw 37.6 percent fewer stops in 2023 compared to 2019; this means that about 239,000 fewer Black individuals were stopped (Technical Appendix Table A1). The drop, measured as a percentage, was greatest in consensual encounters leading to searches (67.2%) and stops of individuals on correctional supervision, such as parole and probation (65.4%). The smallest declines were in traffic stops (32.5%) and stops involving warrants or a wanted individual (33.2%).
Meanwhile, stops of Latinos declined by only 16.1 percent; stops involving warrants/wanted status decreased by 6.6 percent and stops for traffic violations fell by 14.1 percent, while consensual encounters leading to searches and stops of individuals on correctional supervision dropped by 44.7 percent and 36.6 percent, respectively. While these are the smallest decreases across racial/ethnic groups, the decrease translates to 250,000 fewer stops of Latinos in 2023 compared to 2019.
Overall stops of Asians declined 24.6 percent, representing about 56,000 fewer stops. Only 6 percent of all stops in 2023 were reported by officers as Asians. The percentage decrease in stops of white individuals was the second largest, 34.3 percent; almost 454,000 fewer whites were stopped in 2023 than in 2019 (Technical Appendix Table A1).
While the percentages vary, patterns of decreases in stops by reason were similar across racial/ethnic groups: the largest declines were in consensual stops leading to searches and in stops of individuals on correctional supervision, and the smallest drops were in traffic stops and stops involving warrants or wanted individuals.
The Number of Black Californians Experiencing Intrusiveness during Stops Has Decreased
The stop data clearly shows decreases in stops overall for all racial/ethnic groups, but there are differences in overall magnitude and across reasons for the stops. Both are likely to be factors in differential changes in the outcomes of law enforcement stops.
Starting with searches, we find that Black Californians saw the biggest change, with almost 57,000 fewer searches in 2023 compared to 2019 (a 43.5% decline); that decrease in the number of searches was greater than declines among whites (about 47,000, or 43.6%) and Latinos (about 32,000, or 16.9%), two substantially larger racial/ethnic groups (Technical Appendix Table A15). Searches of Asian Californians declined by 2,500 (26%) from 2019 to 2023.
The data also shows that other intrusive stop outcomes decreased the most for white and Black individuals (in terms of both numbers and percentages), although the greatest decreases are mostly among whites. The smallest percentage declines were among Latinos. For example, the number of white and Black individuals who were handcuffed decreased by roughly 29,000 and 26,000, respectively (33.3% and 28.6%), while stops involving officer weapons declined by 1,200 for white individuals and 1,300 for Black Californians (34.7% and 25.1%, respectively). Latinos, however, saw hardly any decrease in the number of individuals handcuffed during a stop, down by only 900, or 0.7 percent. Incidents involving officer weapons did go down notably, by almost 1,200 (15.8%). For Asians, decreases in intrusive experiences were greater than declines among Latinos but not as large as decreases among white and Black Californians.
Stops of Black Californians by police officers have declined most sharply
Like the decreases in the number of stops, changes in racial disparities in stop outcomes from 2019 to 2023 differ across agency types. In stops made by the eight largest police departments, Black and Latino Californians experienced the biggest decreases in the number of stops, searches, stops with no enforcement, and most intrusive experiences, while Asians continue to experience fewer stops than other racial/ethnic groups (Technical Appendix Tables A1, A12, and A18). For example, the number of stops of Black and Latino individuals made by police officers decreased by about 191,000 and 220,000, respectively; 180,000 fewer white individuals were stopped (Figure 3). There were 54,000 fewer police searches of Black individuals, compared to 48,000 and 28,000 for Latino and white Californians. The number of no-enforcement stops of Black individuals by police officers plummeted by about 50,000, from about 61,000 in 2019 to 11,000 in 2023, and by about 48,000 and 26,000 for Latinos and whites. Similarly, the decreases in intrusive stops by police departments were greatest for Black Californians: these stops declined by 58,000, compared to 54,000 and 47,000 for Latinos and whites (Technical Appendix Table A18).
Black Californians saw the biggest numerical drops in police stops, searches, stops with no enforcement, and intrusive experiences

SOURCE: Author calculations using California Department of Justice, Racial and Identity Profiling Act (RIPA) data for the 15 largest law enforcement agencies, 2019–2023.
Decreases in stops and outcomes by CHP and sheriff’s departments from 2019 to 2023 are not only smaller (as noted above); they are also primarily driven by decreases in stops of white Californians (see Technical Appendix A for differences in enforcement and intrusiveness across all agency groups and years by race). For example, the decreases in the number of stops of white individuals made by CHP and the six largest sheriff’s departments were about 194,000 and 79,000 respectively, far larger than the drops in stops of Black, Latino or Asian Californians (see Technical Appendix Table A20). These patterns carry over to changes in stop outcomes across racial/ethnic groups.
While the greater decrease in number of police stops and intrusive experiences of Black individuals strongly points toward decreases in racial disparity between Black and white individuals in these jurisdictions, it is unclear if this holds for stops of Black Californians by other law enforcement agencies or for Latinos and Asians stopped by any agency type.
Population-Adjusted Changes in Stop Rates and Outcomes across Racial/Ethnic Groups
We can plausibly assume that Black Californians represent a smaller share than white Californians of those subject to stops by law enforcement by the eight police jurisdictions, given that Black individuals represent less than 6 percent of the state population. This means that the patterns outlined above point toward relatively greater decreases in the likelihood of Black Californians being stopped and experiencing an intrusive outcome as compared to white Californians. However, because Latinos represent a higher share of the population than whites in some cities, and Asians make up mostly smaller shares and experience fewer stops than whites, the same conclusion cannot be drawn for these demographic groups. Similarly, the differential changes across racial/ethnic groups in stops made by sheriff’s departments and CHP also make it difficult to determine whether racial disparities in the likelihood of being stopped and having intrusive experiences have changed.
Ideally, we would assess this by analyzing data that accurately reflects the race/ethnicity of the population at risk of being stopped by law enforcement officers—including individuals who reside in the jurisdiction but also those who spend time there (such as commuters, tourists, and visitors from nearby areas). Unfortunately, such data are not available, so we instead use demographic data to calculate the number of stops and stop outcomes per 100,000 residents by race/ethnicity in each jurisdiction. For stops made by CHP we use statewide demographics, while for the six sheriff’s departments we use county-level demographics for each county, and for the eight police departments we use city-level demographics.
Our population-adjusted measures show that while disparities in stops made by police departments narrowed most between Black and white individuals, notable gaps persist (Figure 4). For example, the Black-white gap in police stops decreased from 32,750 stops per 100,000 residents in 2019 to 14,120 in 2023 (by 56.9%). The biggest percentage decrease in Black-white gaps was in the rate of no-enforcement stops: this gap narrowed by 80.7 percent (from 7,109 to 1,370 per 100,000 residents). The Black-white gap in searches and other intrusive police stop outcomes, such as being detained curbside, also narrowed markedly (by 49.1% and 44.2%, respectively).
The Black-white gaps in stops made by the six sheriff’s departments—which are notably smaller than the gap in stops made by police departments—also narrowed between 2019 and 2023. For example, the Black-white gap in stops decreased by 12.3 percent, from 3,433 in 2019 to 3,012 in 2023, while the no-enforcement gap narrowed from 881 to 660 (by 25%). The Black-white gap in CHP stops without any enforcement was essentially closed by 2023, decreasing from 65 per 100,000 residents in 2019 to 4 in 2023. The Black-white CHP stop rate gap, however, increased by 9.2 percent, from 4,392 to 4,796.
Gaps between Latinos and whites in stops made by the eight police departments—which continue to be smaller than Black-white gaps—were narrower in 2023 but remained substantial. The Latino-white gap in stop rate decreased from 3,251 per 100,000 residents in 2019 to 3,033 in 2023 (a 6.7% decrease). The Latino-white gap in no-enforcement stops narrowed from 679 to 192 (by 71.6%). Latino-white gaps in both stops by sheriff’s departments and intrusive outcomes widened between 2019 and 2023; however, these gaps are roughly one fifth of Black-white gaps. Latino-white gaps are smallest in stops made by CHP but are also increasing.
Racial/ethnic gaps in police department stops, searches, stops with no enforcement, and intrusive experiences have narrowed

SOURCES: Author calculations using California Department of Justice, Racial and Identity Profiling Act (RIPA) data for the 15 largest law enforcement agencies, 2019–2023 and population data from the California Department of Finance and United States Census.
Examining Changes in Racial/Ethnic Disparities in Stop Outcomes
A key question is whether, among those stopped by law enforcement officers, racial disparities in outcomes and experiences changed over the five-year study period. Our previous work (Lofstrom et al. 2021) showed that context (such as the reason for a stop), the agency involved, and the location of a stop are important contributors to racial disparities, but also that racial disparities in stop outcomes and experiences persist when these factors are accounted for, especially for Black Californians.
In this section, we account for such factors and examine changes in racial/ethnic disparities (see Technical Appendix B for a discussion of our methodology). We focus here on Black, Latino, and Asian Californians relative to white Californians, as these are the state’s largest racial/ethnic groups, and therefore allow sufficiently large numbers of observations for reliable statistical analysis across outcomes (with the possible exception of relatively rare incidents of stops involving weapons) and law enforcement agencies.
Racial/Ethnic Disparities in Search Rates
Starting with disparities in search rates, Black individuals were about 7.6 percentage points more likely to be searched during police stops in 2019; this Black-white gap widened by a statistically insignificant 0.9 percentage points in 2023 (Figure 5). The Black-white search rate disparity also increased in stops made by sheriff’s departments and CHP, from 0.4 to 3.1 percentage points and 0.1 to 0.7 percentage points, respectively. The Latino-white police search rate disparity narrowed, from 4.8 to 4.3 percentage points (although the change is not statistically significant), while the gaps in stops made by sheriff’s departments and CHP widened, from 0.5 to 1.7 percentage points and 0.4 to 0.9 percentage points, respectively. Asian individuals continue to be less likely to be searched compared to whites in stops made by all three agency groups, and increasingly so in stops by CHP.
Black and Latino Californians remain more likely to be searched than whites, while Asians are less likely
Search rate disparity

SOURCE: Author calculations using California Department of Justice, Racial and Identity Profiling Act (RIPA) data for the 15 largest law enforcement agencies, 2019–2023.
NOTES: Estimates based on regression results shown in Technical Appendix Tables A23–A25.
Search discovery rates continue to vary across racial/ethnic groups
A key finding in our previous work on racial/ethnic disparities in law enforcement stops (Lofstrom et al. 2021) was that while Black and Latino Californians were more likely to be searched than white individuals, the likelihood of contraband discovery was lower for Black and Latino individuals than for white individuals. This held true in 2023, with one exception: compared to police searches of white individuals, police searches of Black individuals were 1.5 percentage points less likely to yield contraband in 2019, but 0.7 percentage points more likely to yield contraband in 2023 (Figure 6).
The discovery rates in searches of Black and Latino Californians continue to be lower than that of whites in stops made by sheriff’s department officers, and the gaps widened from -2.5 and -1.6 percentage points, respectively, in 2019 to -4 and -2.8 percentage points in 2023. The disparities in contraband discovery between Black and Latino individuals relative to whites also increased in CHP stops. Across agencies, our estimates show that Asians are less likely to be searched than whites, and the likelihood of contraband discovery in searches of Asians is lower.
Police department searches of Black individuals were more likely to yield contraband than searches of whites in 2023
Discovery rate disparity

SOURCE: Author calculations using California Department of Justice, Racial and Identity Profiling Act (RIPA) data for the 15 largest law enforcement agencies, 2019–2023.
NOTES: Estimates based on regression results shown in Technical Appendix Tables A23–A25.
Black individuals are no longer more likely to be stopped by police without any enforcement
Our analysis reveals notable decreases in no-enforcement stops of Black Californians; in 2023, there was no statistically significant overall difference between Black and white individuals. This decrease is driven by police stops: the gap between stops of Black Californians and stops of whites—which was 5.6 percentage points in 2019—was closed in 2023. Similarly, we estimate that for Latinos, the likelihood of a no-enforcement rate went from 1.5 percentage points higher to 1.2 percentage points lower than the likelihood for white individuals.
In contrast, our estimates of the gaps in sheriff’s department stops point toward possible increases in the likelihood of no-enforcement stops for Asians, Blacks, and Latinos compared to whites, although the increase is only marginally statistically significant for Blacks (the difference in 2019 was not statistically significant) and in 2023, Asians and whites were equally likely to be stopped with no enforcement. Latinos, however, were about 1.4 percentage points more likely than whites to be stopped by sheriff’s department officers without any enforcement in 2023. CHP officers make very few no-enforcement stops and there are very small if any differences across racial/ethnic groups (Figure 7).
In police and CHP stops, Black and Latino Californians are no more likely than whites to be stopped with no enforcement
No enforcement disparity

SOURCE: Author calculations using California Department of Justice, Racial and Identity Profiling Act (RIPA) data for the 15 largest law enforcement agencies, 2019-2023.
NOTES: Estimates based on regression results shown in Technical Appendix Tables A23–A25.
Black and Latino individuals are increasingly more likely to experience intrusive stops
The RIPA data allows for analysis of the level of intrusiveness individuals experience during a stop, ranging from verbal communication to curbside detention, patrol car detention, being handcuffed, and the involvement of an officer’s weapon. As in our previous research, we have ordered stop outcomes from less to more intrusive, where each level represents the individual experiencing at least that level of intrusiveness.
Our analysis shows similar patterns across levels of intrusiveness and across agency types: Black and Latino Californians continue to be more likely to experience intrusiveness than whites, and the disparities widened between 2019 and 2023. For example, in stops by police, Black and Latino individuals were both 2.6 percentage points more likely to experience at least a curbside detention during a stop than white individuals in 2019, and these gaps grew to 5.1 and 3.9 percentage points in 2023 (Figure 8). In stops by sheriff’s departments, the gaps widened from 0.7 percentage points and no difference in 2019 to 4.2 and 2.1 percentage points, respectively. While curbside detention gaps are much smaller in CHP stops in 2023 (0.5 and 0.4 percentage points), in 2019 both Black and Latinos were 0.3 less likely to be detained curbside. Asian individuals continue to be less likely than whites to experience curbside detention than whites in stops made by all three agency groups.
The likelihood of curbside detention is higher in stops of Black and Latinos compared to whites
Curbside detention disparity

SOURCE: Author calculations using California Department of Justice, Racial and Identity Profiling Act (RIPA) data for the 15 largest law enforcement agencies, 2019–2023.
NOTES: Estimates based on regression results shown in Technical Appendix Tables A23–A25.
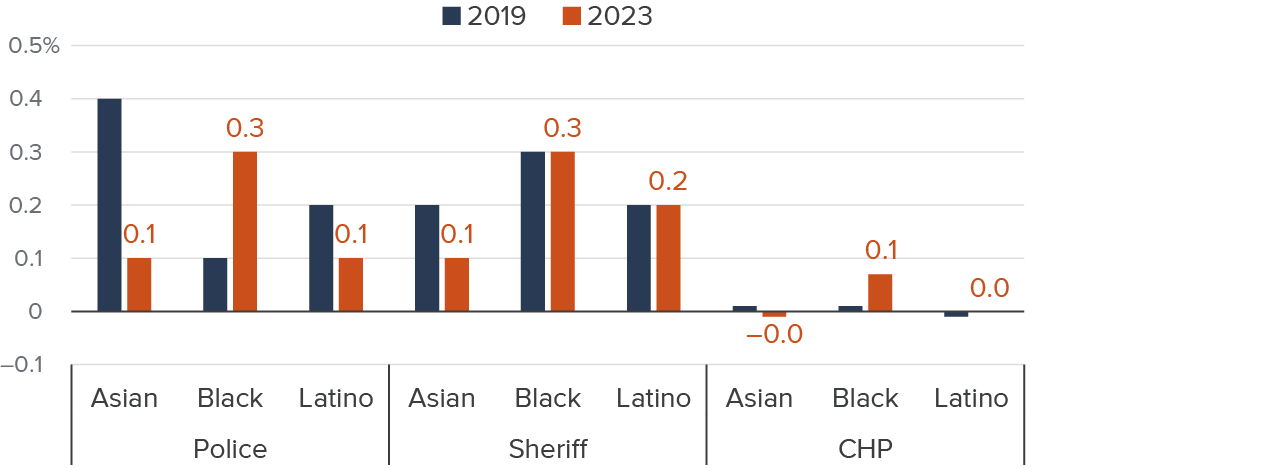
Overall, only about 0.4 percent of stops involved an officer’s weapon (such as aiming a firearm, but not necessarily firing it) in both 2019 and 2023. Not surprisingly, given differences in mandates and jurisdictions, this rate varies across agency groups. The likelihood of a police stop involving an officer’s weapon increased from 0.9 to 1.4 percentage points between 2019 and 2023, and from 0.05 to 0.09 percentage points in CHP stops. A lower share of stops by sheriff’s departments involved an officer’s weapon in 2023 (0.66 percentage points) than in 2019 (0.81 percentage points).
Our estimates of the differences across race/ethnicity in the likelihood of a stop involving an officer’s weapon show that this likelihood, in stops by police departments of a Black Californian, increased over this period relative to whites, from 0.1 percentage points to 0.3 percentage points and in CHP stops, from 0.01 percentage points to 0.07 percentage points, while staying at 0.3 percentage points in sheriff’s department stops. While the likelihood of a police stop involving an officer’s weapon continued to be greater for Latinos and Asians than for whites in 2023 (by 0.1 percentage points for both groups), the gaps narrowed by 0.1 and 0.3 percentage points, respectively. The difference in likelihood of officer weapons being in involved in CHP stops of Latino, Asian, and white individuals continued to be statistically insignificant in 2023 (Figure 9).
The disparities in the likelihood of an officer’s weapon being involved widened in police and CHP stops of Black individuals
Officer weapon rate disparity
SOURCE: Author calculations using California Department of Justice, Racial and Identity Profiling Act (RIPA) data for the 15 largest law enforcement agencies, 2019–2023.
NOTES: Estimates based on regression results shown in Technical Appendix Tables A23–A25.
Racial/Ethnic Disparities and Law Enforcement Officer Training
We next explore training data from the California Commission on Peace Officer Standards and Training (POST) to examine recent trends in trainings related to racial, identity, and cultural differences of communities and de-escalation/use of force. The extent to which officer bias contributes to racial disparities is of value to policymakers seeking to address it. If law enforcement bias is indeed contributing, required training may help reduce racial disparities in stops and outcomes. Use of force/de-escalation training may be another approach that can reduce injuries to officers and individuals stopped and reduce racial disparities. We begin by discussing training changes contained in the Racial and Identify Profiling Act of 2015, then examine the RIPA required training course completions and completions of de-escalation/use of force courses using POST data.
RIPA Requires Officer Training
In addition to mandating stop data collection, AB 953 instituted new training requirements for law enforcement officers. Specifically, officers are required to complete a course covering racial and cultural differences during their basic law enforcement training and take a refresher class every five years. Courses satisfying this requirement must “stress understanding and respect for racial, identity, and cultural differences, and development of effective, non-combative methods of carrying out law enforcement duties in a diverse racial, identity, and cultural environment.” The California Commission on Peace Officer Standards and Training (POST) ultimately designed and designated training courses that satisfy the new requirements (see California Penal Code 13519.4 for additional information).
POST has final authority over the training requirements, though the RIPA Board is required to analyze and make recommendations related to POST’s racial and cultural differences courses. Starting with the first report in 2018, the annual RIPA Report has included a section that offers these recommendations. This collaboration has led to changes in existing courses and the development of new courses.
The original training refresher approved by POST was a video-based course entitled “Bias-Based Policing: Remaining Fair and Impartial.” The two-hour course contained four scenes of possible bias in law enforcement stops.
At the end of 2023 (the most recent year of data), there were three POST classes that would satisfy the training requirement for in-service officers:
- “Principled Policing: Implicit Bias and Procedural Justice,” an eight-hour course delivered through an in-person, group class format;
- “Bias and Racial Profiling,” a two-hour video-based course delivered through POST’s online learning portal; and
- “PSP: Strategic Communications,” a three-hour video-based course that is also delivered through POST’s online learning portal.
Because POST makes training data available through their online data portal, we can determine how many individuals took each course across agencies in a given year. While we can investigate the number of course completions for the largest 15 agencies, it is important to note that we do not have individual-level training data. Furthermore, our analysis also includes courses related to de-escalation and use of force.
RIPA-Required Course Completion Has Increased Over Time
In addition to the courses that satisfy the RIPA training requirement, POST offers additional courses relating to community interactions and RIPA requirements. This wider set of courses offers a fuller picture of course completion. Our expanded look at training includes 10 POST courses that we classify as related to racial and cultural differences and community policing (see Technical Appendix C for the full list).
From Figure 10, we can see that course completion in this area was minimal in 2018 and 2019 but began to climb starting in 2020. In 2020, nearly 5,000 courses had been completed by CHP officers. Given that CHP as a whole has about 7,000 sworn officers, this number is significant. Between 2021 and 2022, about 6,400 courses were completed by CHP officers, about 7,000 courses were completed by officers in the eight police departments in our analysis (which have about 16,500 officers combined), and nearly 8,200 courses were completed by officers in the six sheriff’s departments (with about 18,500 officers combined). Given that RIPA requires officers to undertake the training requirement every five years, we might expect to see a big push to get officers to complete the required training early in the five-year period, followed by a drop in completions as most of the officers would have satisfied the requirement for the five-year window. Overall, from 2018 to 2024, over 33,000 courses were completed in this area across the state’s 15 largest agencies.
RIPA required trainings increase dramatically in 2021
Course completions

SOURCE: Author calculations using POST annual training data.
NOTES: See Technical Appendix C for the full list of courses included in the calculation. POST data is reported by fiscal year, so FY2018 stands for fiscal year 2018.
De-escalation and Use-of-Force Course-Taking Also Increased
In addition to courses related to RIPA requirements, it is also important to look at the number of courses completed related to officer use of force and de-escalation. Officer use of force has been a major issue over the last several years, prompted by high-profile incidents such as the murder of George Floyd in 2020. RIPA data allow us to see outcomes of force across stops, and we might expect this type of training to have an effect on the use of force. We identified 10 POST courses as related to use of force and/or de-escalation (see Technical Appendix C for the full list).
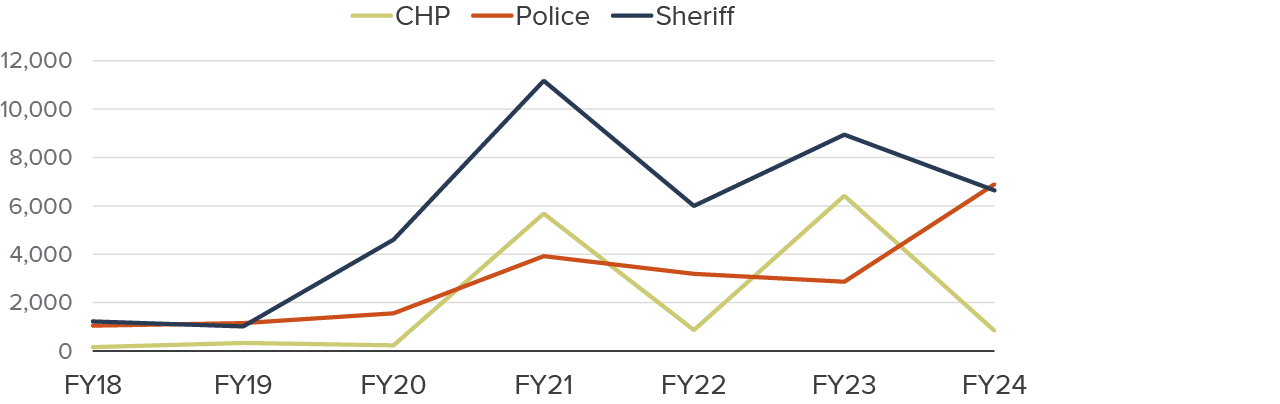
Like the RIPA related training discussed above, training in use of force and de-escalation increased dramatically starting in 2021, even though more training was completed in this area before 2021, compared to the RIPA courses shown in Figure 11. In 2021, over 20,000 courses were completed by officers across all three agencies (CHP, police, and sheriff); the sheriff’s departments accounted for over 11,000 of those completed courses. Unlike RIPA-related course-taking, which spiked in 2021 and then dropped steadily, course completion in this area surged in 2021 and 2023, with dips in 2022 and 2024. It could be that departments require some type of use-of-force or de-escalation training as part of the required 26 hours of continuing education mandated by POST for each officer over a two-year period. Overall, we see nearly 75,000 completed courses (CHP: 14,500; police: 20,600; sheriff: 39,500) in this area.
Use-of-force and de-escalation training increased dramatically in 2021
Course completions
SOURCE: Author calculations using POST annual training data.
NOTES: See Technical Appendix C for the full list of courses included in the calculation. POST data is reported by fiscal year, so FY2018 stands for fiscal year 2018.
Conclusions
As part of its recent efforts to address stark racial disparities in its criminal justice system, California enacted the Racial and Identity Profiling Act (RIPA) in 2015. In addition to requiring officer training on racial and cultural differences and establishing the RIPA Board, the law requires law enforcement agencies to collect perceived demographic and other detailed data for all pedestrian and traffic stops.
To inform discussions about reducing racial inequity in California, we have been monitoring racial disparities in law enforcement stops. For this report, we analyzed data on 15.5 million stops over the five-year period from 2019 through 2023 by officers in the 15 largest law enforcement agencies: the statewide CHP, six county sheriff’s departments and eight city police departments.
Importantly, our aim is not to evaluate RIPA. Instead, our goal is to use RIPA data to examine changes in racial disparities in law enforcement encounters, which is particularly important in the context of dramatic changes to California’s criminal justice system in the wake of the pandemic (see for example Harris 2023; Premkumar et al., 2023; Lofstrom and Martin 2024).
The RIPA data clearly shows that the number of law enforcement stops dropped quickly and notably at the onset of the pandemic; in 2023, these stops remained 25.7 percent below 2019 levels (about one million fewer per year). In addition to the pandemic, protests in the wake of the George Floyd murder, limits to pretext stops, and decreases in police staffing are all possible contributing factors.
A million fewer stops overall mean many fewer intrusive and risky encounters for both officers and community members. More than 60 percent of the overall decrease was in reported stops by the eight largest police departments, meaning that the biggest drops were in the cities where these departments were located, and that the composition of stops shifted. The share of all stops made by police departments dropped from 30.8 percent to 19.3 percent.
We also find that among those stopped, searches became more likely, especially in stops made by police departments; we also found that the search discovery rate increased. The data shows that across agency types, stops that led to no enforcement dropped markedly, but so did the likelihood of intrusive experiences. Both of these findings could be signs that officers are being more selective in the stops they make.
Our analysis points toward the narrowing of racial disparities in the likelihood of being stopped and having intrusive experiences, especially the gap between Black and white Californians; this narrowing was driven mostly by decreases in stops made by the eight police departments included in our study. This suggests that a shift toward more selective stops has disproportionately affected Black individuals. Indeed, in 2023 Black and Latino individuals were no more likely than white individuals to be stopped by police or CHP without any enforcement (including a warning).
Aside from this finding, our analysis of experiences during a stop, which makes statistical adjustments to key factors such as stop context, location, and specific law enforcement agency, reveals only limited evidence of decreases in racial disparities. We find that Black and Latino individuals continue to be more likely to be searched than white individuals across agency types, the disparity has widened somewhat, with the exception of Latinos stopped by police. At the same time, searches of Black, Latino and Asian individuals continue to be less likely to yield any contraband, with one notable exception: in searches of Black individuals during police stops, the discovery rate in 2023 was higher than the rate for searches of white individuals.
Furthermore, overall and for all three agency groups, we find that Black and Latino individuals are increasingly more likely to have intrusive experiences during a stop, including being detained curbside or handcuffed, compared to white individuals. Asian Californians, however, continue to be less likely to have such experiences compared to whites. While stops involving officer weapons remain relatively rare (and weapon firing incidents are even more uncommon), Black and Latino Californians continue to be more likely to experience this level of intrusiveness than whites.
One notable finding is that in police and CHP stops, Black and Latino Californians were no more likely than whites to be stopped with no enforcement in 2023, but Black, Latino and Asian individuals stopped by the six sheriff’s department in 2023 were more likely to be stopped without any enforcement than whites, while in 2019 they were less likely.
While our analysis points toward some improvement, driven mostly by decreases in stops made by the eight police departments included in our study, it does not reveal broad and meaningful narrowing of disparities in experiences between Black and Latino Californians relative to white individuals who are stopped. It would be helpful to have a better understanding of the impact of investments in officer training on these inequities, and efforts to evaluate and identify effective evidence-based approaches are needed. Data shows that officer training in racial and cultural understanding and use of force/de-escalation has increased since 2020, but given the aggregate nature of the data we cannot assess the relationship of course completion to changes in racial disparities. Furthermore, possible unintended consequences of such notable decreases in stops should also be evaluated, including impacts on crime and safety on the roads.
Lastly, but importantly, the value of the RIPA data depends on the completeness and accuracy of the data. We observe some patterns that suggest that, at least temporarily, agencies may not have reported all stops, as the legislation requires. If that is the case, research such as ours, as well as the mandated annual RIPA Board reports, may not be capturing the entirety of law enforcement stops made every year. We strongly recommend efforts to ensure the completeness and fidelity of RIPA data.
Topics
Criminal Justice Population