
Table of Contents
- Key Findings
- The Situation in Ukraine and Rising Prices
- Housing Affordability
- Homelessness
- COVID-19 and Pandemic Mandates
- Midterm Elections
- Elected Officials’ Approval Ratings
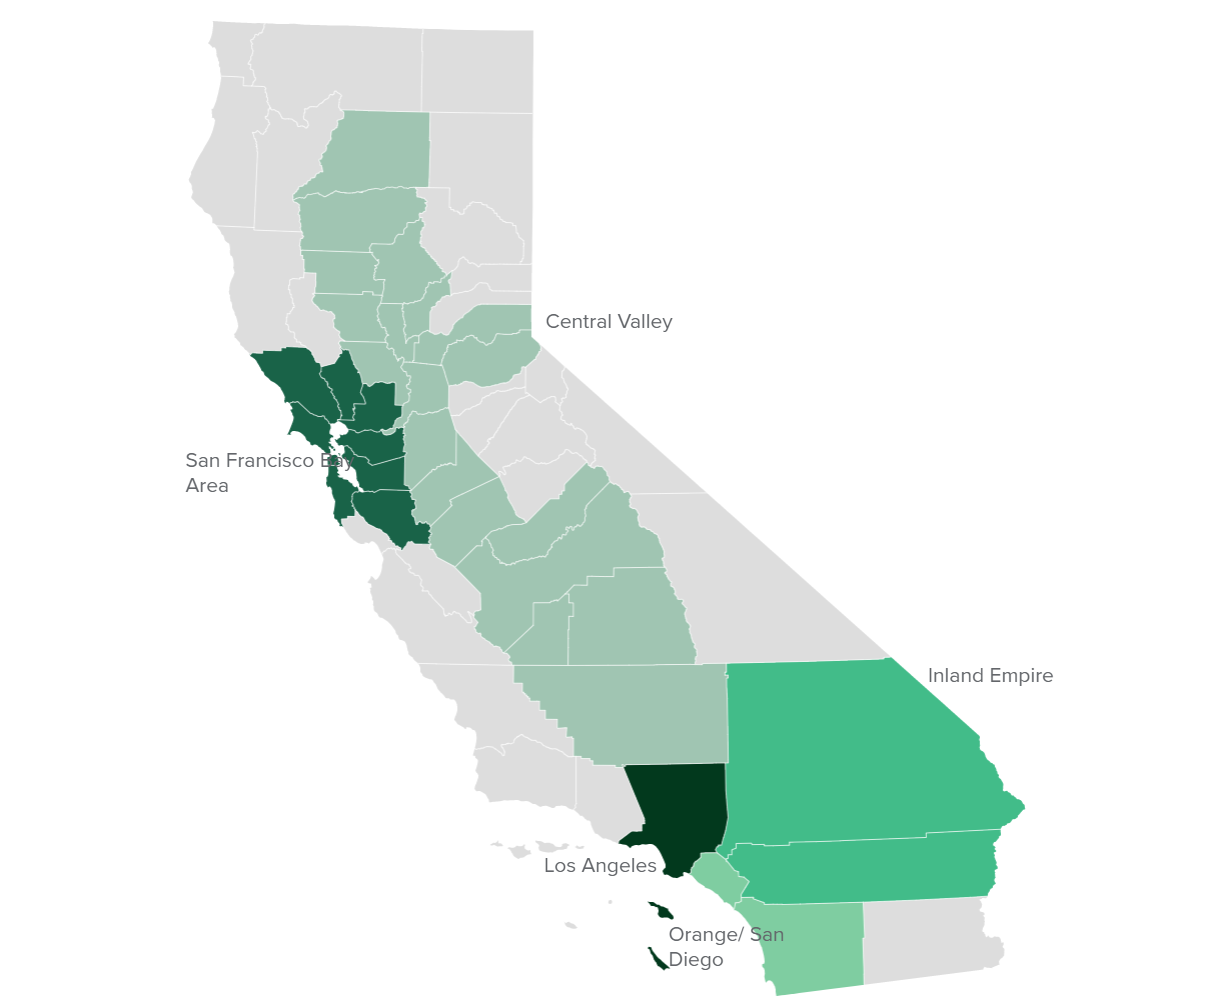
- Regional Map
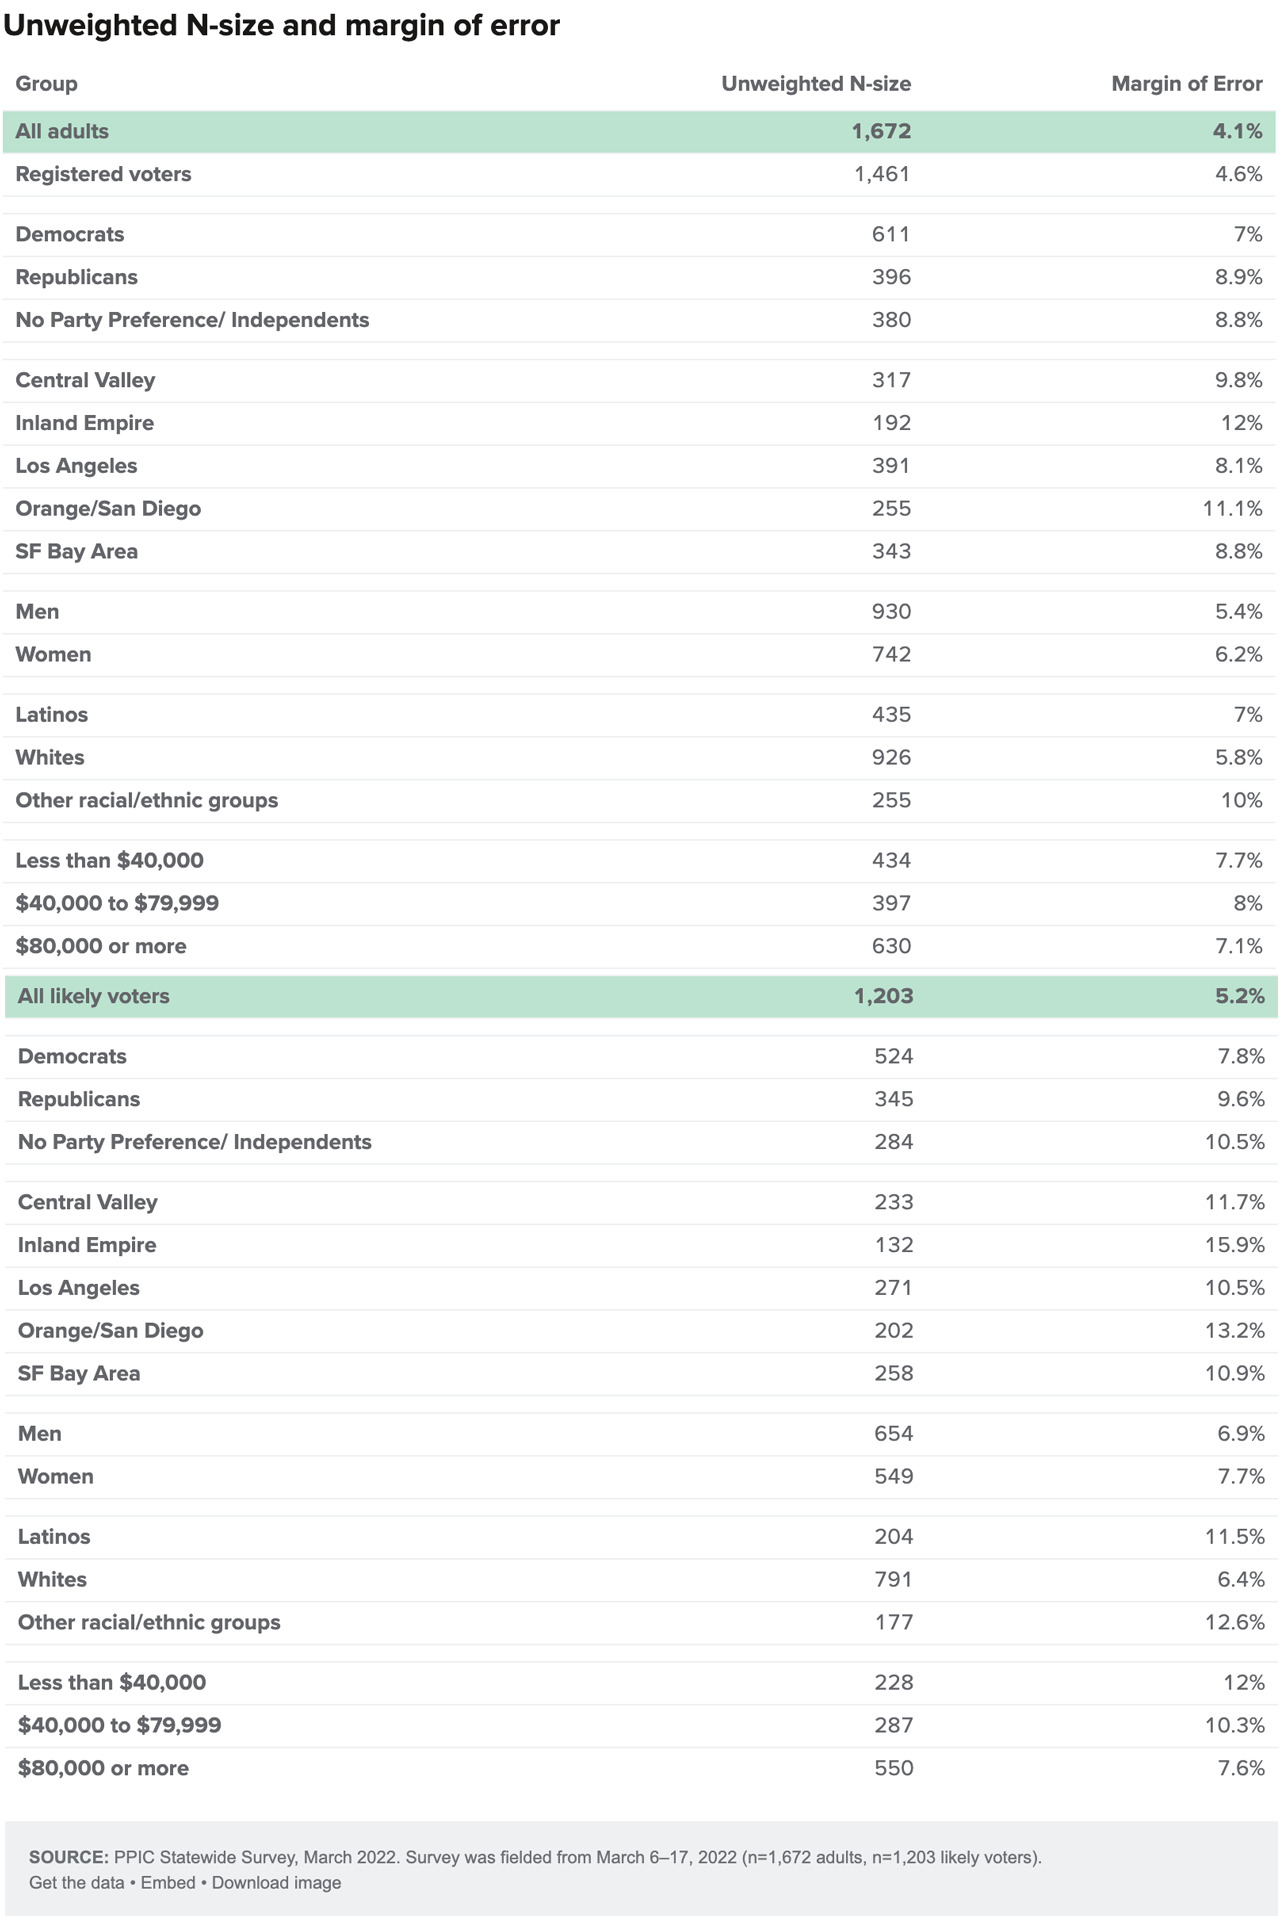
- Methodology
- Questions and Responses
- Authors and Acknowledgments
- PPIC Statewide Advisory Committee
- PPIC Board of Directors
- Copyright
Key Findings
The world order was upended when the Russian military invaded Ukraine, an action that has caused widespread death and destruction. In response, the international community imposed harsh economic sanctions on the Russian government. Californians felt the shock waves through rising prices at the gasoline pump that added further fuel to inflation fears. In recent weeks, COVID-19 cases have plummeted and the omicron surge has given way to an easing of mask and vaccination restrictions. Meanwhile, statewide and legislative candidates for the California June primary made their plans known by the March 11 deadline.
These are the key findings of a statewide survey on state and national issues conducted by the Public Policy Institute of California from March 6 to 17, 2022:
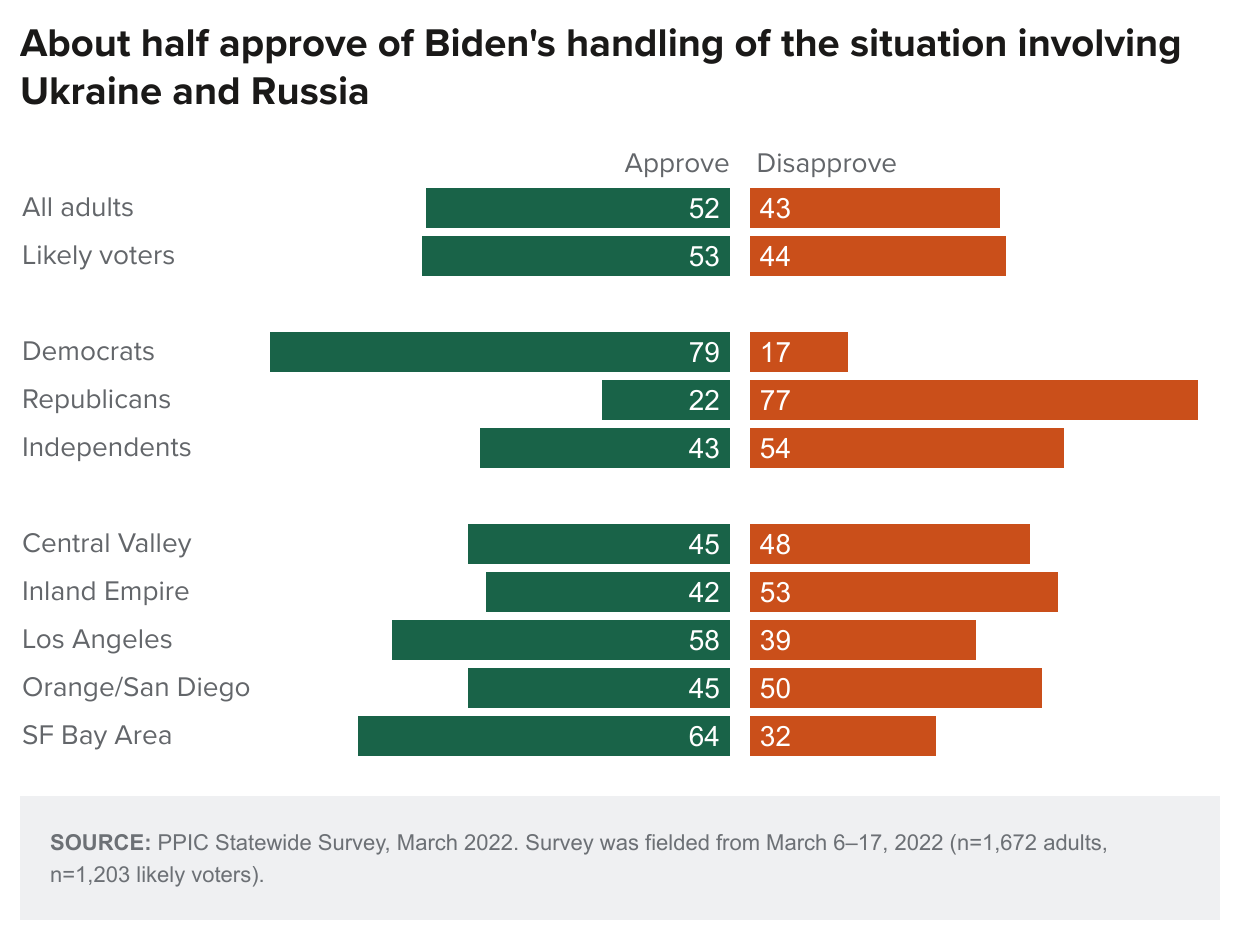
 A majority of Californians—including majorities across partisan groups—favor imposing economic sanctions on Russia in response to the Ukraine invasion even if it means higher energy prices. Fifty-two percent approve of the way that President Joe Biden is handling the situation involving Ukraine and Russia, with partisans deeply divided in their views. →
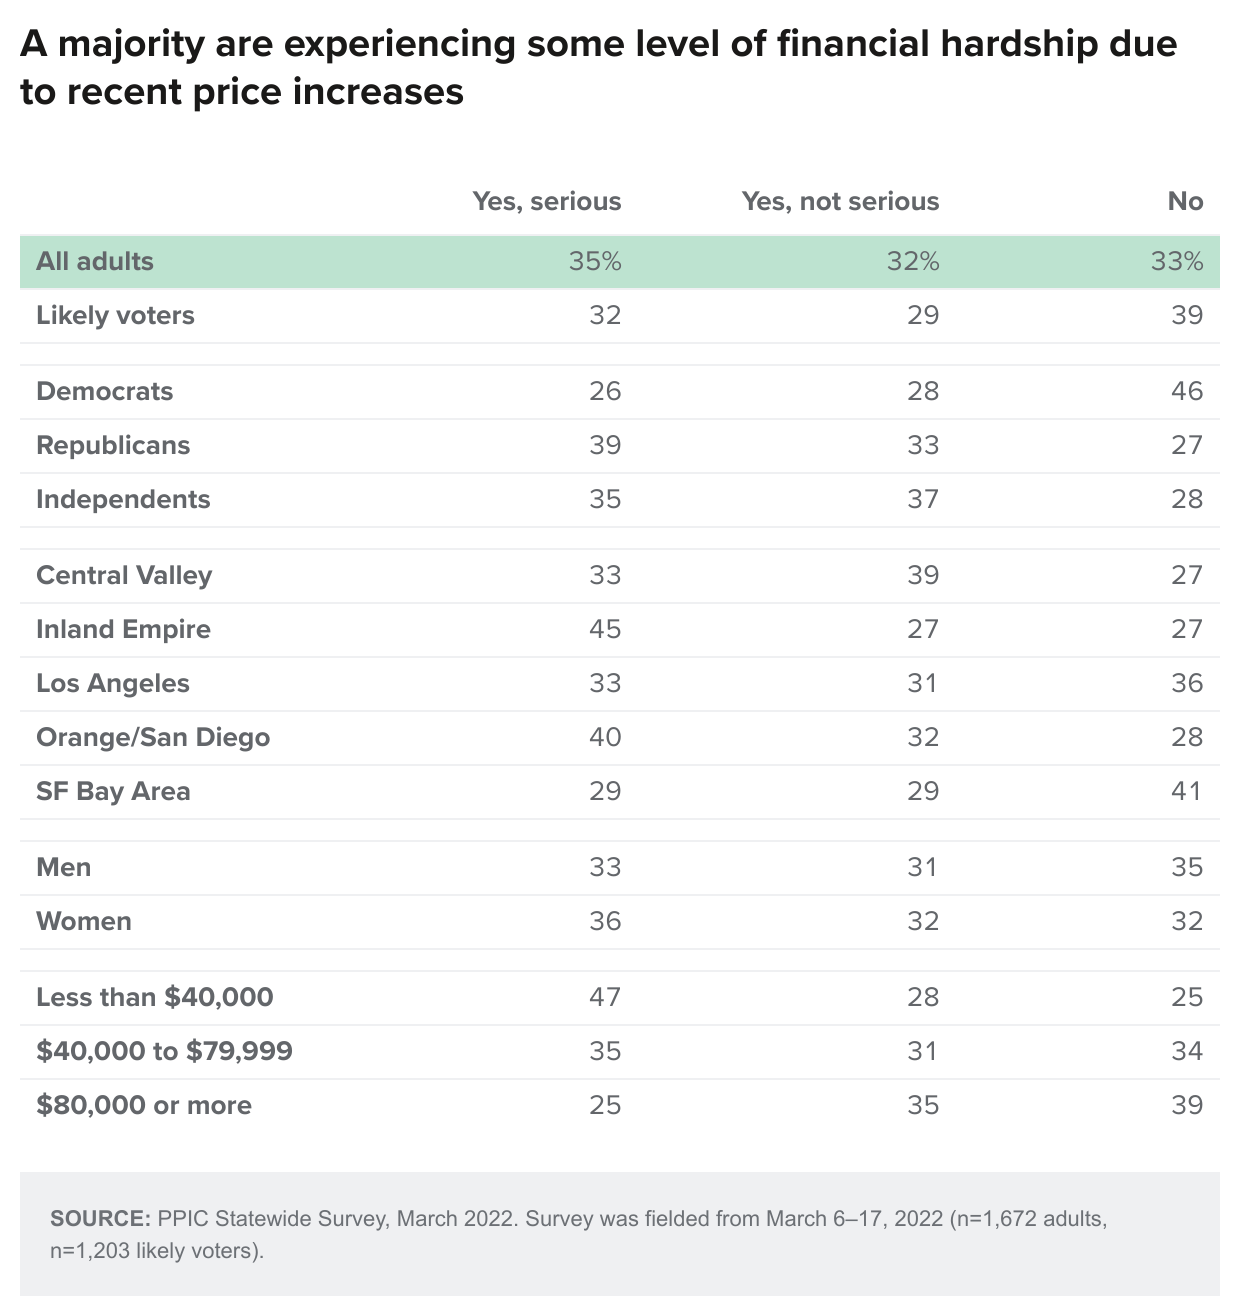
 Thirty-five percent of Californians say that recent price increases have caused serious financial hardship for themselves or others in their households. Forty-seven percent of lower-income residents say that they are experiencing serious financial hardship due to recent price increases. →
- Twenty-six percent of Californians are very concerned about not having enough money to pay their rent or mortgage. Forty-one percent of lower-income residents, and 34 percent of renters, are very concerned about not having enough money to pay their housing costs. →
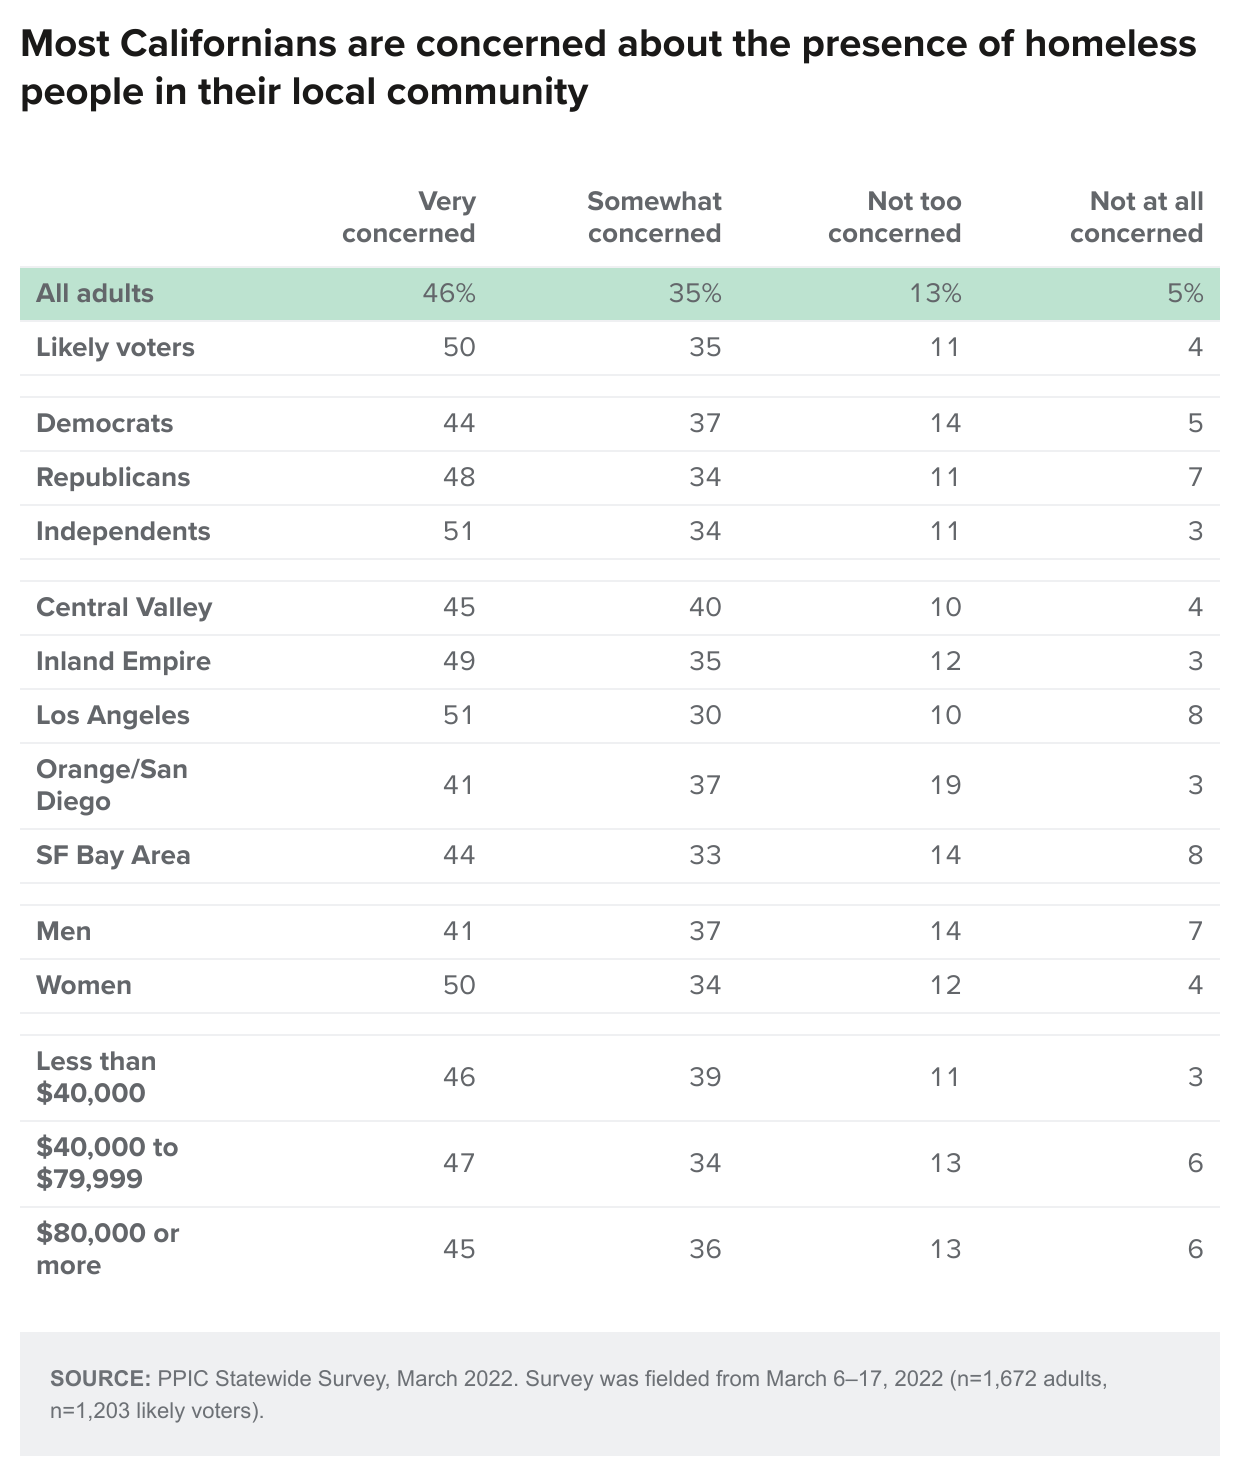
- A solid majority of Californians, and majorities across partisan groups and regions of the state, say that homelessness is a big problem in their part of California. Forty-six percent say they are very concerned about the presence of homeless people in their local community today. →
- The perception about where the US stands in the COVID outbreak is similar to a year ago, while personal concerns about getting seriously ill from the virus are down. Californians are deeply divided along partisan lines when it comes to having some restrictions to try to control the spread of the virus. →
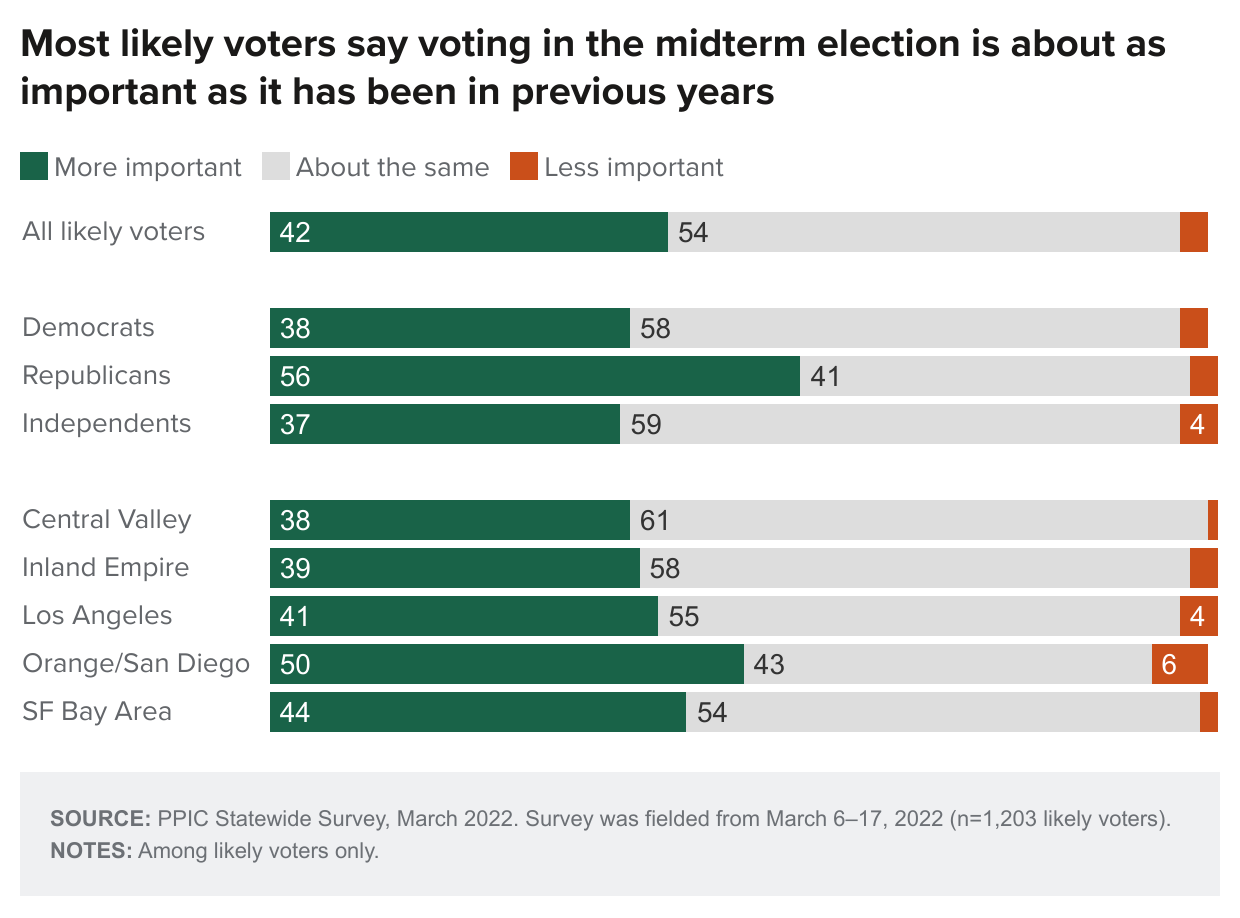
- Forty-two percent of likely voters say that voting this year is more important than in past midterm elections. Republicans are more likely than Democrats and independents to say that voting is more important this year and that they prefer to elect a representative to Congress who is new to politics. →
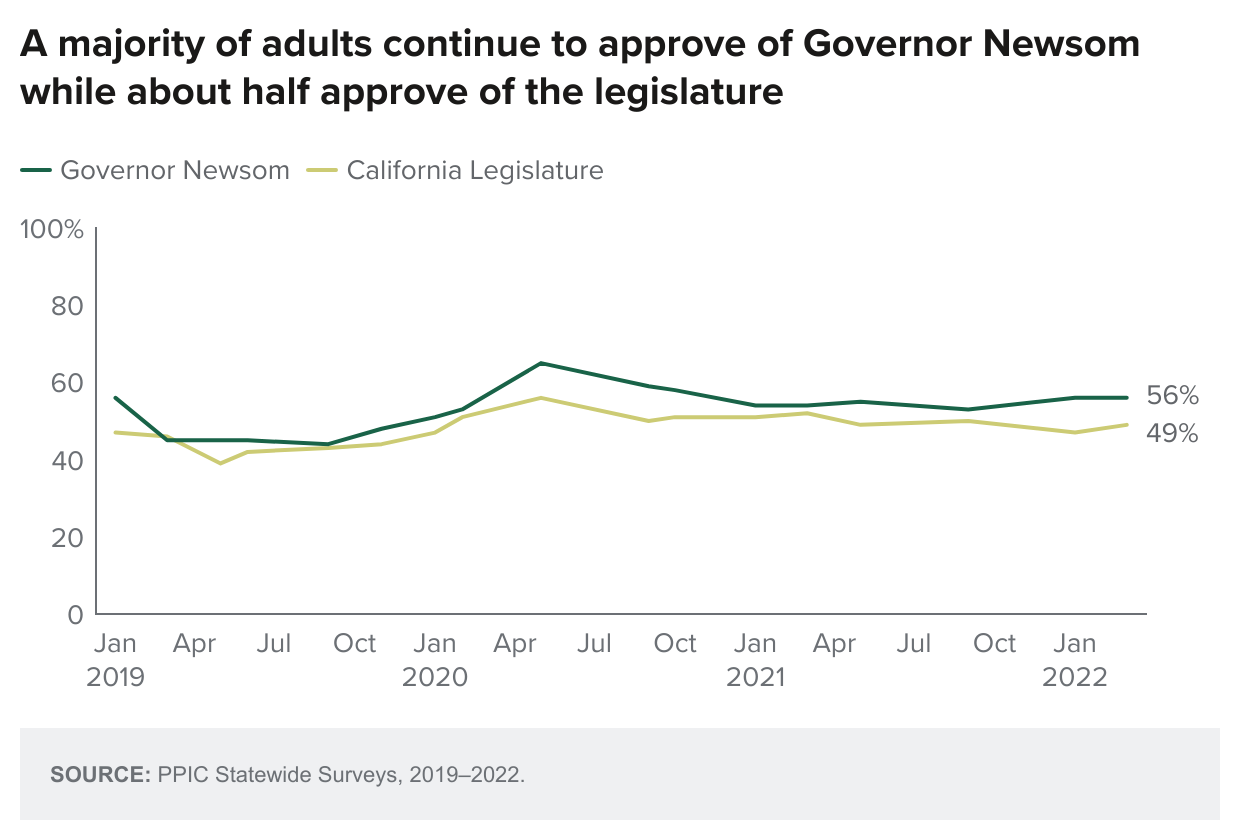
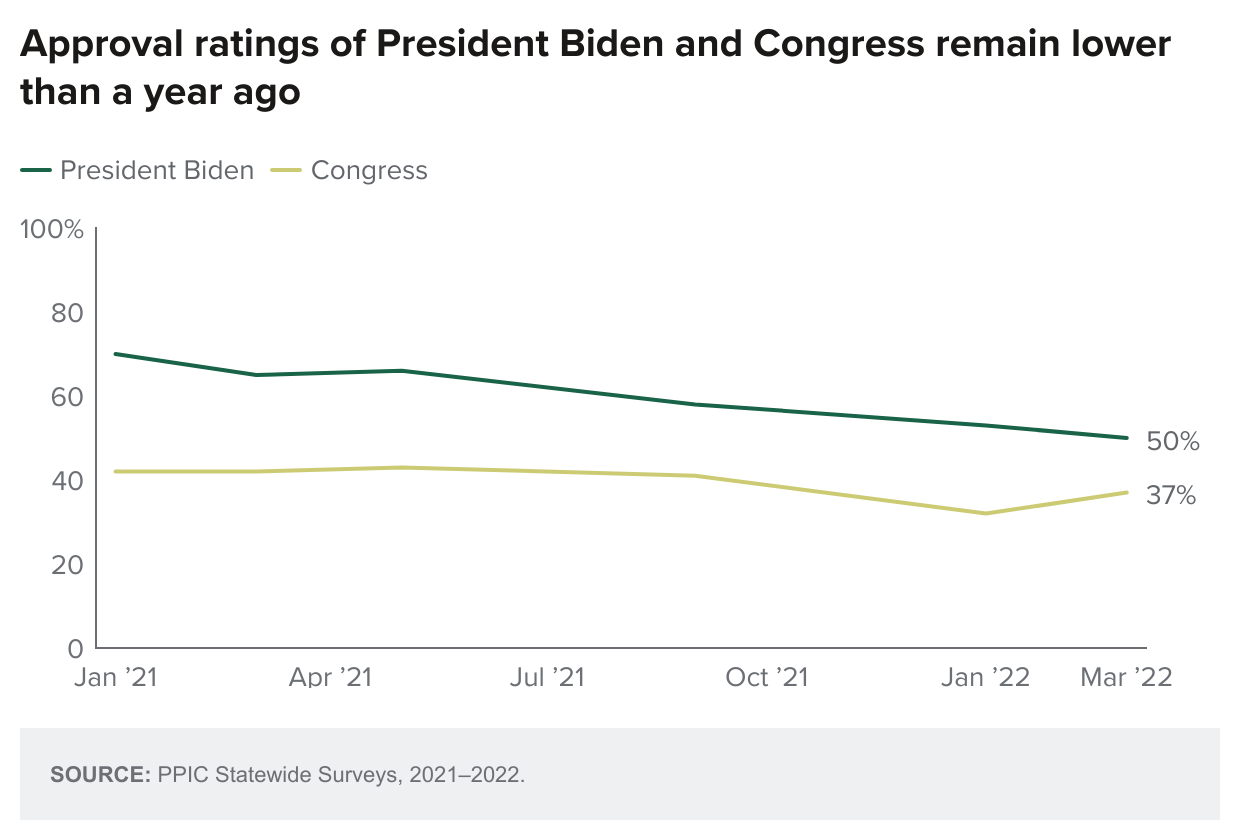
- Fifty percent of Californians approve of President Biden’s performance in office. Fifty-six percent approve of Governor Gavin Newsom, 44 percent approve of Senator Alex Padilla, and 41 percent approve of Senator Dianne Feinstein. While only 37 percent approve of Congress overall, 55 percent of Californians approve of their own representative to the US House of Representatives. →
 Thirty-five percent of Californians say that recent price increases have caused serious financial hardship for themselves or others in their households. Forty-seven percent of lower-income residents say that they are experiencing serious financial hardship due to recent price increases.
 The Situation in Ukraine and Rising Prices
The Russian invasion of Ukraine has led to a humanitarian crisis, and its shockwaves have reverberated around the world. Overall, 52 percent of Californians approve of President Biden’s handling of the situation involving Ukraine and Russia—similar to his overall approval rating. Partisans are sharply divided on this issue, and approval across regions is highest in the San Francisco Bay Area and lowest in the Inland Empire. Approval of his handling of this situation increases with education levels and is similar among men and women.
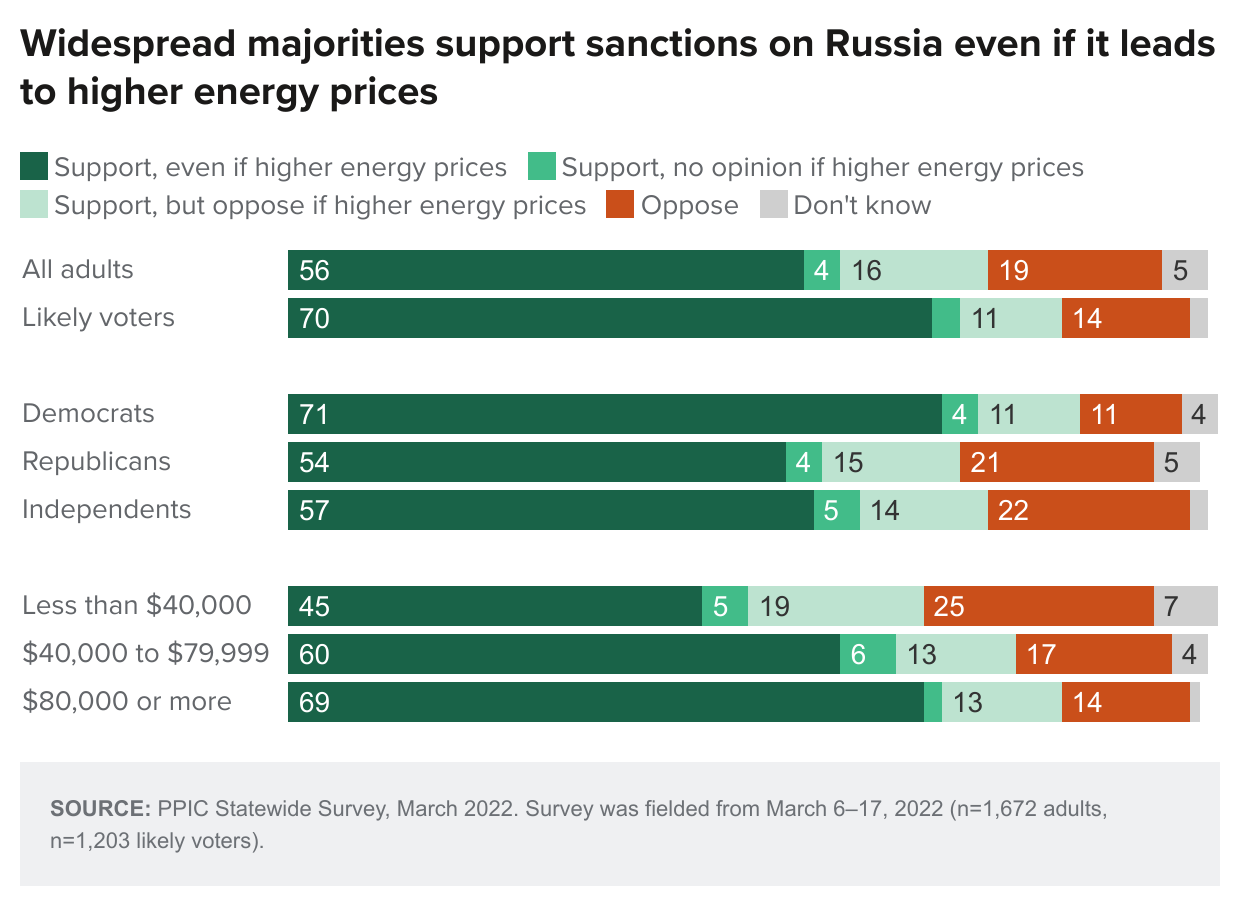
A majority of Californians support the United States and European allies imposing economic sanctions on Russia even if it means higher energy prices; overall, three in four support sanctions. A majority of partisans support sanctions even if it means higher energy prices, although Democrats are much more likely than Republicans or independents to do so. Majorities of men and women—and Californians across age groups—support sanctions even if it means higher energy prices, and support increases with rising education and income levels.
Two in three Californians say that recent price increases have caused financial hardship for them and their household, with 35 percent saying it has caused serious hardship. Republicans and independents are more likely than Democrats to say they have experienced serious hardship. Inland Empire residents are the most likely—and San Francisco Bay Area residents are the least likely—to say that recent price increases have caused serious hardship. At least three in ten men and women, as well as Californians across age groups, say they have experienced serious hardship; this perception is higher among those with children 18 and under in the household (36%) than among those with no children (22%), and it declines sharply with rising education and income levels.
Housing Affordability
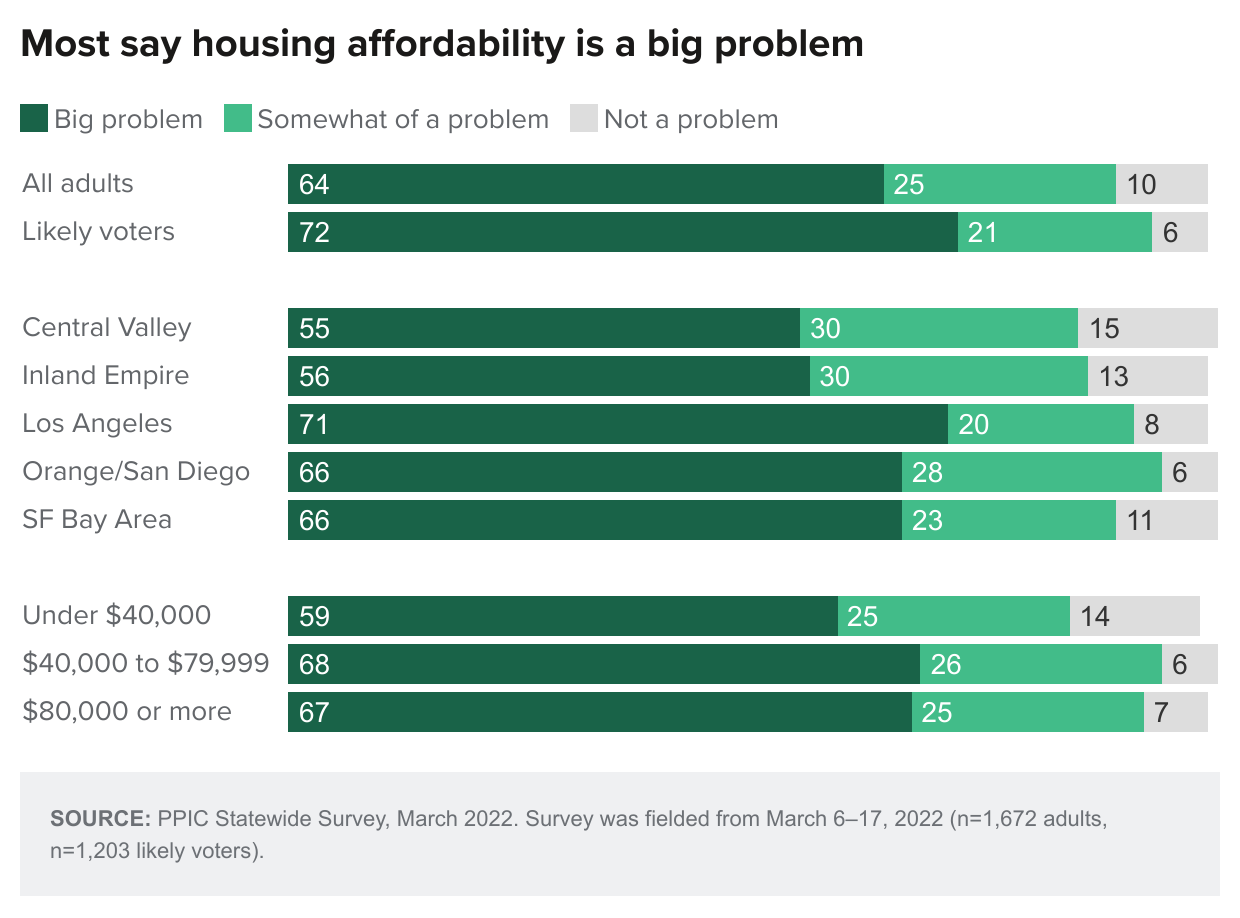
A solid majority of Californians say that housing affordability is a big problem in their part of California, while one in four say it is somewhat of a problem. A similar share called this a big problem in our survey last March. Today, residents in Los Angeles, the San Francisco Bay Area, and Orange/San Diego are more likely than those elsewhere to say it is a big problem. Majorities across demographic groups say housing affordability is a big problem in their part of California. Notably, similar shares of homeowners (64%) and renters (65%) call this a big problem.
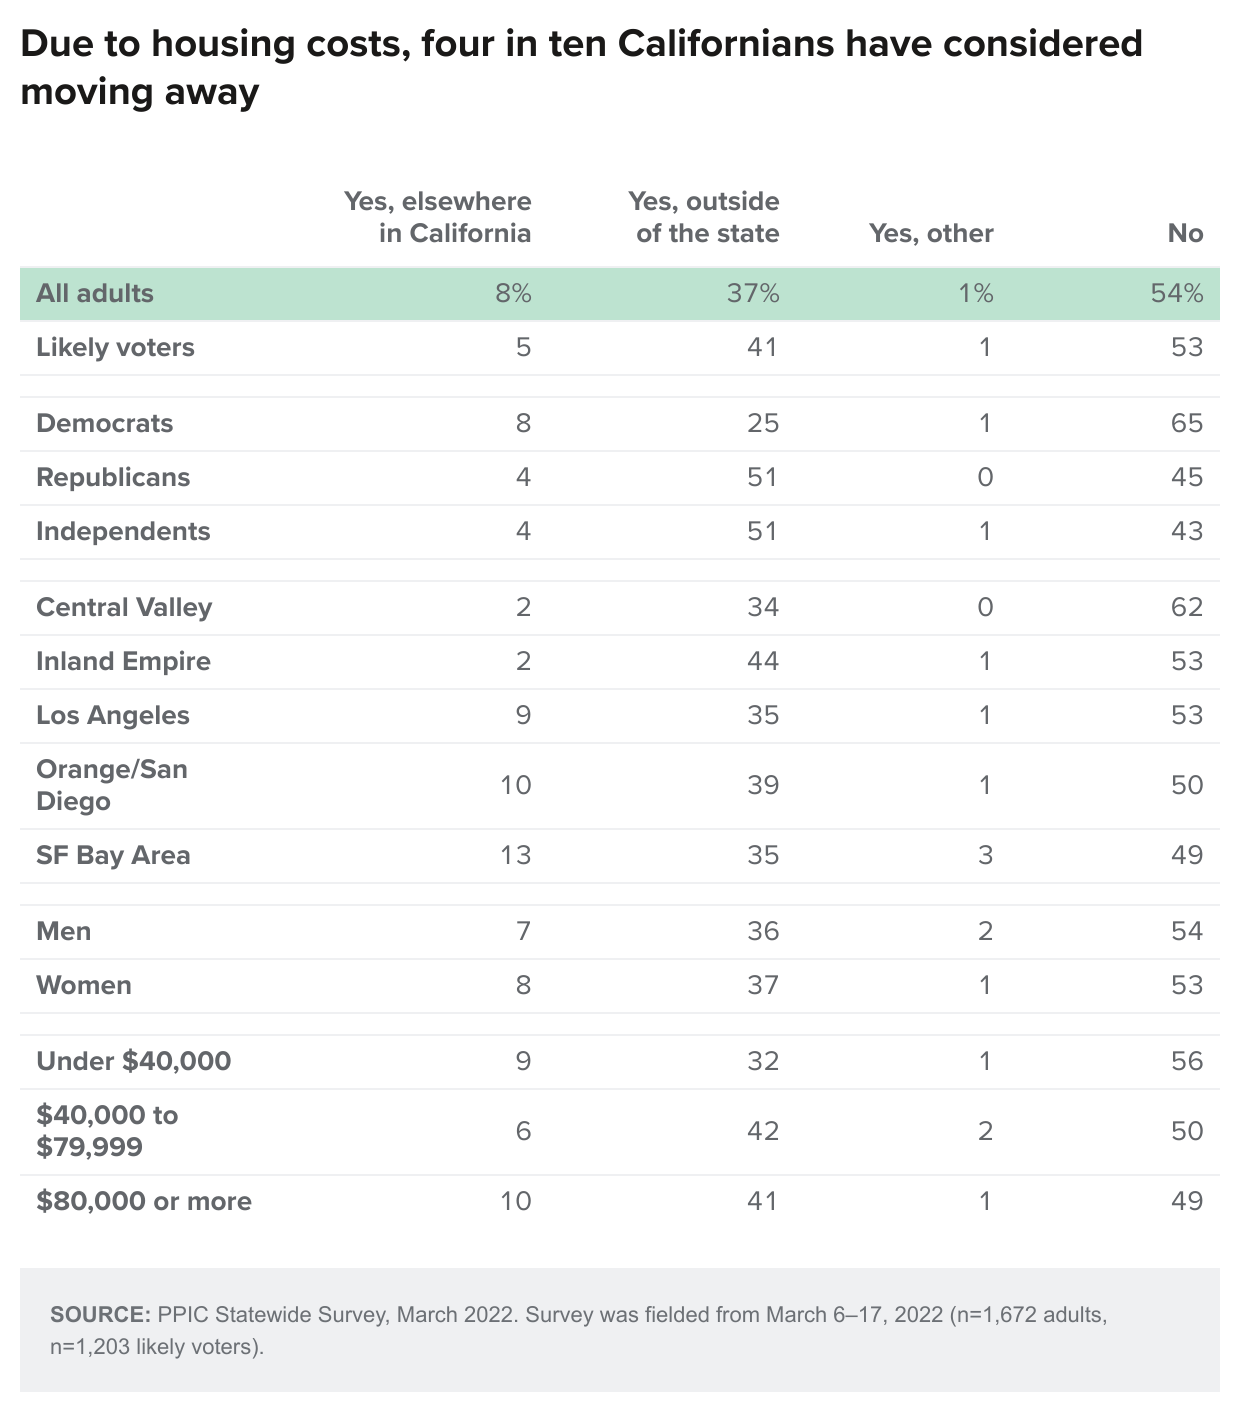
A record-high 46 percent of Californians say the cost of their housing makes them and their family seriously consider moving out of the part of California where they currently live, with most saying they would move outside the state. Republicans (55%) and independents (56%) are far more likely than Democrats (35%) to say they have seriously considered moving out. Renters (53%) are more likely than homeowners (39%)—and younger Californians are more likely than older ones—to say that they have seriously considered moving out of the part of California where they currently live.
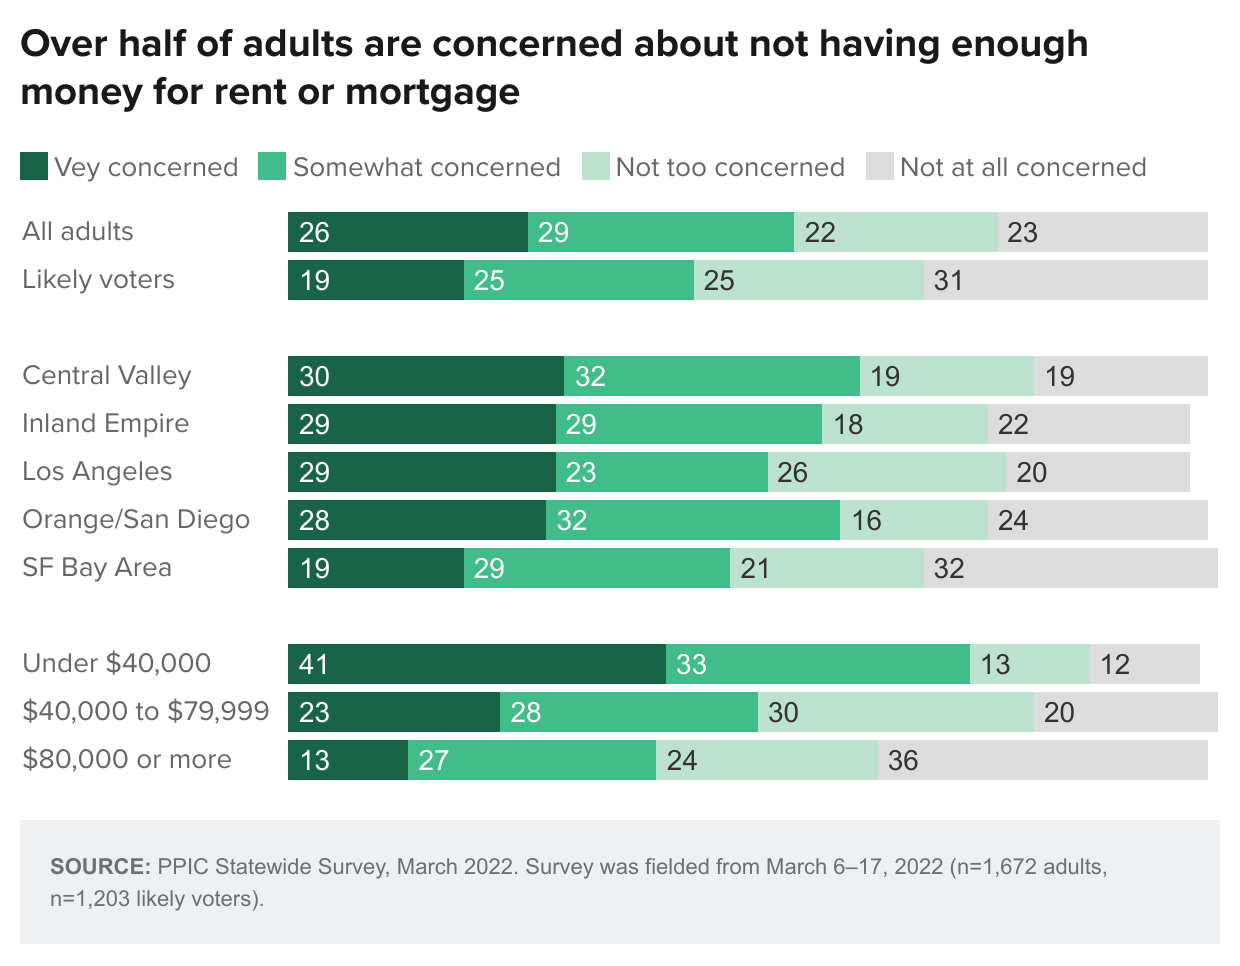
A majority of Californians say they are very or somewhat concerned about not having enough money to pay their rent or mortgage, with one in four saying they are very concerned. Residents in the San Francisco Bay Area are less likely than those elsewhere to be very concerned. The share saying they are very concerned is highest among those who never attended college (39%) and those with household incomes under $40,000 (41%). Notably, renters are twice as likely as homeowners to be very concerned (34% compared to 17%).
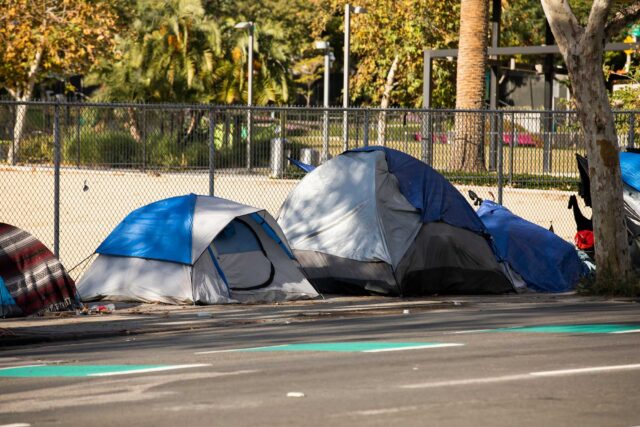
Homelessness
With $12 billion in last year’s budget to address homelessness and with state lawmakers recently unveiling a legislative package to address the issue, a solid majority of Californians (64%) say homelessness is a big problem in their part of the state (25% somewhat of a problem, 10% not much of a problem). The share saying it is a big problem is similar to last September. Today, six in ten or more across partisan and demographic groups agree that homelessness is a big problem. Majorities across regions say homelessness is a big problem, with Central Valley and Los Angeles residents the most likely to say this.

Asked how concerned they are about the presence of homeless people in their local community today, an overwhelming majority say they are very (46%) or somewhat (35%) concerned (13% not too concerned, 5% not at all concerned). The share saying they are very concerned has remained similar since last September (49%). Today, about half or fewer across partisan groups are very concerned (44% Democrats, 48% Republicans, 51% independents). Four in ten or more across demographic groups say they are very concerned. Notably, women (50%) are more likely than men (41%) to say this. Opinions across regions vary (41% Orange/San Diego, 44% San Francisco Bay Area, 45% Central Valley, 49% Inland Empire, 51% Los Angeles).
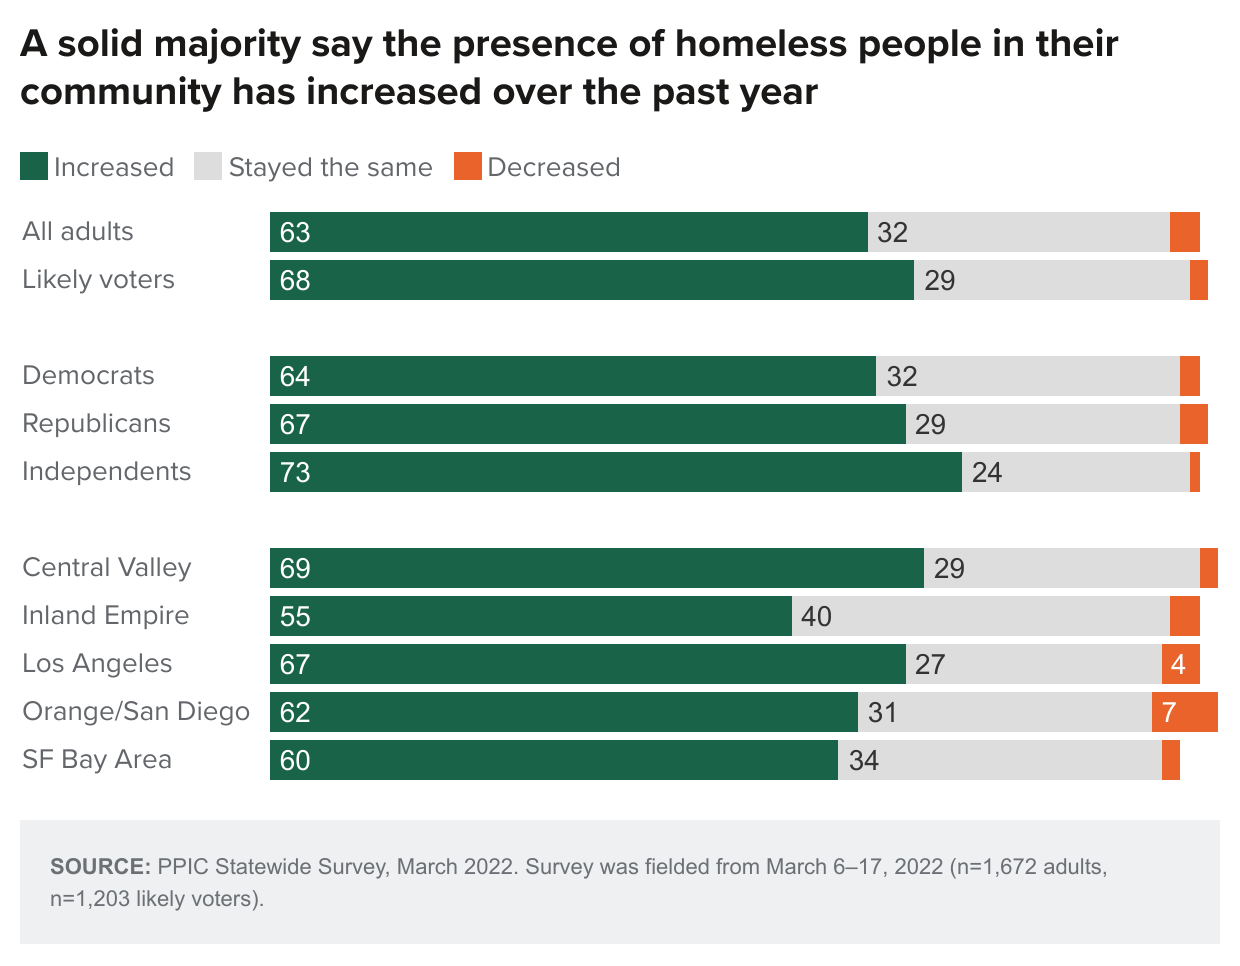
Sixty-three percent of adults say the presence of homeless people in their community has increased over the past year, a share that has remained similar since PPIC first asked this question in November 2019 (3% decreased, 32% stayed the same). Today, solid majorities across partisan groups say homelessness has increased. Roughly six in ten across demographic groups say this. Majorities across regions share this view, ranging from 55 percent in the Inland Empire to 69 percent in the Central Valley.
COVID-19 and Pandemic Mandates
As many pandemic policies expire across the state and throughout the country, nearly eight in ten adults (79%) are optimistic that, when it comes to the coronavirus pandemic, the worst is behind us (16% worst is yet to come). Optimism was similar in March 2021 and highest in May 2021, after case numbers had decreased temporarily and state mandates relaxed. Optimism fell in February 2022, amid another surge in cases due to the omicron variant—but has risen again today. Now, overwhelming majorities across parties (85% Republicans, 80% Democrats, 76% independents), and overwhelming majorities across demographic and regional groups, say that the worst is behind us. Moreover, personal concerns about getting seriously ill from the coronavirus (14% very concerned, 20% somewhat concerned) are down compared to March 2021.

A majority of California adults say it is more important to try and control the spread of the coronavirus, even if it means having some restrictions (46% strongly favor, 18% somewhat), compared to fewer who favor having no restrictions on normal activities, even if it hurts efforts to control the spread (23% strongly favor, 9% somewhat). Democrats (65%) are most likely to strongly favor controlling the spread, and the majority of Republicans (53%) strongly favor having no restrictions, while independents are more divided on this issue. Across regions, San Francisco Bay Area residents (60%) are the most likely to strongly favor controlling the spread. Women (57%) are far more likely than men (35%) to strongly support restrictions. The share who strongly favor controlling the spread decreases as income rises, and is higher among those 55 and older (54%) than among younger Californians (45% 18 to 34, 40% 35 to 54).
A majority of Californians (57%) and half of likely voters are in favor of requiring proof of vaccination to enter large outdoor gatherings or certain indoor spaces, such as restaurants, bars, and gyms. This share has decreased slightly since last September (61% favor). Today there is wide partisan division on this issue: 71 percent of Democrats favor proof of vaccination, while 72 percent of Republicans and 52 percent of independents oppose. About half or more across demographic groups are in favor. The share in favor increases as income decreases. Half or more across regions are in favor, and support is highest in the San Francisco Bay Area (68%).


Midterm Elections
Whether or not the balance of power will change in the US Congress is the major subplot in the 2022 election. Roughly eight months before Election Day, 54 percent of likely voters say voting this year is about as important as in past years, while 42 percent say it is more important; only 3 percent feel it is less important. More likely voters felt voting in the midterms was more important in March 2018 (51% more important, 48% about the same, 1% less important). Today, most Democrats and independents say voting is about as important as in previous years, while 56 percent of Republicans believe it is more important. Regionally, half in Orange/San Diego say it is more important, while most residents elsewhere feel it’s about the same. Likely voters age 45 and older (48%) are much more likely than younger Californians (34% 18 to 44) to say voting is more important than in past midterms.
Likely voters are divided on their preferences for electing a representative to Congress who has experience in politics (46%) or is new to politics (43%). Before the general election in September 2020, half preferred someone with experience and more than a third preferred a candidate who was new to politics. A solid majority of Democrats prefer experience, while 57 percent of Republicans would like someone new, as would 48 percent of independents. Regionally, majorities in the San Francisco Bay Area prefer experience, while those in the Central Valley, Inland Empire, and Orange/San Diego want someone new; Los Angeles residents are divided. About half of likely voters in Republican-held districts say they want someone new (51%, 38% experience), while about half in Democratic-held districts prefer experience (49%, 41% new). In the five competitive California districts as defined by the Cook Political Report, likely voters are more divided (39% experience, 44% new).

If the 2022 election for the US House of Representatives were held today, 51 percent of likely voters would vote for or lean toward the Democratic candidate, while 42 percent would vote for or lean toward the Republican candidate. An overwhelming majority of partisans support their party’s candidate, while independents are divided (44% Republican/lean Republican, 40% Democrat/lean Democrat). Democratic candidates are preferred by a 21-point margin in Democratic-held districts, while Republican candidates are preferred by a 26-point margin in Republican-held districts. In competitive districts, the Democratic candidate is preferred by a 21-point margin (59% to 38%).

Elected Officials’ Approval Ratings
Six months after the gubernatorial recall attempt, 56 percent of Californians and 50 percent of likely voters approve of Gavin Newsom’s job performance as governor. Approval of Governor Newsom among all adults has remained above 50 percent since January 2020. Eighty percent of Democrats approve of Newsom, while 81 percent of Republicans and 54 percent of independents disapprove. Majorities approve in the San Francisco Bay Area, Orange/San Diego, and Los Angeles while Central Valley and Inland Empire residents are more divided in their views. The share approving of the governor is higher among women (61%) than men (51%). Forty-nine percent of adults and 41 percent of likely voters approve of the state legislature; views were similar last March.
Amid multiple domestic and foreign policy dilemmas, 50 percent of Californians and 46 percent of likely voters approve of the job Joe Biden is doing as president—much lower than a year ago when 65 percent of adults and likely voters approved. Today, 72 percent of Democrats approve of the president while most Republicans and independents disapprove. Most residents in the San Francisco Bay Area and Los Angeles approve while majorities of residents elsewhere disapprove. In a recent Gallup poll, 42 percent of adults nationwide approved of President Biden’s job performance. In California, approval of Congress remains low at 37 percent. Notably, approval fails to eclipse 50 percent across parties, regions, and demographic groups, with the exception of Latinos (52%). In a February Gallup poll, 20 percent of adults nationwide approved of Congress.
As Senator Alex Padilla faces his first election—he was appointed by Governor Newsom to fill the US Senate seat vacated by Vice President Kamala Harris—44 percent of adults and 39 percent of likely voters approve of the way he is handling his job. Given his short tenure in office since January 2021, about one in three adults (30%) and likely voters (31%) say they don’t know enough to have an opinion. US Senator Dianne Feinstein—who is not facing reelection in 2022—has the approval of 41 percent of adults and 36 percent of likely voters. Her approval rating was somewhat higher last March (47% adults, 44% likely voters). When asked about the job their own representative to the US House of Representatives is doing, 55 percent of adults and 49 percent of likely voters approve; approval was similar 12 months ago.

Topics
Health & Safety Net Political Landscape Statewide SurveyLearn More

Broad Support among Californians for Admitting Ukrainian Refugees

Californians Sour on State and Local Tax System
Californians Want Recall Reforms on the 2022 Ballot

Gas Prices Stretch Family Budgets

High Prices Causing Financial Hardships for Many Californians

Most Californians Favor Continuing COVID-19 Restrictions—Including Proof of Vaccination

Ukrainian Immigrants in California
Video: Californians and Their Government
Views on Homelessness Have Shifted in Some California Regions
