
Key Takeaways
The California Next Generation Science Standards (CA NGSS)—adopted in 2013—have the potential to improve scientific literacy and strengthen the global competitiveness of California’s workforce. However, longstanding underinvestment in science education and the unprecedented disruptions caused by COVID-19 have heightened challenges faced by California’s districts, schools, and students. In this report, we use data from multiple sources to understand the impact of COVID-19 on science education when schools were mainly virtual. We find that:
- COVID-19 derailed science education in most. Science became a lower priority during the 2020–21 school year in most districts surveyed. Key CA NGSS implementation activities, such as textbook adoption and course model alignment, were delayed. Staff shortages, teacher burnout, lack of dedicated funding, and an emphasis on English language arts (ELA) and math are barriers to prioritizing science education. However, some high-need districts—including those with large English Learner populations—are using science content to engage students in in ELA and math. →
- Support for science education was limited. During the 2020–21 school year, 60 percent of districts provided supplemental instructional materials, 43 percent provided summer science programs, and 40 percent addressed social-emotional learning in support of science education. Only a quarter of districts provided small group instruction and very few offered extended science learning time during the regular school year. Only 40 percent of districts provided additional support to English Learners. →
- County offices of education received fewer requests for science-related assistance. Most county offices created videos or webinars, provided technical assistance through virtual professional learning, continued to work with teacher leader networks, and shared grade-specific distance learning lessons during the pandemic. However, seven of ten county offices of education reported a decline in requests for science professional learning or technical assistance. Before and during the pandemic closures, programs for English Learners were more common than programs for low-income students and students with disabilities.
- Most district recovery plans do not prioritize science education. Only 27 percent of the districts we surveyed made science a high priority in their recovery plans, whereas more than 80 percent prioritized math/ELA. Close to half of 2021–24 Local Control and Accountability Plans (LCAPs) included plans to adopt, develop, or purchase new instructional materials; 38 percent of districts plan to provide science teacher training, and 32 percent set student performance goals on standardized tests. →
- California can take steps to support equitable investments in science education. We recommend that the state provide dedicated funding for CA NGSS implementation, to help districts build capacity, provide high-quality professional learning to teachers and administrators, adopt and purchase standards-aligned instructional materials, and address the pandemic’s impact. We also recommend the inclusion of additional science indicators such as dedicated instructional minutes for elementary schools and course completion for middle/high schools in the state’s accountability system, to encourage districts to dedicate resources to science education.
Background
California is one of 44 states—serving 71 percent of US students—with education standards that were influenced by the Framework for K–12 Science Education and/or the Next Generation Science Standards (NGSS) (National Science Teaching Association 2021). Many efforts to reform science education have focused on developing scientists and engineers to keep America competitive in a global economy that is becoming increasingly dependent on science, technology, engineering, and mathematics (National Academy of Science 2021). NGSS goes further in emphasizing the need for scientific literacy:
“Science, engineering, and the technologies they influence permeate every aspect of modern life. Indeed, some knowledge of science and engineering is required to engage with the major public policy issues today as well as how to make informed decisions, such as selecting among alternative medical treatments or determining how to invest public funds for water supply options. In addition, understanding science and the extraordinary insights it has produced can be meaningful and relevant on a personal level, opening new worlds to explore and offering lifelong opportunities for enriching people’s lives. In these contexts, learning science is important for everyone, even those who eventually choose careers in fields other than science or engineering.”
Successful NGSS implementation relies on equipping students with the skills to think critically, analyze information, solve complex problems and pursue opportunities within and beyond STEM fields. Early studies of NGSS implementation found challenges in science course sequencing, the quality of NGSS-aligned instructional materials, teacher preparedness, assessment alignment, school and district capacity, and instructional shifts in classrooms (Penuel, Harris, and DeBarger 2015; Banilower et al. 2013; Reiser 2013; Trygstad et al. 2013; Krajcik et al. 2014; Tyler and DiRanna 2018; Gao et al. 2018; Haag and Megowan 2015).
California adopted the CA NGSS in 2013 and was an early implementer of NGSS. Districts were making progress toward implementing the standards before the COVID-19 pandemic abruptly altered the landscape in spring 2020. California school campuses were closed for more months than schools in any other state. The majority of students spent the entire 2020–21 school year in distance learning (Burbio 2020, 2021). These extended school closures have had a disproportionate impact on students of color, English Learners, and students with disabilities (Hamilton et al. 2020; Garet et al. 2020; Gao, Lafortune, and Hill 2020). There is growing concern that the COVID-19 pandemic has stalled or even reversed some of the early progress schools have made, by shifting resources away from science education.
In this report we aim to (1) examine the impact of COVID-19 on science education; (2) understand the challenges in high-need districts; (3) explore districts’ plans to support science education in recovery; and (4) identify policy levers that may support an equitable science education post-pandemic and beyond. We rely on several data sources. We launched a statewide survey of school districts in fall 2021. A total of 213 (of 1034) districts responded to the survey, and these districts serve 50 percent of the state’s K–12 population. There is no significant difference in districts’ shares of high-need or low-income students. Most of the differences in response rate are driven by district size and locale: large districts and urban districts are more likely to respond to our survey (Technical Appendix A Table 1). We also downloaded the 858 Local Control and Accountability Plans available online to examine districts’ support for science education.
Last, we conducted semi-structured interviews with 10 of the 11 county offices of education Regional Leads for Science, 10 high-need districts, the 8 districts that participated in the CA NGSS Early Implementers initiative, several statewide science organizations, and a range of statewide policymakers to identify ways to support science education.
District Implementation Was Disrupted by the Pandemic
To better understand the pandemic’s impact on CA NGSS implementation, we need to know more about how districts across the state were doing before spring 2020. In this section we look at results from surveys we fielded in 2016–17 and 2019–20 to assess the progress districts were making, along with an analysis of a random sample of School Accountability Report Cards (SARCs) to help us assess textbook adoption before COVID-19.
NGSS Implementation Was Progressing—though Somewhat Unevenly—before Spring 2020
Our recent survey asked districts to identify their CA NGSS implementation phase prior to spring 2020 (Figure 1). The 94 percent implementation rate represents a significant increase from 2016–17, when 78 percent of respondent districts were in the implementation stage (Gao et al. 2018).
Almost all districts were in the implementation phase in 2019–20

SOURCE: PPIC school district surveys, 2016–17, 2019–20.
NOTE: In the 2019–20 survey, we asked districts to identify their NGSS status prior to spring 2020. The difference between urban and non-urban districts was significant in 2016–17, but not in 2019–20. In both surveys there is no significant difference by district’s high-poverty, high Black/Latino, or high-need status.
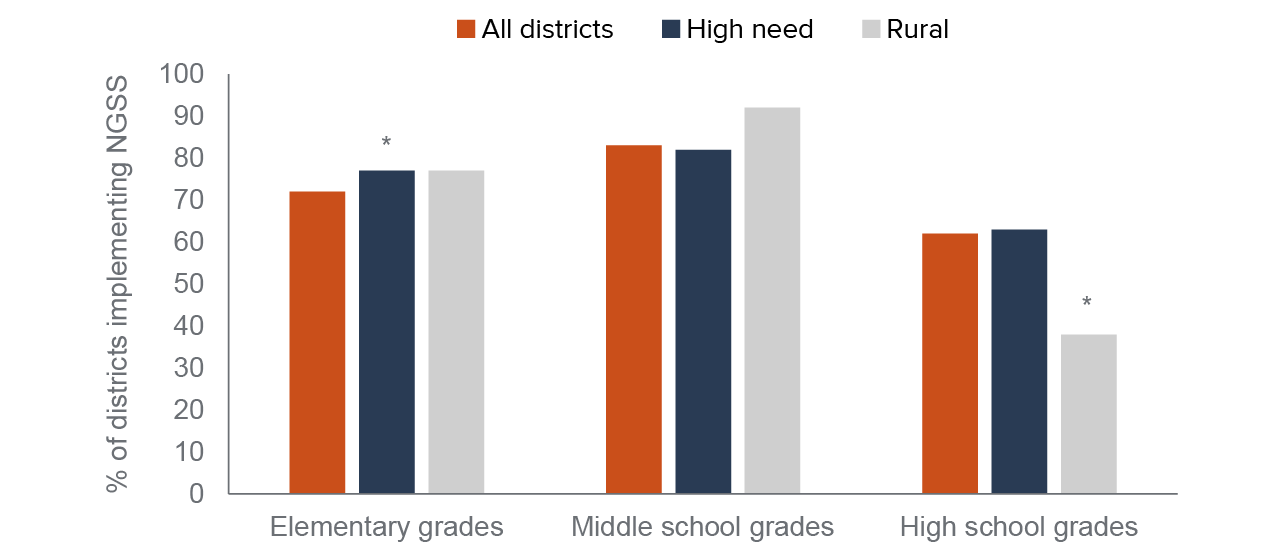
However, implementation was uneven across grade levels: as of 2019–20, more progress had been made in K–8 schools than in high schools (Figure 2). High-need districts were more likely to have implemented CA NGSS in elementary grades than lower-need districts, while implementation in rural high schools lagged behind (Technical Appendix B Table 1).
NGSS implementation was uneven across grades and district types in 2019–20
SOURCE: Authors’ calculations.
NOTES: Sample includes 200 districts who reported being in the implementation phase. High-need districts: at least 55 percent of students are high-need (i.e., low-income, English learners or homeless). High-poverty districts: at least 75% of students are eligible for free/reduced price lunch. * p <0.01. For high-need districts, the comparison group is lower-need districts; for rural districts, the comparison group is non-rural districts, including urban and suburban districts.
Effective implementation of NGSS involves adopting standards-aligned instructional materials, developing and/or aligning science course sequences for middle and high schools, providing high-quality training to teachers and administrators, supporting teachers to align classroom instruction, and developing or aligning local science assessments (National Research Council 2014). Implementation in those key areas was uneven, with the most progress being made in curriculum and instructional alignment (53%) and shifts in classroom instruction (45%). A smaller percentage of districts had started the process to provide teacher training (41%), align local assessments (28%) or train administrators (24%) in 2019–20 (Figure 3). In addition, most districts were not using local assessments, such as district benchmarks (Technical Appendix B Figure 1). The only significant difference across districts with varying demographic characteristics was that high-Black/Latino districts were more likely to provide professional learning to administrators (31% compared to 24% overall, Technical Appendix B Table 2).
Districts in the implementation phase were most likely to be aligning local curricula in 2019–20

SOURCE: Authors’ calculations.
NOTE: Sample includes 200 districts who reported being in the implementation phase.
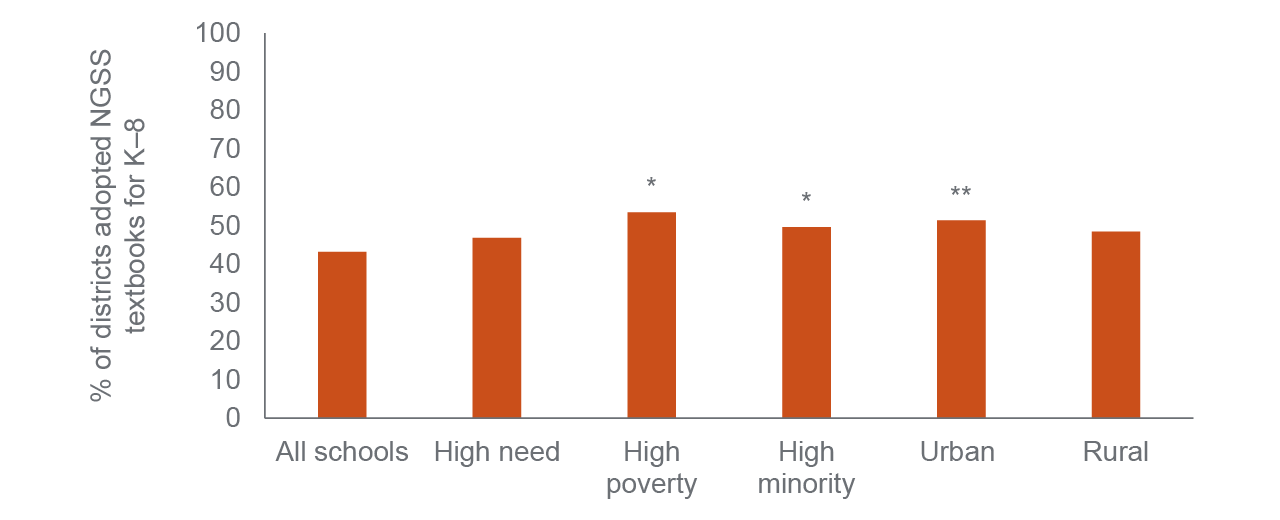
The state released its list of approved instructional materials for grades K–8 in 2018 and required schools to report textbook titles and year of adoption in their annual School Accountability Report Cards (SARCs). To get a sense of how districts were progressing in this area, we extracted textbook titles and years of adoption from the SARCs of a randomly selected sample of schools and compared them to the state’s approved list (Figure 4). Overall, 43 percent of the K–8 schools adopted CA NGSS–aligned textbooks; larger shares of the high-poverty districts (53%), high Black/Latino districts (50%), and urban districts (51%) adopted state-approved material.
High-poverty schools were especially likely to have adopted CA NGSS–aligned textbooks in 2019–20
SOURCE: School Accountability Report Cards, 2019–20.
NOTES: Sample includes 376 randomly selected schools. The sampling error is ±5 percent at the 95 percent confidence level. This means that 95 times out of 100, the results will be within 5 percentage points of what they would be if all California public schools were studied. * p<0.10; ** p<0.05.
According to the state’s Science Framework, aligning course models with CA NGSS is an important implementation milestone (California Department of Education 2016). Middle schools can choose either an integrated model or a discipline specific model; high schools can choose either a three-course model (e.g., biology, chemistry, and physics with earth and space science integrated), a four-course model (e.g., biology, chemistry, physics, and earth and space science), or an integrated model of every science, every year. In 2013, the State Board of Education identified the integrated model as the preferred option for middle grades. According to our survey, most districts chose the integrated model for middle school grades in 2019–20 (Figure 5)—roughly the same share as in 2016–17 (Gao et al. 2018). The only significant difference across district characteristics was that a higher share of high-poverty districts chose the integrated model (61% compared to 55%).
As of 2020, most districts had adopted the integrated course model for middle schools
SOURCE: Authors’ calculations.
NOTE: Sample includes 213 respondent districts.
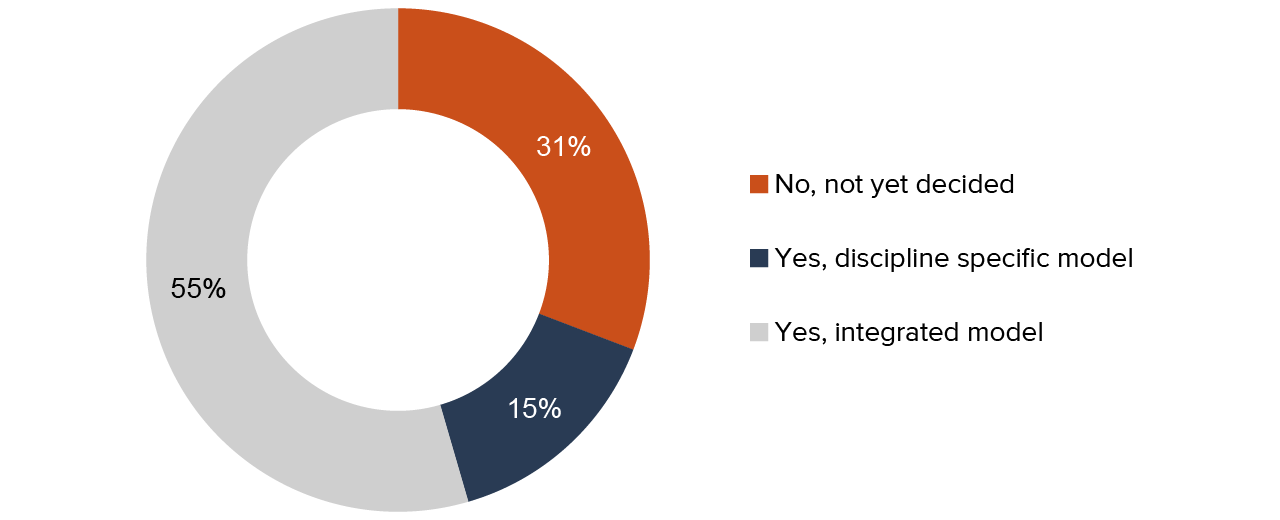
Almost half of the respondent districts in our 2019–20 survey had chosen the three-course model for their high schools. There was very little change from 2016–17 to 2019–20 in the share of districts that had decided on a model—about 30 percent of districts remained undecided (Figure 6). High-need districts were a bit less likely to have chosen a new course model for high schools (34%).
Most high schools that had chosen a CA NGSS-aligned course model chose the three-course option

SOURCE: Authors’ calculations.
NOTE: Sample includes 213 respondent districts.
The abrupt switch to remote learning in spring 2020, and the prolonged school closure during the 2020–21 school year, disrupted district progress toward implementing CA NGSS—as we will see in the next section.
COVID-19 Derailed Science Education in Most Districts
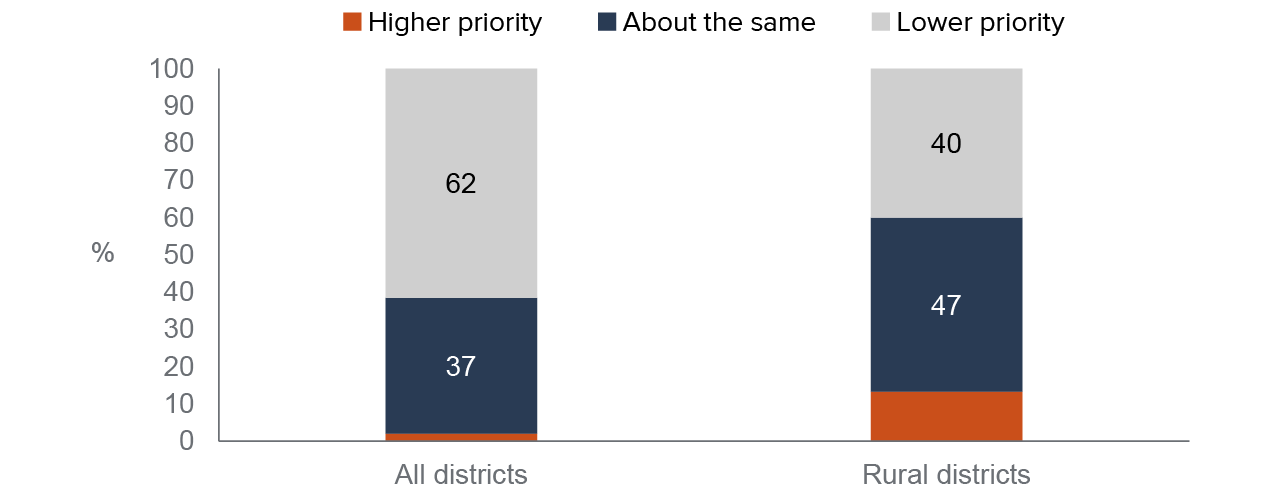
More than 60 percent of district respondents to our survey reported that science became a lower priority during the 2020–21 school year (Figure 7). Interestingly, only 40 percent of rural districts reported making science a lower priority. Interviews with science educators in two large rural counties suggested that lower population density, remote location, and ample outdoor space made it easier to continue science education during the pandemic. Nationwide, rural schools are also more likely to return to in-person instruction (Berger et al. 2022). Some rural schools closed only briefly in spring 2020, whereas most students learned remotely throughout 2020–21 (Burbio 2020, 2021).
Science became a lower priority in most districts in 2020–21
SOURCE: Authors’ calculations.
NOTE: Sample includes 213 respondent districts.
Key CA NGSS activities—including the adoption of instructional materials—were postponed or delayed during the pandemic. About 43 percent of districts in our survey sample had not adopted CA NGSS-aligned instructional materials for K–8 before the pandemic, while 64 percent of respondents had not adopted CA NGSS-aligned materials for high schools. More than 60 percent of those districts—but fewer than half of those in urban areas—said COVID-19 delayed their selection process (Figure 8).
Urban districts were less likely to report that COVID-19 delayed their CA NGSS textbook adoption

SOURCE: Authors’ calculations.
NOTE: Sample includes 43 districts that had not adopted NGSS aligned textbooks for K–8 and 64 districts that had not done so for high schools before COVID-19. Sample is too small to break down by district types (unified, elementary, and high school).
The shares of districts that had not aligned their middle school and/or high school course models with CA NGSS in 2019–20 remained virtually unchanged during the pandemic (Gao et al. 2018). A large majority of districts said that COVID-19 delayed their local process (Figure 9). The sample size is too small to break down by district characteristics.
Most districts reported that COVID-19 delayed their alignment of science courses with CA NGSS

SOURCE: Authors’ calculations
NOTE: Sample includes nearly 60 districts that had not aligned their middle/high school science sequence prior to COVID-19. Because the sample size is too small, we did not break down the analysis by district characteristics such as high-need student share or locale.
Teachers’ instructional materials and methods were particularly affected
We developed a small survey to understand how the pandemic affected science teacher instruction. The California Science Educator Association (CASE) shared the teacher survey with its members and 124 science teachers answered the questions. More than 90 percent are middle school or high school science teachers. Seventy-four percent have a master’s degree or higher, and the average teaching experience is 16 years. Because of the small sample, we do not show any sub-group analysis and caution that the findings should not be generalized to all science teachers across California.
Compared to a normal school year, nearly 70 percent of the teachers in our sample reported using more free online lessons or resources during COVID-19 (Figure 10). About 40 percent used more open education resources, fee-based online resources, and online units that students study at their own pace.
Most science teachers in our sample used more free online resources during COVID-19

SOURCE: Authors’ calculations.
NOTE: Sample includes 124 science teachers. Examples of open education resources include OpenSciEd, InquiryHub, and Achieve. Here, we report the top five responses.
Most of the online lessons, resources, or units that these teachers used were not fully aligned with CA NGSS (Figure 11). This may help explain some of the delay in aligning classroom instruction with the new standards.
Most of the online resources our sample of science teachers used were not fully aligned to CA NGSS

SOURCE: Authors’ calculations.
NOTES: Sample includes 124 science teachers. Here we report the top four responses. The state provided a list of approved K–8 materials in 2018; and the California NGSS Collaborative, which includes CDE, California Science Project, CASE, CCSESA and K–12 Alliance) provided toolkits to help districts evaluate, select, and adopt standards aligned instructional materials. Because of those efforts, awareness about NGSS alignment is generally high.
Most schools remained closed for in-person instruction during the 2020–21 school year. As a result, the vast majority of science teachers (78%) reported doing more asynchronous instruction in 2020–21 (Figure 12). Because of reduced access to science labs, 45 percent of teachers reported doing more teacher/peer-led science demonstrations—for example, teaching students about static electricity by rubbing a balloon on the head, placing the charged balloon near an empty soda can, and showing it rolling toward the balloon. Some of the districts interviewed mentioned shipping or delivering science materials and tool kits to students’ homes, and some teachers made great use of everyday household items (such as baking soda). Many districts provided printed—instead of digital—materials to supplement student learning, and about one in five teachers reported using mostly printed material during distance learning.
Most science teachers in our sample provided more asynchronous instruction in 2020–21

SOURCE: Authors’ calculations.
NOTES: Sample includes 124 science teachers. Live instruction refers to synchronous instruction—most schools were closed for in-person instruction at the time of survey.
Instructional trends improved in fall 2020 and spring 2021, as teachers went from mostly reviewing content to primarily teaching new content. Nearly half of teachers nationwide said they primarily reviewed content rather than teaching new content in spring 2020 (Besecker, Thomas, and Daley 2020; Hamilton et al. 2020). In fall 2020, most California school districts focused their remote content on new material (Gao, Hill, and Lafortune 2021). And in fall 2021, the vast majority of science teachers in our sample taught mostly new content (Figure 13).
Most science teachers in our sample report teaching new content during the 2020–21 school year

SOURCE: Authors’ calculations.
NOTE: Sample includes 124 science teachers.
Most teachers in our sample covered less than 50 percent of the intended curriculum during the 2020–21 school year (Figure 14). Fifty-one percent of science teachers said most students in their class completed the assignments, and close to a quarter said 75 to 100 percent of students completed their assignments (Figure 15). This finding is roughly on par with national numbers. In a national representative survey conducted in 2020, 52 percent of teachers in all subject areas reported that fewer than half of students completed distance-learning activities (Hamilton et al. 2020). Non-completion may indicate that students are learning at a slower pace. We asked the teachers in our sample to identify the factors contributing to non-completion. Most teachers (56%) said student engagement was the biggest factor (Figure 16). Other important factors include parental involvement (46%), home environment (45%), lack of social-emotional support (27%), lack of academic support (22%), and lack of internet/device (11%). All of those factors point to the disruptive impact the pandemic has had in students, families, and their communities.
Most science teachers in our sample covered less than half of the intended curriculum in 2020–21

SOURCE: Authors’ calculations.
NOTE: Sample includes 124 science teachers.
Most science teachers in our sample reported that more than half of students completed assignments in 2020–21

SOURCE: Authors’ calculations.
NOTE: Sample includes 124 science teachers.
Surveyed science teachers identified student engagement as the key factor in non-completion of assignments

SOURCE: Authors’ calculations.
NOTE: Sample includes 124 science teachers.
The quality of instruction may have suffered in 2020–21 because of inadequate professional learning opportunities. Research shows that 80 hours of intensive professional learning is required to change/shift teacher instruction; and an additional 80 hours are needed to change the classroom environment (Supovitz and Turner 2000; Kenney 1998; Clewell et al. 2005). This suggests that teachers will need sustained professional learning over multiple years to fully transform their instruction—key to success of NGSS. However, in a typical year, half of public school teachers receive 9 to 32 hours of professional learning on their subject areas (National Center for Education Statistics 2017).
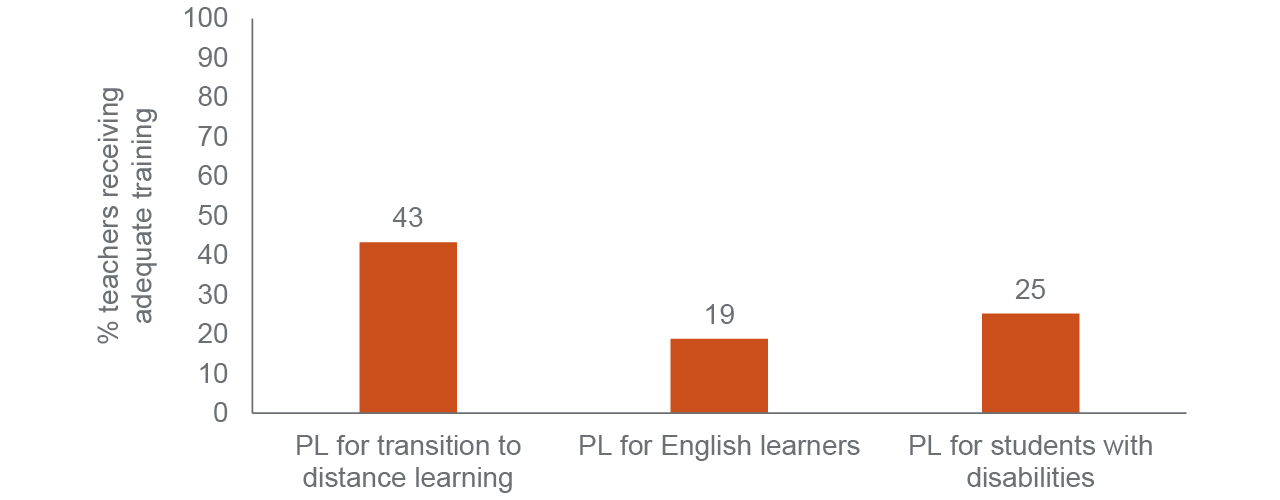
Moreover, in our survey, only 43 percent of teachers reported receiving adequate training for the transition to distance learning. Fewer than 20 percent of teachers received adequate training to support English Learners and 25 percent received adequate training for students with disabilities (Figure 17). As a result, the quality of science instruction might have suffered during 2020–21.
Most surveyed science teachers did not receive adequate professional learning (PL) in 2020–21
SOURCE: Authors’ calculations.
NOTES: Sample includes 124 science teachers. In the survey we asked teachers to the extent to which they received adequate guidance and support. The responses were “very inadequate”, “somewhat inadequate”, “neither adequate nor inadequate”, “somewhat adequate” and “very adequate.” In this figure we show the results for “somewhat adequate” and “very adequate.”
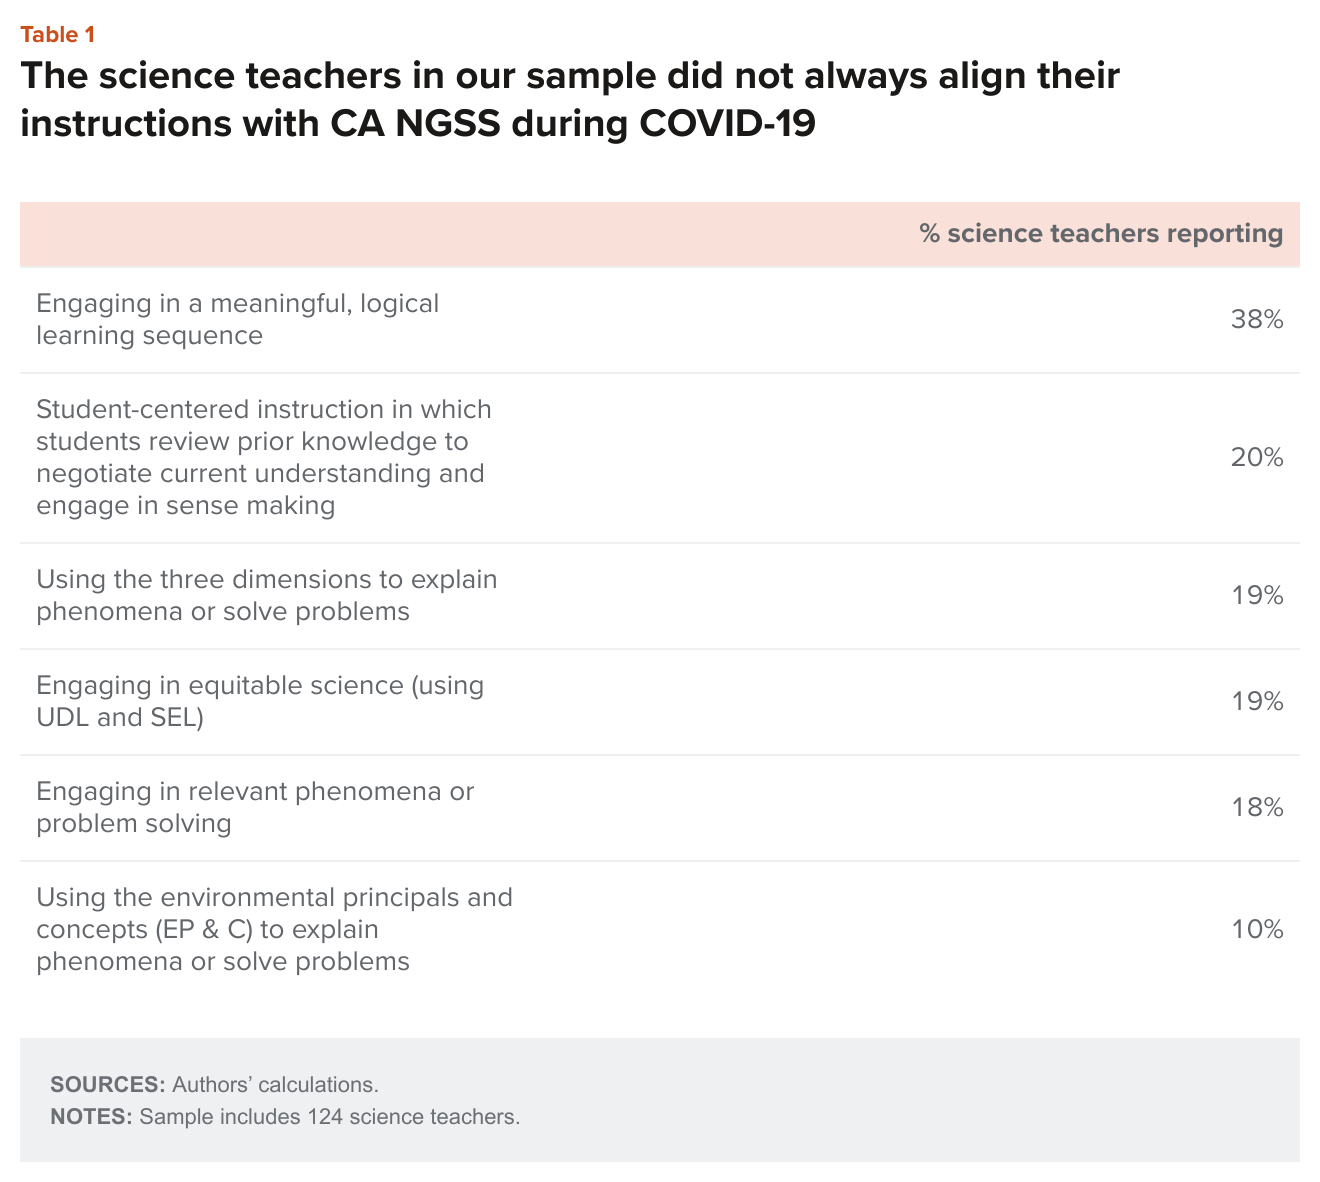
In our survey we asked how often teachers engaged in CA NGSS–aligned instruction (Table 1). Fewer than 20 percent said they always engaged in relevant phenomena or used the three dimensions—scientific practices, crosscutting concepts, and disciplinary core ideas— to explain phenomena or solve problems. Thirty-eight percent of teachers said they engaged students in a meaningful, logical learning sequence, and 20 percent provided student-centered instruction, in which students reviewed prior knowledge to negotiate current understanding. Very few teachers used environmental principles and concepts (EP & C) to explain phenomena.
Support for Science Learning during COVID-19 Was Limited
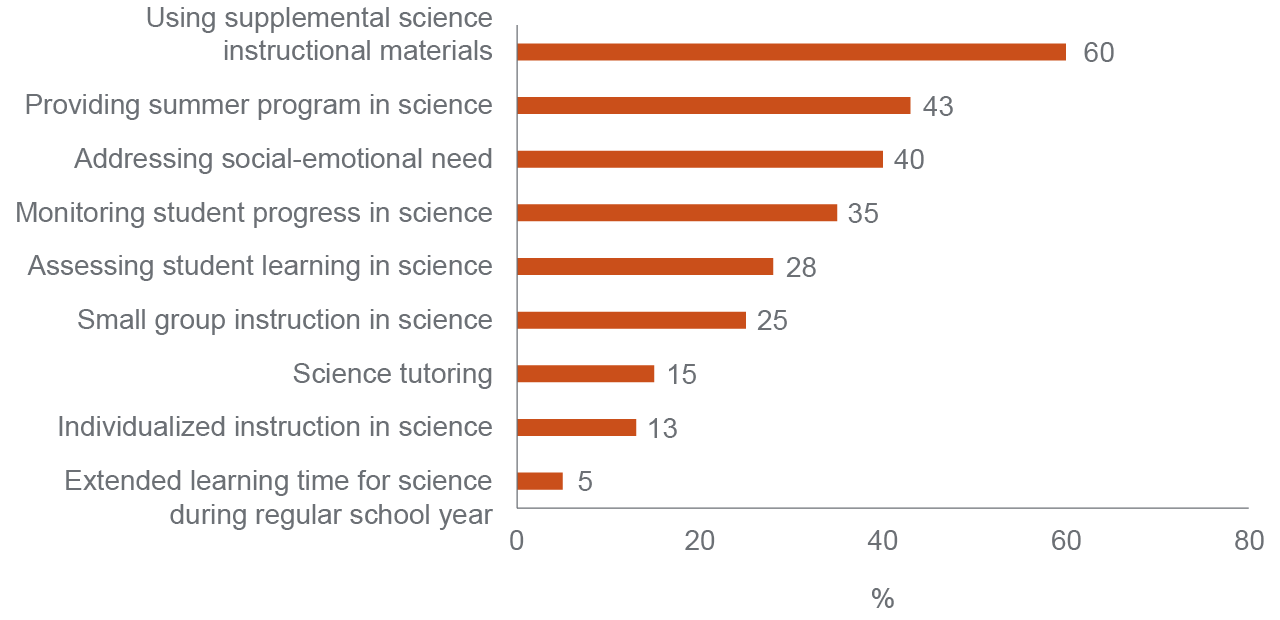
Districts as well as county offices of education provided limited support for science education during the pandemic. Most districts provided supplemental instructional materials, including some of the online resources that the teachers we surveyed reported using (Figure 11). Forty percent of districts provided services and programs to support social-emotional learning (Figure 18). However, compared to math and ELA, the range of science programs districts provided is limited. For example, 89 percent of districts administered tests to assess student learning in math/ELA, while only 28 percent did in science. Nearly two-thirds of districts provided small group instruction for math/ELA, compared to 25 percent in science. Close to half of districts provided extended learning opportunities or individualized instruction in math/ELA, but very few districts did so for science (Gao, Hill and Lafortune 2021). Forty-three percent of districts offered summer programs in science in summer 2021, and most of these programs prioritized students who were academically behind. Rural districts were more likely to assess student learning, but there were no significant differences across other district characteristics (Technical Appendix B Table 3).
Supplemental science instructional materials were the most common type of district support during the pandemic
SOURCE: Author’s calculations.
NOTE: Sample includes 213 respondent districts.
The California County Superintendents Educational Services Association (CCSESA) organizes the 58 county superintendents of schools into 11 service areas/networks to identify and promote quality, cost-effective educational practices and services and provide support to school districts. Each service area/network has a science regional lead, and we interviewed ten out of eleven of these leads. We learned that county offices provided professional learning to districts mainly on a contractual basis (charging districts a fee), and science leads worked with partners to develop statewide resources.
Before the pandemic, all county office regional leads offered services for science education. As CA NGSS implementation began to expand after the state adopted the standards in 2013, county offices offered increased support. Six out of the ten offices hired more people to provide science programs. Four out of ten county superintendents made science a county priority through programs in areas such as STEM or environmental literacy. In these counties, personnel received additional funding through grants like the National Science Foundation and by establishing partnerships with the local community and businesses to expand their science programs. Five out of the ten supported science but did not advocate for it.
During COVID-19, all ten of the regional leads we interviewed continued to provide science professional learning, with five shifting to working more with individual teachers than districts. Seven provided technical assistance through virtual professional training, addressing the use of technology in the classroom, and five offered grade-specific distance learning lessons. All lead county offices created video or webinars in addition to active online sessions. Four specifically addressed outdoor education and three provided lessons/activities for families. Six continued to work with teacher leader networks, though participation was inconsistent as the pandemic continued. Network meetings provided a forum for teacher leaders to share their work with one another, provide peer support, and get information about statewide changes—for example, changes to the California Science Test (CAST) assessment.
Four county offices continued to work with districts using CA NGSS TIME—a suite of tools and processes to help districts select instructional materials aligned with the CA NGSS. Several county offices continued to develop statewide resources with their partners as part of the CA NGSS Collaborative. For example, one county office is developing an assessment tool kit that will be used in the CA NGSS Collaborative’s Professional Learning Series in the 2022-23 school year. One county office reduced the number of staff providing content services—eliminating the science lead position—and the types of services provided to school districts.
Most District Recovery Plans Have Not Prioritized Science Education
When we asked districts how math, ELA, and/or science are prioritized in their recovery plans, only 27 percent of respondents said science is a high priority, whereas more than 80 percent said math/ELA is a high priority (Figure 19). Urban districts were less likely to report science being a high priority (Technical Appendix B Figure 2).
Only about one in four districts reported that science is a high recovery priority

SOURCES: Authors’ calculations.
NOTE: Sample includes 213 respondent districts.
To explore districts’ plans to support science education in coming years, we downloaded Local Control and Accountability Plans (LCAPs) for the 2021–24 school years; 858 of 1,034 district plans (83%) are posted online. We found that 14 percent of the LCAPs did not mention science or CA NGSS; among those that did, most did not discuss specific programs or attach dedicated resources. Close to half of districts plan to adopt, develop, or purchase standards-aligned instructional materials. Thirty-eight percent plan to provide teacher training; 32 percent set student performance goals for the California Science Test (CAST); and 25 percent plan to provide extended learning opportunities, such as after-school and enrichment programs. Less commonly mentioned plans include allocating dedicated staff (such as TOSA or coordinator) to support science teachers (14%), purchasing science lab equipment and materials (14%), and using teacher surveys to measure and monitor local implementation (13%).
Districts’ plans to support science education
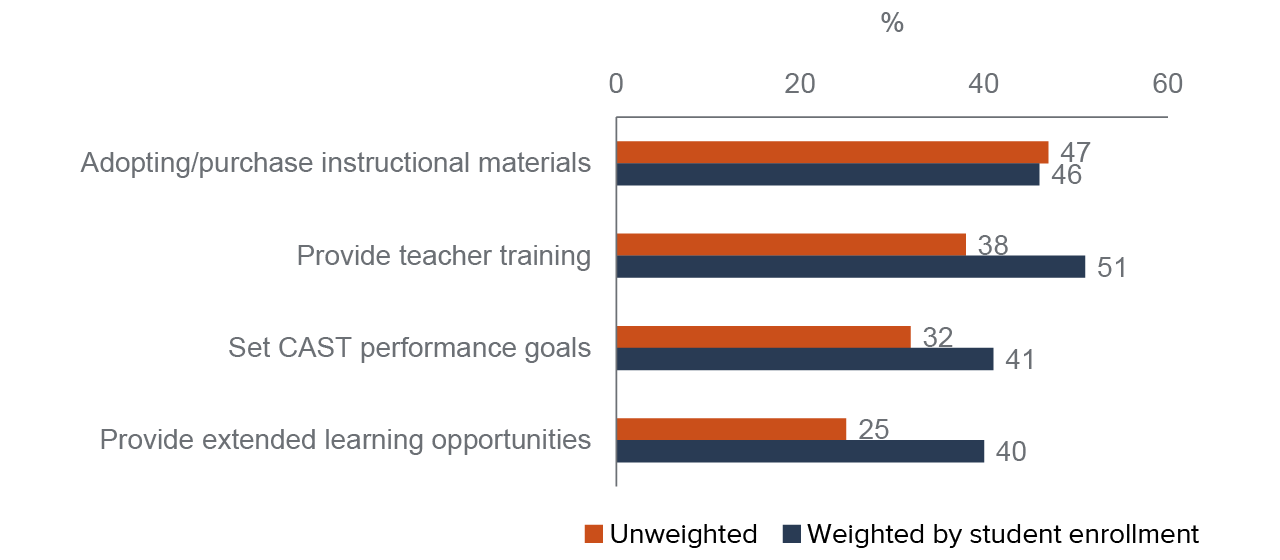
SOURCE: Authors’ calculations.
NOTES: Sample includes the universe of 2021–24 LCAPs (N=858). Fourteen percent of LCAPs did not mention science education or NGSS. Among those that mentioned science education, most did not discuss specific science programs or include dedicated resources.
High-need and high-poverty districts are more likely to provide extended learning; urban districts are more likely to allocate funds for dedicated staff; and rural districts are more likely to focus on science course offerings and access (Technical Appendix B Table 4). Insofar as districts may not include science programs in LCAPs, our data may underreport the number and type of science recovery programs. Nevertheless, interviews with school districts, county science leads, science education partners, and state policymakers suggest the opposite is indeed happening: because the state does not require districts to address science education in LCAPs, local districts continue to prioritize math and ELA and most do not dedicate resources to support science programs.
County Offices Are Adapting to District Needs during Recovery
District prioritization of ELA and mathematics—as well as social and emotional learning—in their recovery plans has caused most COEs to alter their roster of services: seven of the ten COE science leads we interviewed are offering fewer professional learning opportunities due to decreased demand from districts. In districts that are trying to promote science, professional learning has been hampered by a lack of classroom substitutes—which makes it hard for teachers to have release time for professional learning.
However, there have been several positive developments. In addition to professional learning, COE science leads continue to provide support and technical assistance to the county offices in their regions; they are also working collaboratively on regional and statewide services. Two county offices have continued full speed ahead with grants from federal agencies such as the National Science Foundation, private foundations, and local community organizations or businesses. One county office is continuing to develop an assessment tool kit for statewide distribution. Four county office leads reported providing CA NGSS TIME services to districts who are ready to adopt science textbooks. One county office has developed an online CA NGSS Foundation Course for teachers across the state who are new to CA NGSS. Four county office leads reported success in combining science and literacy; one offered a “summer camp” for students with this as a theme. Several county offices have continued to develop “science outdoors” programs, and one is developing programs with a focus on environmental justice.
All of the science leads reported efforts to re-establish relationships with districts and to design programs to meet their needs. A common refrain among science COE personnel is “good NGSS teaching is for all students.” Programs designed to meet the needs of English Learners are more common than programs for low-income students. In many county offices, the science and EL coordinators are working together, and three county offices reported doing outreach to low-income districts to promote science education. One county office is offering free services, and two county offices are developing free or low-cost science resources. Students with disabilities are least likely to be the focus of special CA NGSS programs. All COEs reported that these students’ needs were being addressed by Special Education Local Plan Areas (SELPAs), although one county office recently applied for a National Science Foundation (NSF) grant with a focus on special education and science.
Policy Recommendations
Before the pandemic, most California districts were in the early stages of implementing the new science standards, and some districts were headed toward full implementation. However, COVID-19 caused major disruptions to CA NGSS implementation in most districts, and these disruptions may affect student learning for years to come.
The Next Generation Science Standards Systems Implementation Plan for California (2014) laid out eight strategies for ensuring an equitable implementation of CA NGSS—including the facilitation of professional learning, the provision of instructional resources, and the development of new assessments. State and local agencies need to revisit these strategies and develop policies to support the vision of NGSS for all students. We offer the following recommendations:
- The state should include science in its district accountability requirements. In part, science education became a lower priority for most districts because the state did not explicitly ask districts to address “pupil learning loss” in science in their Learning Continuity and Attendance Plans, and science programs were not mentioned in state guidelines for spending stimulus money. The inclusion of science indicators in the state’s accountability measure can encourage districts to prioritize science education and dedicate resources to support CA NGSS implementation. Adding performance data for the California Science Test to the California School Dashboard will be a step in the right direction. To avoid unintended consequences such as teaching to the test and focusing on “bubble students” scoring just below the proficiency benchmark, the state should consider using multiple measures—including local formative assessments, science course taking and completion, and a suggested range of instructional minutes in elementary schools—in addition to test scores. The state could also add a line item for science education to LCAPs to encourage local districts to engage multiple educational partners and develop programs that support the educational needs of all students.
- The state could provide dedicated funding for professional learning opportunities in science. Professional learning presents big challenges in CA NGSS implementation, and most teachers were not getting the professional training needed to implement the new standards even before the pandemic (Gao et al. 2018). And while federal and state governments have provided unprecedented levels of school funding to help schools recover from the pandemic, most districts are not prioritizing science in their recovery plans. The state allocated $1.25 billion in Common Core Implementation Funds, and it could provide similar level of support to CA NGSS implementation.
- The state needs to provide more evidence-based strategies to support science learning recovery. The state’s current Elementary and Secondary School Emergency Relief (ESSER) and Expanded Learning Opportunities grant guidance do not include any mention of science, which may be discouraging districts from investing stimulus dollars in science programs. The state needs to update its guidelines to include evidence-based strategies to guide districts’ recovery efforts.
- Educational partners need to build a statewide coalition. This includes working with science educators, parents and caregivers, students, community-based organization, and research communities to highlight the importance of science literacy/education, raise awareness and urgency among policymakers, and secure resources and buy-in to support science education.
The Next Generation Science Standards describe a new vision for science teaching and learning that, if implemented well, could catalyze improvements in science literacy and increase the global competitiveness of the US labor force (National Research Council 2013; Pruitt 2014; Stage et al. 2013). As schools recover from the COVID-19 pandemic, continued commitment from state, district, school leaders, and teachers will be required to support an effective and equitable recovery in science too.
Topics
K–12 EducationLearn More

California Needs More Math and Science Teachers
Commentary: California Must Prioritize Science Education to Stay Competitive

Implementing the Next Generation Science Standards: Early Evidence from California

Video: The Impact of COVID-19 on Science Education

Prioritizing Computer Science in California Schools
