
Table of Contents
- Key Takeaways
- Introduction
- Officer Staffing Declined during the Pandemic
- Officer Demographics Have Shifted
- Staffing Trends Vary by Agency Type and Size
- Factors Related to Law Enforcement Staffing
- Survey Insights from Law Enforcement Agencies
- Conclusion
- Notes and References
- Authors and Acknowledgments
- PPIC Board of Directors
- Copyright
Key Takeaways
Law enforcement agencies at the state, county, and local levels employ more than 77,000 individuals with arrest powers across California, spending about $28 billion on policing. Research shows that hiring additional law enforcement officers reduces crime, especially violent crime. Yet agencies have experienced several challenges around officer recruitment and retention in recent years amid the COVID-19 pandemic, economic uncertainty, and societal changes.
In this report, we bring together several new and underused data sources to provide key trends and context for understanding officer staffing in California, highlighting several possible challenges for agencies moving forward.
- The number of officers has decreased since the pandemic. Despite small growth over the last two years, the statewide officer count (77,200) in 2024 is 3 percent less than it was in 2019 (79,600). California has 196 officers per 100,000 residents, down from a peak of 221 in 2008. →
- Officer demographics have shifted. Although officers are predominantly male, the share of female officers has risen over time, from 12.8 percent in 2005 to 15.3 percent in 2024. Looking at race/ethnicity, representation of white and Black officers has declined over the last two decades, while representation of Latino officers has increased significantly and representation of Asian officers has remained largely unchanged. Average officer age and tenure have stayed relatively stable. Recent research shows benefits to having more female, Latino, Black, older, and experienced officers. →
- Staffing trends differ based on agency size and type. While agencies of all sizes saw declines in staffing after the Great Recession, the post-pandemic drop was concentrated in large agencies with over 100 officers. In recent years, rural agencies have experienced more volatile changes in staffing than non-rural agencies. And over the last two decades, staffing levels have risen at sheriff’s departments while decreasing slightly at police departments. →
- Officer retention has declined. From 2016 to 2020, total separations—including resignations, retirements, and terminations—rose steadily at California law enforcement agencies, by about 11 percent. Separations then went up more than 30 percent between 2020 and 2022, potentially influenced by factors like the pandemic and protests following the murder of George Floyd. →
- Average salaries have decreased slightly; agencies are increasing overtime pay. After adjusting for inflation, the average base salary for officers declined between 2011 and 2023, from $116,000 to $110,000, possibly due to more experienced officers leaving. Over this time, average overtime pay grew from $10,000 to over $25,000. Though rural and non-rural agencies had similar overtime pay in 2011, there was a large difference by 2023 ($16,000 rural, $28,000 non-rural). →
- Agency competition and pay are key challenges to recruitment and retention. Respondents in our survey say that location issues, like remoteness of agency as well as housing costs and availability, also play a role. When it comes to hiring, agencies report that unqualified applicants are an issue. About 30 percent of respondents indicate that limited staff capacity has led to shifts in services or response priorities, such as deprioritizing non-criminal medical calls. →
Introduction
In the 2023–24 fiscal year, state and local governments spent about $28 billion on policing in the state, employing more than 77,000 officers with arrest powers (referred to as sworn officers or peace officers) to maintain public and traffic safety (Martin, Premkumar, and Acevedo 2026). Most agencies in California employ fewer than 50 officers, yet agency size varies greatly. The smallest agencies have no more than 10 officers, while the Los Angeles Police Department and Los Angeles County Sheriff’s Department employ nearly 9,000 officers each.
Law enforcement officers can improve public and traffic safety through enforcement (e.g., apprehending and arresting criminal suspects or writing speeding tickets), yet research highlights that their presence alone can also serve as a deterrent to crime (Weisburd 2021; Chalfin et al. 2022). Monitoring law enforcement staffing is critical as increased police staffing prevents crime, particularly violent crimes such as homicides (Evans and Owens 2007; Chalfin and McCrary 2018; Mello 2019; Weisburst 2019; Chalfin et al. 2022). However, increases in staffing also result in more low-level arrests (e.g., disorderly conduct, liquor violations, or loitering), disproportionately applied to Black people (Chalfin et al. 2022). Research finds that the demographic breakdown of officers matters as well. Having more female, Black, and Latino officers has been shown to reduce stops and arrests for low-level offenses and to reduce use of force (Ba et al. 2021a; Hoekstra and Sloan 2022). Furthermore, as officers age and gain more experience, they use less force and are more effective at reducing violent crime (Ridgeway 2020; Ba et al. 2021b).
While there has not been a systematic study of recent trends in officer staffing in California, anecdotal evidence highlights several challenges for law enforcement agencies. Media articles have noted the heavy reliance on officer overtime due to unfulfilled positions at jurisdictions like the Los Angeles County Sheriff’s Department and the Sacramento and San Diego Police Departments. For example, in Los Angeles County, the sheriff’s department paid over $500 million in overtime in 2024. To try to address hiring challenges, agencies have turned to large financial offers for recruitment. The Alameda Police Department made headlines by offering a $75,000 hiring bonus for new recruits. Staffing shortages have also led some departments to cut back on call responses or even eliminate active patrols at times, which the Tehama County Sheriff’s Department did in 2022.
In this report, we explore trends in law enforcement staffing, bringing together datasets that have not been systematically analyzed before. We first explore staffing trends over time and differences across agencies of various sizes and types. Next, we take a close look at factors related to these overall trends, including separations (i.e., resignations, retirements, and terminations), new hiring, and changes in officer pay. Then we present findings from our original survey of law enforcement agencies to provide further insight on the challenges agencies are facing when it comes to hiring and retaining officers in California. Finally, we conclude with a summary of our findings and potential next steps.
Officer Staffing Declined during the Pandemic
Law enforcement is a significant part of state, county, and local government services. In 2024, nearly 120,000 individuals were employed by law enforcement agencies across the state, including the California Highway Patrol (CHP), 58 county sheriff’s departments, 336 municipal police departments, and 76 other state and local agencies.
Of the 120,000 individuals employed by these law enforcement agencies, about 77,000 were sworn staff with full arrest powers. In 2024, municipal police departments employed nearly 37,000 officers, county sheriff’s departments had over 30,000 officers, and CHP employed almost 7,000 officers. The remaining agencies had 3,100 officers.
Not surprisingly, staffing numbers vary widely across the state. The smallest sheriff’s department, Sierra County, had 10 officers in 2024. The largest department, Los Angeles County, had almost 8,900 officers. The small town of Westmoreland, located in the Imperial Valley, had the smallest police department with just three officers, while the Los Angeles Police Department had around 8,800 officers. In 2024, there were 177 agencies in California with fewer than 25 officers, 188 agencies employing between 26 and 100 officers, and 111 agencies with more than 100 officers.
California has 196 officers per 100,000 residents. For context, this is less than the national rate of around 240 officers per 100,000 residents in 2018 (the most recent year of data for a reliable comparison), but more than the rates of two neighboring states, Oregon (160) and Arizona (192). This rate also varies greatly across California counties, with no discernible pattern when comparing rural and non-rural counties. As shown in Figure 1, we see some small, rural counties (e.g., San Benito and Del Norte) with only around 100 officers per 100,000 residents. At the same time, rural counties such as Mariposa, Mono, and Alpine Counties have over 390 officers per 100,000 residents. This variation holds true for larger counties as well. For example, Orange County has 149 officers per 100,000 residents, while San Francisco has 315.
Officer staffing varies widely across California counties
Officers per 100,000 residents
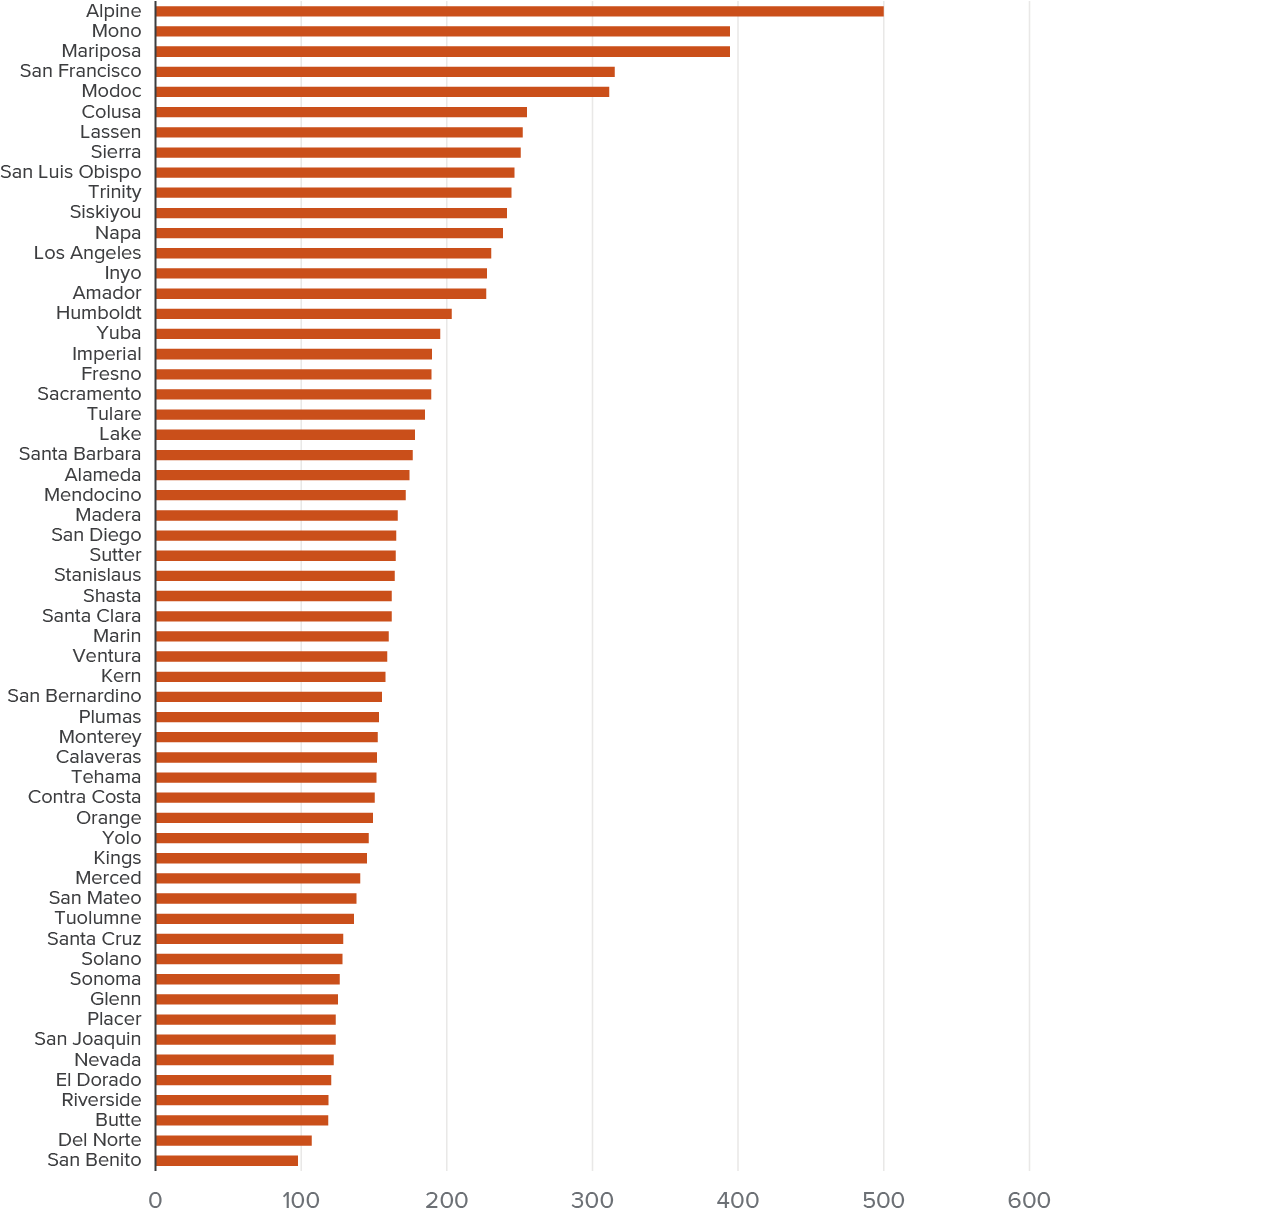
SOURCES: Authors’ calculation based on California Department of Justice’s Law Enforcement Personnel Survey and California Department of Finance Population Data, 2024.
NOTE: The CA DOJ collects the Law Enforcement Personnel data through a one-day survey taken on October 31st of each reporting year.
Staffing Has Not Fully Recovered from Recent Declines
Since public agency budgets depend heavily on tax revenue, staffing may change based on economic and fiscal trends, and staffing counts can fluctuate from year to year. Statewide, officer staffing levels declined significantly during the pandemic but increased in 2023 and 2024. Despite small growth over the last two years, the statewide officer count in 2024 (77,161) was 3 percent below what it was in 2019 (79,568). Officer staffing at police departments was down 4 percent, staffing at sheriff’s departments was down 2 percent, and staffing at CHP was down 5 percent compared to 2019.
Looking at historical trends over the last 35 years in Figure 2, we find that, outside of a few dips in the 1990s and early 2000s, officer staffing gradually increased until reaching a peak of 221 officers per 100,000 residents in 2008. After the Great Recession (2008–2009), staffing dropped significantly to 200 officers per 100,000 residents by 2013, a nearly 10 percent drop, showing that law enforcement staffing can be sensitive to economic swings. After 2013, the staffing rate stayed relatively steady, with a slight dip during the pandemic, and was 196 officers per 100,000 residents in 2024.
Officer staffing reached a peak in 2008, then declined during the Great Recession and the pandemic
Officers per 100,000 residents
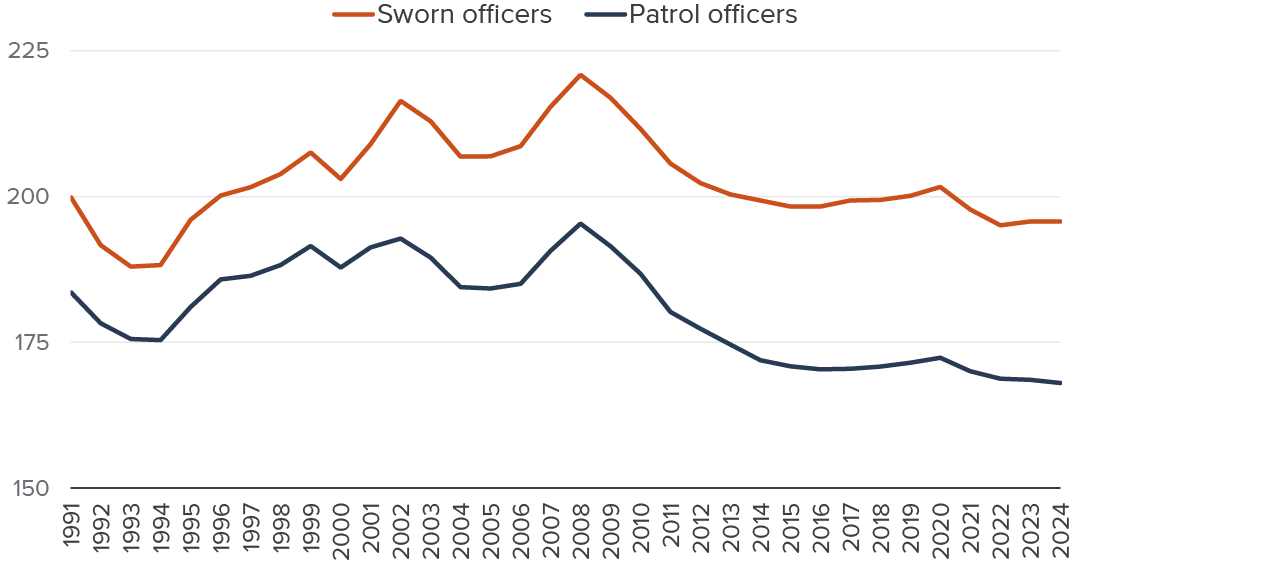
SOURCES: Authors’ calculation based on California Department of Justice’s Law Enforcement Personnel Survey and California Department of Finance Population Data, 1991–2024.
NOTE: The CA DOJ collects the Law Enforcement Personnel data through a one-day survey taken on October 31st of each reporting year.
Officer Demographics Have Shifted
Officer demographics are an important consideration, as having more female, Black, and Latino officers has been shown to reduce stops and arrests for low-level offenses and to reduce use of force (Ba et al. 2021a; Hoekstra and Sloan 2022). Officers generally come from the communities they serve, and the demographics of California have also changed over the last two decades (Johnson et al. 2023). In this section, we examine staffing trends across a variety of dimensions, including gender, race/ethnicity, age, and tenure.
For the remainder of this report, we focus on county sheriff’s departments and municipal police departments, as they comprise nearly 90 percent of officers in the state. County sheriff’s departments generally provide public safety services to the unincorporated areas of the county and are responsible for running the county jail. Police departments generally provide public safety services within the defined area of a city.
While there are significantly more male officers than female officers in the state, the representation of female officers has increased over time. In 2005, there were about 55,600 male officers and 8,200 female officers. By 2024, the number of male officers was 57,300 (a 3% increase), while the number of female officers had steadily risen to nearly 10,400 (a 26% increase). To look at these trends another way, the proportion of California officers who are female has grown from 12.8 to 15.3 percent between 2005 and 2024. There is a national campaign to improve gender diversity in policing called 30×30, which has the goal of increasing the number of female recruits to 30 percent by 2030. About 60 California agencies have signed the pledge.
Looking at race/ethnicity, white officers comprise the largest racial/ethnic group among officers over the entire 20-year period we observe, but the rate of white officers has been decreasing (Figure 3). In 2005, there were roughly 260 white officers per 100,000 white Californians, but by 2024, that number was down to 220. Black officers also declined from about 200 per 100,000 Black Californians in 2005, to 173 in 2024.
While white and Black officer representation has declined over the last 20 years, representation of Latino officers has increased significantly. In 2005, there were roughly 105 Latino officers per 100,000 Latino Californians, but by 2024, that number had increased to nearly 180. Representation of Asian officers fluctuated throughout the 20-year period, but ultimately stayed steady, declining from 80 to 79 officers per 100,000 Asian Californians. Meanwhile, the number of officers in our “other” racial/ethnic category (which includes Native American, multiracial, and Native Hawaiian or Pacific Islander) increased significantly (from 98 in 2005 to 137 in 2024).
When we compare the share of each race/ethnicity among all officers with the statewide population, we find white officers are somewhat overrepresented, while Asian officers and those in the “other” racial/ethnic category are underrepresented. In 2024, white officers accounted for 43 percent of all officers, while white Californians made up roughly 34 of the overall state population. Latino officers made up 40 percent of officers in California, close to the Latino share of the statewide population (39%), and Black officers made of 5 percent of all officers, roughly equal to the Black share of the statewide population. Meanwhile, Asian officers and officers in our “other” category were below their shares of the statewide population: 8 percent versus 17 percent for Asians and 4 percent versus 4.9 percent for the “other” category.
While white officers are still overrepresented compared to the overall population, the share of white officers has declined from 65 percent in 2005. This decline, along with an increase in the share of Latino officers (about 22% in 2005), mirror shifting demographics in California’s population over the last several decades (Johnson et al. 2023).
Latino officer representation continues to increase, while Black and white officer representation has declined
Officer staffing rate (per 100k)

SOURCES: California Commission on Peace Officer Standards and Trainings (POST), 2005–2024; California Department of Finance, 2005–2024.
NOTES: The “Other” category combines officer counts for the ethnicity categories of American Indian or Alaska Native, multi-race, and Native Hawaiian or Pacific Islander. The staffing rate shows the number of officers per 100,000 individuals of each demographic group.
As officers age and gain more experience, research shows that they use less force and reduce violent crime more (Ridgeway 2020; Ba et al. 2021b). When looking at the average age of officers in California, we do not find a significant change over time. However, we see a slight increase in average age from 38.5 to just over 40 between 2007 and 2014, which aligns with a decline in hiring during this period. Then the average age fell to about 39 years old in 2024, which could be a sign that retirements of older officers have increased.
We see a similar pattern for the average tenure of officers. In 2007, the average tenure was just over 11 years; this increased to 12.5 years by the end of 2014, and then gradually returned to around 11 years by 2024 (Technical Appendix Figure A4). While these changes may not be large in magnitude, the variation over time is important to monitor given the benefits of having older and more experienced officers.
Staffing Trends Vary by Agency Type and Size
In this section, we highlight changes in staffing levels over time across agency types (e.g., sheriff’s and police departments; non-rural and rural agencies) and agency size.
Sheriff’s Departments Have Grown Substantially
Figure 4 shows a striking divergence in officer staffing trends between sheriff’s and police departments since 2005. At police departments, officer staffing increased 8 percentage points from 2005 to 2009; it then dropped dramatically from 2009 to 2013 and has not recovered since then. In 2024, police officer staffing was 97 percent of what it was in 2005. In contrast, at sheriff’s departments, officer staffing was 20 percent higher in 2024 compared to 2005. Unlike police departments, officer staffing at sheriff’s departments increased faster between 2005 and 2009, with less of a drop during the Great Recession, and rose gradually from 2014 through 2021. After the pandemic, both sheriff’s departments and police departments experienced a decline in staffing.
The increase in staffing at sheriff’s departments prior to the pandemic was most likely related to public safety realignment in 2011, which provided additional funding to county jails to manage new custody responsibilities. Notably, the count of non-jail officers working for sheriff’s departments was only about 1,000 officers more in 2024 than in 2005, whereas the number of officers working in jails across California increased by 3,000 officers over the same time period (Technical Appendix Figures A1 and A2).
Since 2005, county sheriff’s departments have increased staffing while police departments have seen a decrease
Percent change in staffing from 2005

SOURCE: California Commission on Peace Officer Standards and Trainings (POST), 2005–2024.
NOTE: The vertical axis represents the percent change in staffing relative to 2005.
Staffing Changes at Rural Agencies Appear More Volatile
A large majority of California’s population resides in large urban counties, and agencies located in rural areas may see different staffing patterns. For example, rural areas may experience greater staffing challenges because there are fewer people in these areas, making the pool of applicants smaller from the start. At the same time, rural officers may feel more connected to their jobs if they have more familiarity with their community, and working in a less populous area may give officers more opportunity to establish regular connections with civilians, which could lead to greater retention.
Figure 5 shows that while overall staffing trends in the past two decades are similar for both non-rural and rural agencies, there appears to be more volatility in rural areas, especially in the last few years. The number of rural officers dropped 14 percentage points between 2020 and 2023 (compared to only 4 percentage points at non-rural agencies), though it appears to have rebounded in 2024. The difference in patterns could stem from rural officers leaving the profession for other opportunities or moving to larger departments that have the financial resources to pay more.
Officer staffing at rural agencies is more volatile compared to trends at non-rural agencies
Percent changes in staffing from 2005

SOURCE: California Commission on Peace Officer Standards and Trainings (POST), 2005–2024.
NOTE: The vertical axis represents the percent change in staffing relative to 2005, separately by whether the agency was in a rural county as described in footnote 6.
Staffing Declines after COVID Were Driven by the Largest Agencies
As discussed above, agency size varies greatly across California. To explore staffing trends based on this dimension, we split the agencies into four equal groups (quartiles) based on the number of officers: less than or equal to 19 officers (small), 20–48 officers (mid-small), 49–103 officers (mid-large), and more than 103 officers (large).
Between 2005 and 2009, staffing levels increased similarly regardless of agency size (Figure 6). Then, during the Great Recession, agencies of all sizes saw a decline in staffing. However, the extent of the decline varied. While officer staffing at mid-small agencies dropped by a significant 12 percentage points between 2009 and 2015, the largest agencies saw a much smaller drop (just 3 percentage points) and began recovering sooner. More recently, after the pandemic, the largest agencies saw the steepest drop in staffing levels (5 percentage points), with mid-large agencies also seeing a decline of 1 percentage point. By 2024, only the smallest agencies had higher officer staffing compared to 2009 levels, before the Great Recession.
After the pandemic, drops in officer staffing have been concentrated in larger agencies
Percent change in staffing from 2005
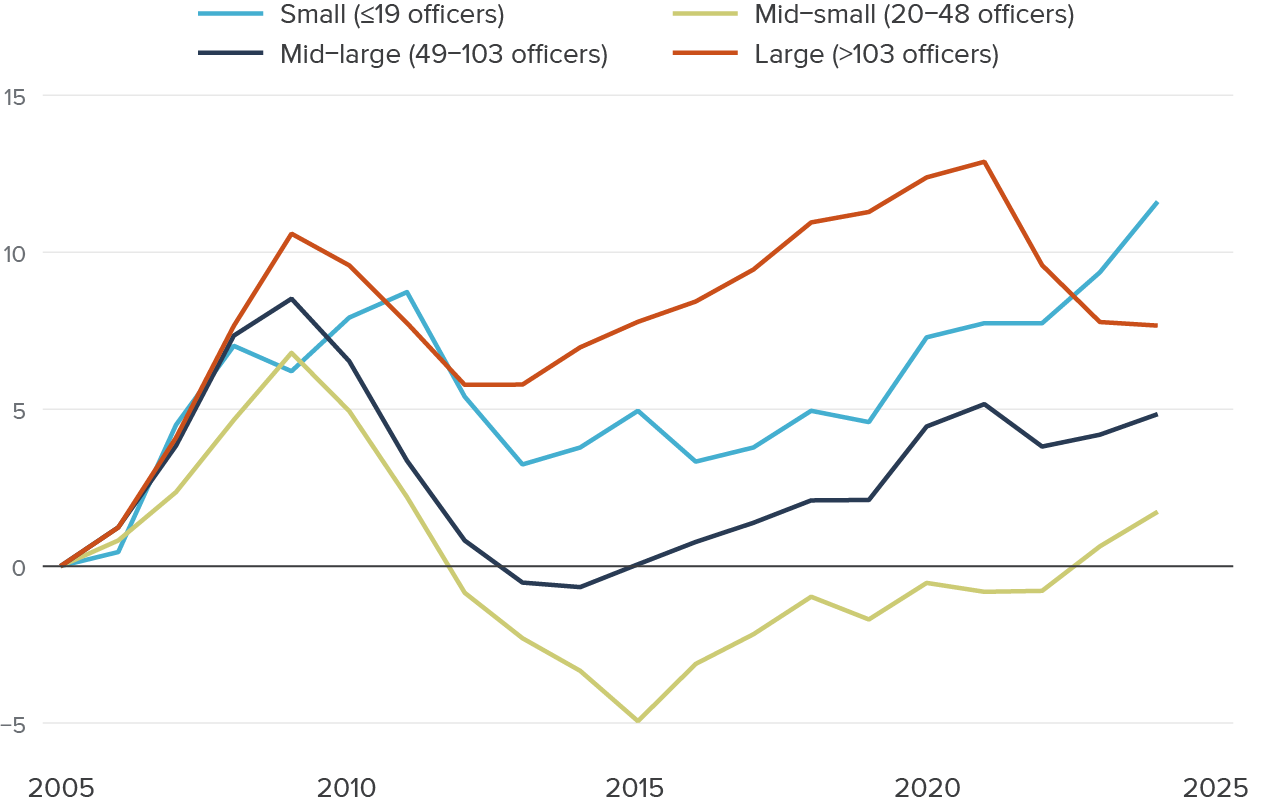
SOURCE: California Commission on Peace Officer Standards and Trainings (POST) from 2005–2024.
NOTES: The vertical axis represents the percent change in staffing relative to 2005, separately by quartile of staffing size. There are about 100 agencies per quartile. The quartiles separate agencies by number of officers: less than or equal to 19 officers in median (small), 20–48 officers (mid-small), 49–103 officers (mid-large), and over 103 officers (large).
Factors Related to Law Enforcement Staffing
After 2020, California agencies experienced a spike in separations coinciding with a temporary decline in hiring
Number of officers
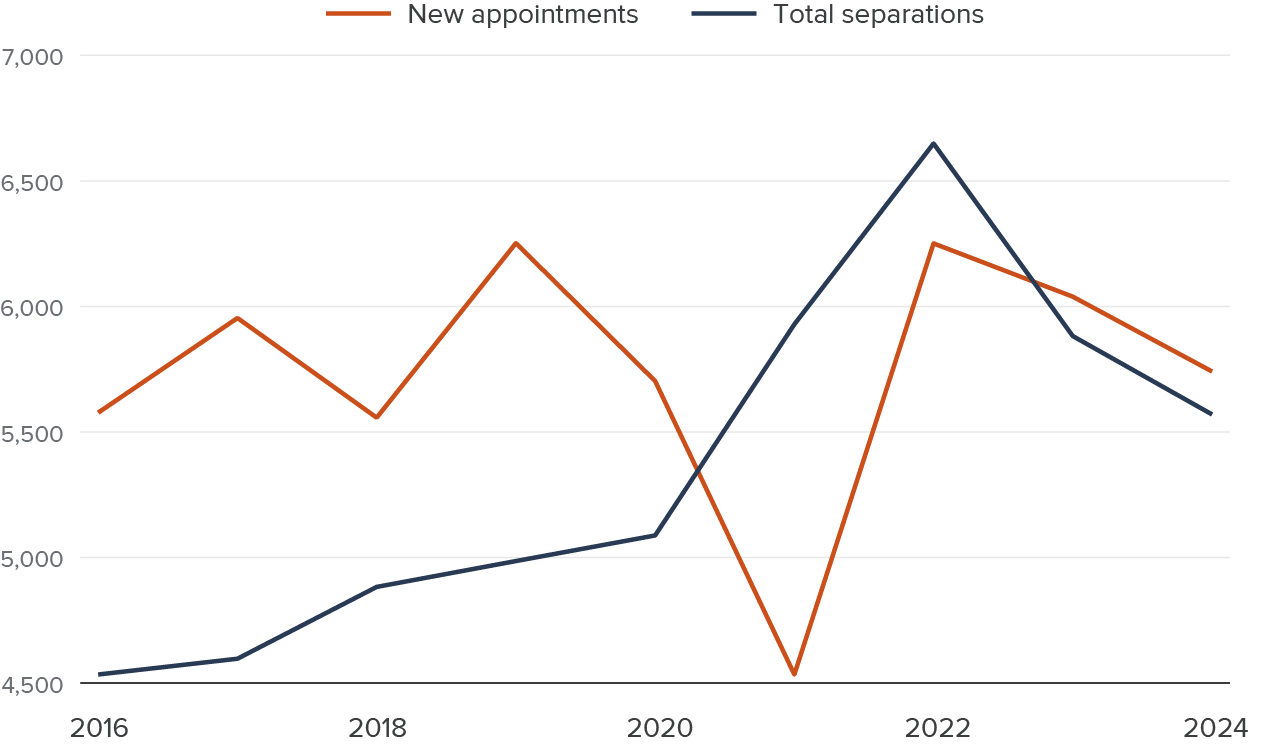
SOURCE: California Commission on Peace Officer Standards and Trainings (POST) from 2016–2024.
Agencies with more officers are driving trends in new hires and separations
Percent change since 2016

SOURCE: California Commission on Peace Officer Standards and Trainings (POST) from 2016–2024.
NOTES: The vertical axis represents the percent change in the new appointments (hiring) or total separations from 2016, separately by quartile of agency staffing. This figure only presents the two quartiles with the most officers, which comprise large agencies with over 103 officers and mid-large agencies with between 49–103 officers in median. There are about 100 agencies per quartile.
The spike in separations after the pandemic is primarily driven by resignations
Number of separations
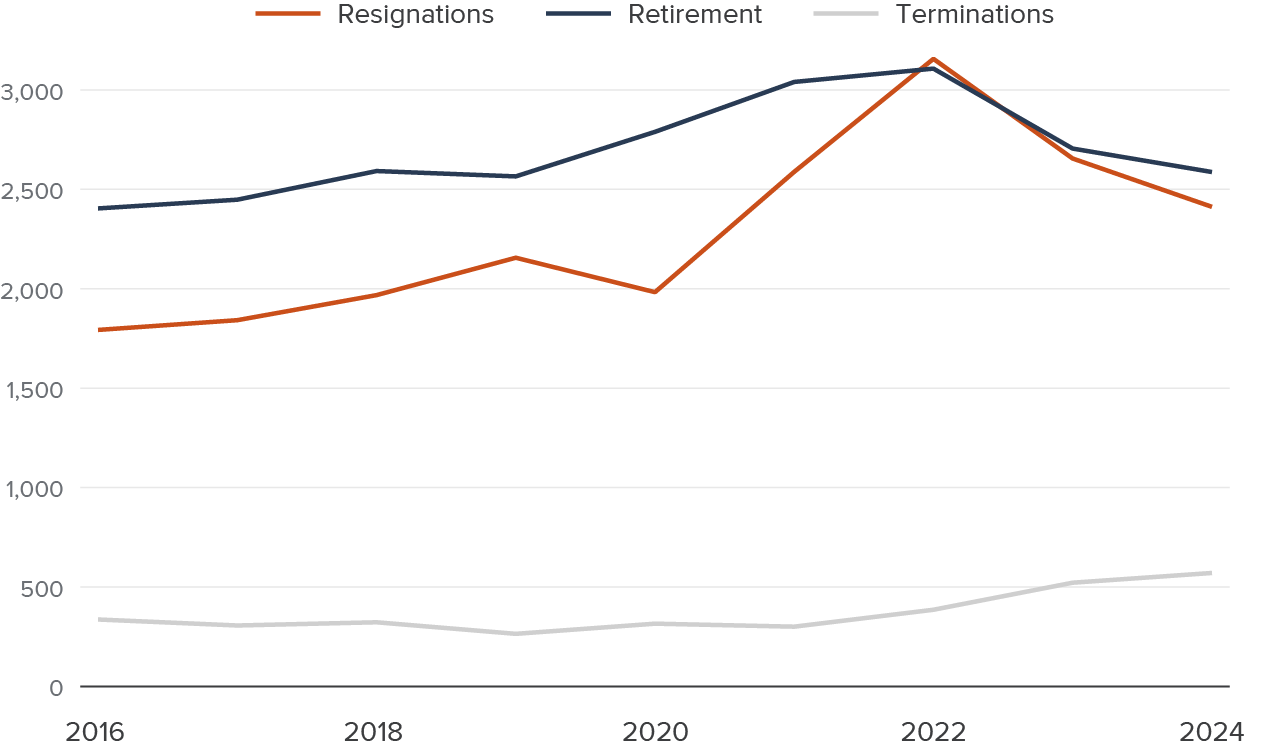
SOURCE: California Commission on Peace Officer Standards and Trainings (POST) from 2016–2024.
Sheriff’s departments saw larger percent changes for resignations, retirements, and terminations
Percent change since 2016
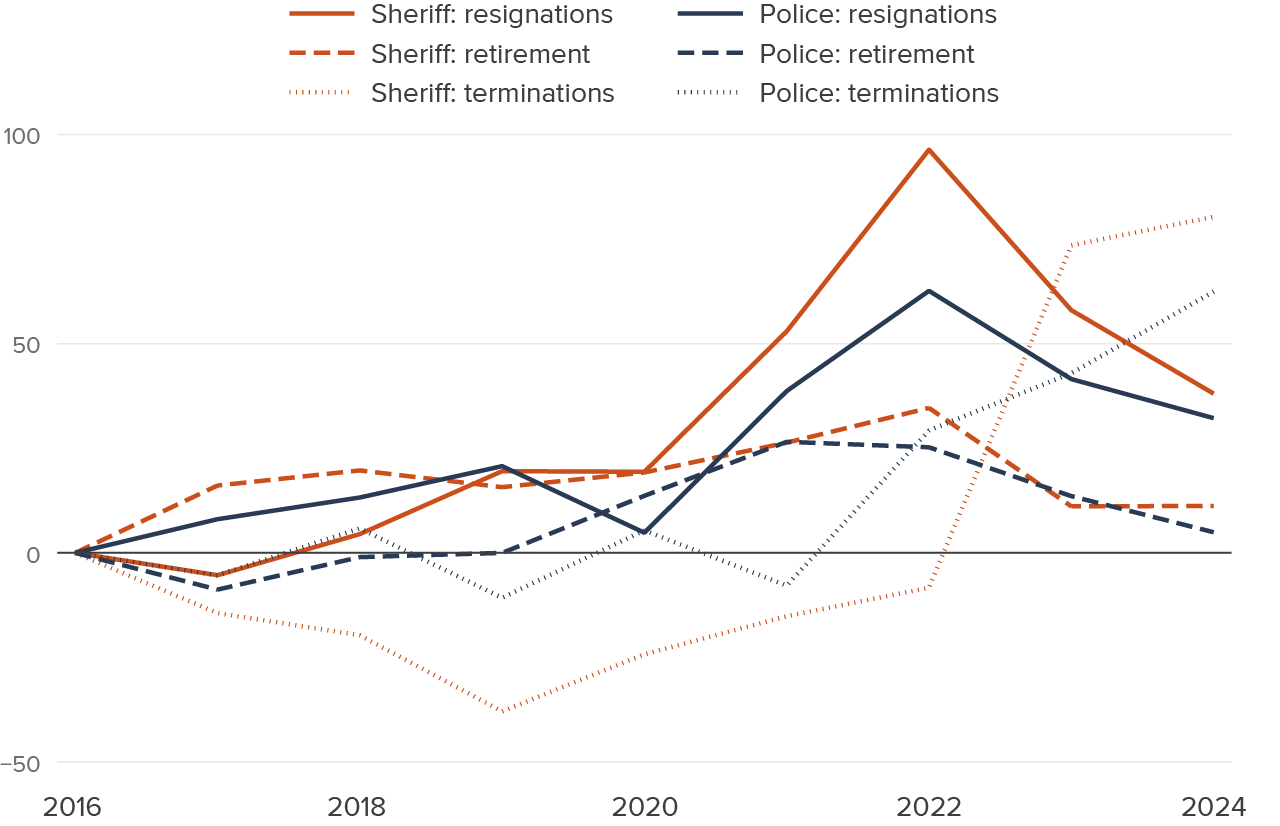
SOURCE: California Commission on Peace Officer Standards and Trainings (POST) from 2016–2024.
NOTE: The vertical axis represents the percent change in the new appointments (hiring) or total separations from 2016, separately for sheriff and police agencies.
Officer salaries in rural areas are much lower than in non-rural areas, with both declining after the pandemic
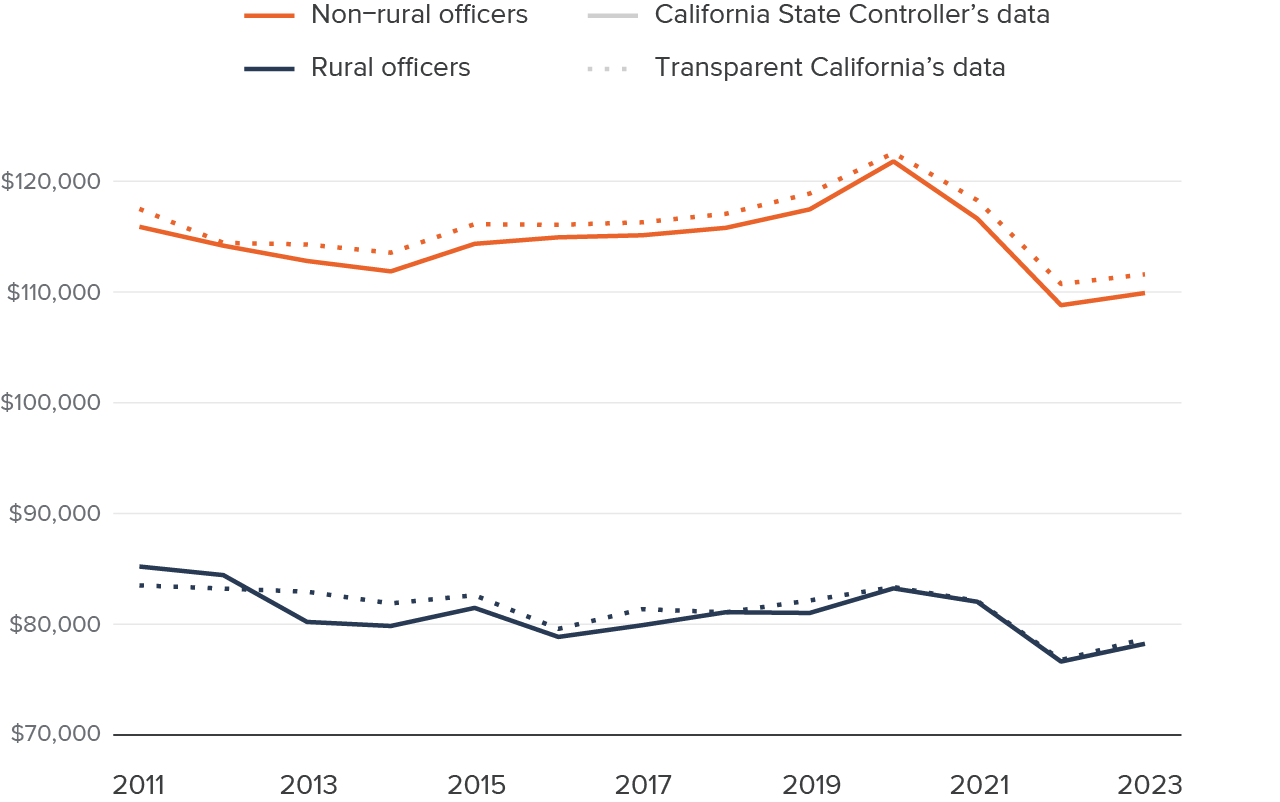
SOURCES: Transparent California, 2011–2023 Salary Data and California State Controller’s Office, 2011–2023 City and County Data.
NOTES: This figure shows the inflation-adjusted regular (also known as base) salary of sworn officers in 2023 dollars. Officers who made less than $25,000 annually or had zeros in all pay categories were removed from this analysis for that year. Sworn officers employed in California Highway Patrol were excluded from this analysis because they could not be assigned to county-level jurisdictions. An agency was designated as a “rural” agency as described in footnote 6. Transparent California’s data is presented in the dotted lines and California State Controller’s data is presented in the solid lines.
Overtime payment has increased, particularly for non-rural officers
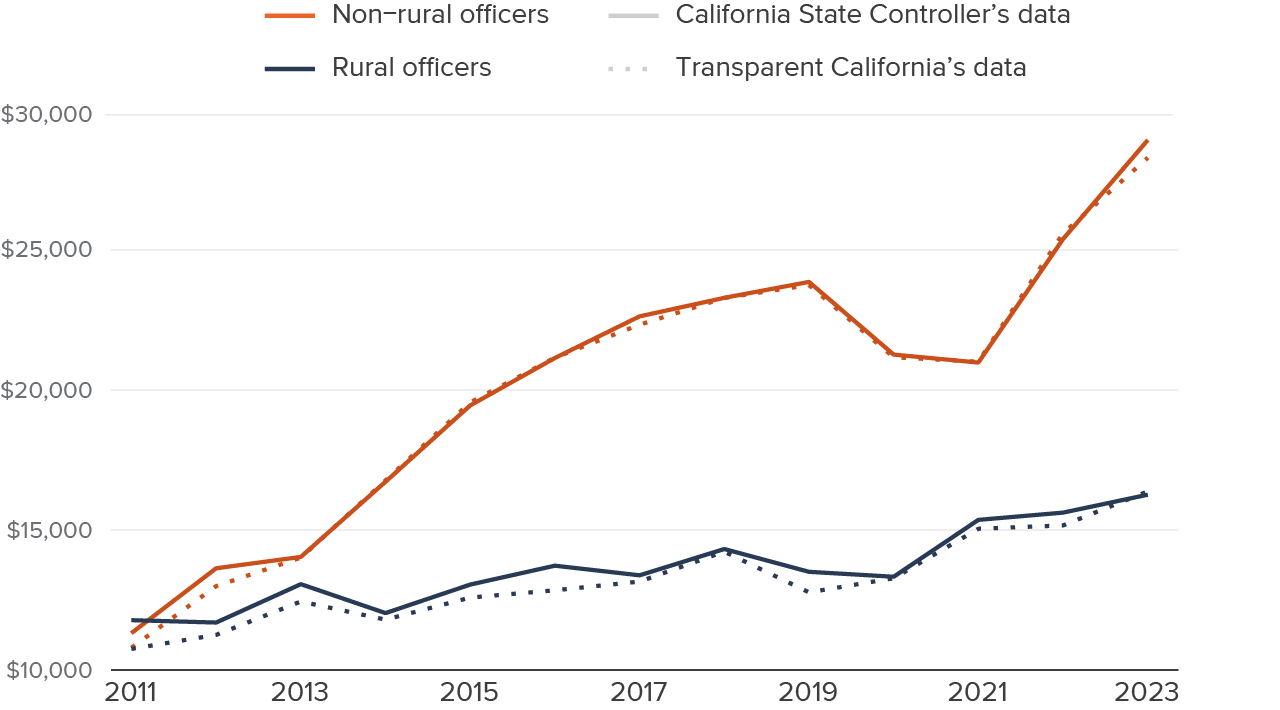
SOURCES: Transparent California, 2011–2023 Salary Data and California State Controller’s Office, 2011–2023 City and County Data.
NOTES: Figure shows inflation-adjusted overtime payment of sworn officers in 2023 dollars. Overtime pay is the amount of money paid to employees for working more than their normally scheduled hours. Officers who made less than $25,000 annually or had zeros in all pay categories were removed from this analysis for that year. Sworn officers employed in California Highway Patrol were excluded from this analysis because they could not be assigned to county-level jurisdictions. An agency was designated as a “rural” agency as described in footnote 6. Transparent California’s data is presented in the dotted lines and California State Controller’s data is presented in the solid lines.
Survey Insights from Law Enforcement Agencies
To understand law enforcement leaders’ perceptions on the most relevant factors influencing staffing trends, we administered a survey to police and sheriff’s departments across the state on the challenges related to hiring and retention. We interpret these findings to be more representative of sheriff’s departments and smaller agencies due to limited responses from police departments, especially the largest police departments (see text box).
Agency Competition Poses an Obstacle to Hiring and Retention
In our survey, agency competition, unqualified applicants, and pay emerged as the top issues in hiring and recruitment (Figure 13). Sixty-nine percent of respondents reported that recruitment challenges were most often driven by agency competition, and more than half (53%) identified unqualified applicants as a key issue. For example, one respondent stated, “Today’s applicant can pass the POST background investigation. It is not until the applicant is in field training that we learn the applicant cannot… drive under stress, listen to the police radio, pre-plan a course of action before arriving to a call, socialize with the public, communicate… effectively, and… problem solv[e] and [make decisions].” Fifty percent of respondents cited pay as an obstacle, and about 40 percent identified location as a common challenge, referring to issues like housing costs, housing availability, and the remoteness of the agency.
Competition from other agencies is the most common problem in hiring
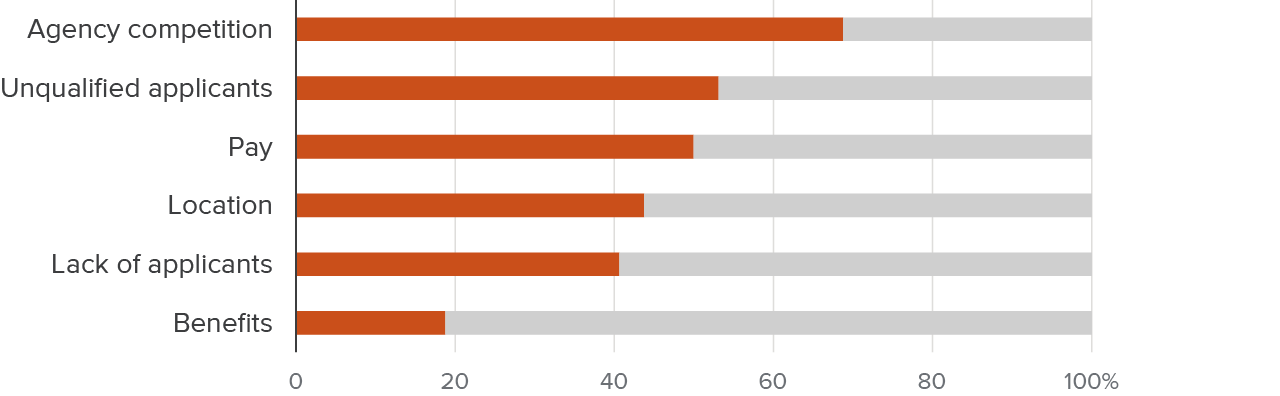
SOURCE: PPIC Law Enforcement Staffing Survey. Survey was fielded from July to August 2025.
NOTES: Survey had 41 agency responses: 19 police departments and 22 sheriff departments. PPIC’s Law Enforcement Staffing Survey asks: “What are the top four primary challenges your agency faces related to recruiting/hiring?” Other selection options included in the question and not listed (because of low respondent selection) were challenges recruiting diverse applicants, lack of modern equipment, and lack of recruiting budget.
Most agencies in our survey do not run their own academy, but agencies that do run their own academy often reported that recruits are hired into the agency before starting the academy (Technical Appendix Figure B2). Several respondents noted that recruits have become more diverse in recent years, referencing changes in gender, age, and ethnicity, with multiple respondents saying that new recruits are younger compared to five years ago. Most respondents stated that they tend to hire new recruits, as opposed to officers who have worked at another agency (Technical Appendix Figure B3).
Similar to the factors affecting recruitment, survey respondents identified agency competition, pay, and location as key challenges to retention as well (Figure 14). Forty-five percent of respondents selected agency competition as a key problem in retention, while 38 percent selected pay. Regarding pay and other incentives, one respondent wrote, “Incentives are key and those agencies who can afford them, win.” About a third of respondents selected location as a challenge, and this may be a particular obstacle for rural agencies. For example, one respondent said, “Rural counties seem to be impacted dramatically by the trends of lack of interest and retention.”
Most respondents suggested that agency retention issues have recently been exacerbated by people leaving the policing profession, with one respondent commenting, “People have left for other professions that pay more and have less stress.” Most respondents noted that, historically, lateral hiring and retirement were the most common types of separations from their agency (Technical Appendix Figure B5). When asked how separations had changed in the last five years, law enforcement agencies most often said that resignations have increased (Technical Appendix Figure B6).
Competition from other agencies is the most common retention challenge
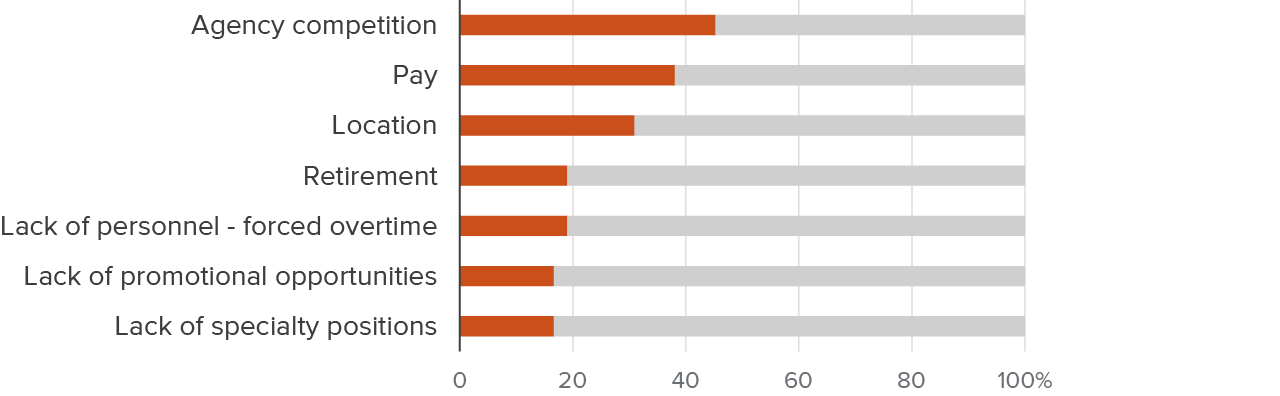
SOURCE: PPIC Law Enforcement Staffing Survey. Survey was fielded from July to August 2025.
NOTES: Survey had 41 agency responses: 19 police departments and 22 sheriff departments. PPIC’s Law Enforcement Staffing survey asks: “What are the top four primary challenges your agency currently faces related to retaining staff?” Other selection options included in the question and not listed (because of low respondent selection) were officer safety, community appreciation and respect, and lack of modern equipment.
Approximately 16 percent of respondents cited a lack of specialty positions as an obstacle to retention, noting that specialized teams or organizational partnerships can help reduce officer workload. Examples of specialized teams might include a mental health team, a substance use team, a SWAT (special weapons and tactics) team, and/or a school resource officer team. Using these specialized groups can help officers focus more on their particular beat and can promote inter-agency collaboration by allowing smaller departments to share specialized officers on larger, more complex cases. Additionally, one respondent noted that the use of these teams helps reduce response time.
However, staffing these special positions does affect patrol positions. Law enforcement leaders highlighted the importance of striking the right balance between staffing patrol officers and specialized teams. In some cases, agencies will pull from these special teams to fill patrol vacancies where needed. Survey respondents were split on whether they have reduced staffing specialized positions because of staffing challenges (Technical Appendix Figure B4).
A Minority of Agencies Reported Shifting Services or Priorities
Staffing constraints affect agencies to varying degrees, though most survey respondents said that no sworn positions have been eliminated due to budget constraints in the last five years. On average, respondents rated their agency as being just below the optimal staffing level. However, a few agencies reported being above their optimal staffing levels, and one agency reported being at only 30 percent of the optimal staffing level. Agencies determined how to estimate optimal staffing levels themselves and chose a few different metrics: population, crime levels, calls for service, case closure rates, number of vacancies, and/or available time.
While 70 percent of respondents reported not reducing services and/or changing response priorities to cope with limited staff capacity, 30 percent noted making changes in these areas. Online reporting—which allows civilians to make police reports online for non-emergency crimes, as opposed to requiring an officer to take the report at the location—has helped some departments reduce services to non-emergency incidents. Other changes include not responding to non-criminal medical calls and/or using a mobile crisis team of community responders to address calls for services related to behavioral health.
In addition, several agencies said that they used mandatory overtime to cope with staffing challenges. Most survey respondents said that overtime usage had increased relative to five years ago, a finding that bears out in the data (Technical Appendix Figure A10; Technical Appendix Figure B7).
Agencies Emphasized Outreach and Retention Strategies
Agencies reported implementing various strategies targeted at increasing recruitment and retention, including changes to community outreach, the hiring process, employee policies, employee benefits, and department culture.
Changes to outreach methods were the most common type of intervention cited by survey respondents. Strategies included hiring an officer or team to focus on recruitment and increasing advertising at hiring fairs and on social media. Agencies also reported making changes to the hiring process, such as shortening the interview timeline, offering online applications, and providing hiring bonuses. Fifty-eight percent of respondents reported that they have offered hiring incentives to new hires, with a majority of these agencies saying these incentives were effective in increasing the number of new hires.
In efforts to improve retention, several agencies changed employee policies, such as reducing tattoo and grooming restrictions. Most agencies also improved benefits for current officers, including allowing wellness time (e.g., exercise) during shifts and increasing financial and education benefits.
A few agencies cited that they focus on culture as a key tool in recruiting and retaining officers. One respondent said, “Culture beats strategy every time. You can have the best mission statement, vision and strategy, pay, and benefits. However, if the organization has a poor culture, then there is no amount of money or recruitment strategy that will solve the problem…. Look at some agencies who are not struggling with staffing issues… and you will find culture is a[n] extremely effective recruiting tool.” Similarly, another respondent noted, “We build a very strong culture, and retention takes care of itself.” Survey respondents did not identify what they meant by culture. Agencies also expressed a desire for more funding in the future to support hiring and retention efforts.
Agencies Offer Mixed Responses on Effects of Policy Reforms
In the final section of the survey, we asked respondents about the impacts of recent policies on policing within their agency. These policies include the Racial Identify and Profiling Act (RIPA), Senate Bill 1421, the PEACE Act, Senate Bill 2, and the Grants Pass Supreme Court decision on homeless encampments (see text box).
Our respondents provided a range of answers. Approximately half of respondents said that RIPA has increased the administrative burden on officers. Most respondents reported that Senate Bill 1421 and Senate Bill 2 had no or minimal effect on policing in their jurisdiction, and most stated that the PEACE Act had no apparent impact on officer hiring, which aligns with the research evidence (McConville and Premkumar 2022). Policies such as the Grants Pass Supreme Court decision on homeless encampments yielded mixed views; most respondents said this policy has had no effect, though a few reported that this policy has provided them with more effective tools to navigate these calls.
Conclusion
Law enforcement is a major responsibility of state, county, and city governments, which employ officers to serve their communities by strengthening public and traffic safety. It is also expensive, particularly at the local level; policing is the largest category of city spending on average. In the 2023–24 fiscal year, state and local governments spent about $28 billion on policing services, with over 95 percent of funding going toward salaries and benefits for sworn officers, who number nearly 80,000 statewide. While there are trade-offs to consider when it comes to investing in more officers, research has shown the vital role they play in deterring crime (Chalfin et al. 2022).
Officer staffing has changed over time. Staffing levels rose through the late 1990s and early 2000s, reaching a recent peak in 2008. The Great Recession led to a dramatic decline in staffing across sheriff’s and police departments, rural and non-rural agencies, and agencies of all sizes. While numbers began to rebound slightly in 2014, staffing declined again in 2021 and 2022 after the pandemic, especially among larger agencies with at least 100 officers. Although statewide staffing levels rose in 2023 and 2024, they have still not fully rebounded to pre-pandemic levels. Overall, officer staffing has risen more in sheriff’s departments compared to police departments in the last two decades, potentially because of changes in demand and funding after public safety realignment in 2011, which shifted some correctional responsibilities from the state to the counties.
Although examining the causal factors driving these trends is outside the scope of this report, we explore possible factors that may have played a role. In recent years, we see a dramatic increase in separations (i.e., resignations, retirements, or terminations): from 2020 to 2022, separations went up by more than 30 percent in California. This spike coincided with a temporary but notable dip in new hiring. Two potential contributing factors may have been the pandemic and protests following the murder of George Floyd (Adams, Mourtgos, and Nix 2023; Premkumar et al. 2023; Grunwald 2024). Since 2021, new hiring has rebounded to pre-pandemic levels.
After adjusting for inflation, average officer salaries have declined slightly since 2011, which may be due to more experienced officers leaving. Meanwhile, overtime pay has increased considerably, especially at non-rural agencies. Most likely, this finding reflects agencies relying on overtime to fill staffing gaps. Although overtime pay increases officers’ overall salary, department policies demanding overtime for officers could lead to low morale and eventual exits. In addition, research has also shown that fatigued officers may not be able to perform as effectively as those who are well rested (Ferrazares 2026).
Our survey findings provide new insights into the recruitment and retention challenges agencies are experiencing. When hiring new officers, respondents shared that finding high-quality candidates has become more difficult, with one agency stating they may not realize a new officer is not fully qualified until the field training stage. Additionally, respondents listed agency competition and pay as top concerns. About 30 percent of respondents indicated that limited staff capacity has led to shifts in services or response priorities, such as deprioritizing non-criminal medical calls. Respondents also noted undertaking strategies to improve recruitment and retention, such as increasing outreach, offering hiring incentives, and enhancing benefits for current officers. Respondents believe additional resources are necessary to address the challenges they have recruiting and retaining officers. It is important to note that these survey findings are more representative of smaller agencies and sheriff’s departments, as we received limited responses from police departments, particularly the largest police departments.
With the substantial number of officers employed across the state and significant funds going toward law enforcement, monitoring and understanding trends in officer staffing is crucial. We hope the insights from this report guide state and local policymakers and practitioners as they work to understand staffing challenges and find ways to address them. Looking forward, policymakers may need to consider variation across agency types when thinking about possible policy changes to address staffing challenges. Our research indicates that different kinds of agencies have experienced varying trends in staffing, and a single reform may not work effectively across the board. In addition, policymakers and criminal justice leaders will need to find successful ways to hire and retain officers even amid uncertain fiscal times in the coming years. A first step could be improving cross-agency communication and collaboration to better share strategies that are currently working, such as those highlighted in our survey of law enforcement agencies.
Topics
Criminal JusticeLearn More

Police Agencies Face Obstacles with Hiring and Retention
Understanding Trends in Law Enforcement Staffing

Law Enforcement Staffing in California

California’s Notable Declines in Law Enforcement Staffing
