

Table of Contents
- Key Takeaways
- Introduction
- The English Learner Population
- Trajectories for English Learners
- The Changing EL Population
- The Evolution of Reclassification
- EL Programs, Staffing, and Services
- Conclusion and Recommendations
- Notes and References
- Authors and Acknowledgments
- PPIC Board of Directors
- Copyright
Key Takeaways
Nearly 20 percent of California school children are English Learners (ELs), and close to 40 percent of all TK–12 students speak a language other than English at home. In this report, we ask how the size and composition of the EL population has changed and whether services, program offerings, and learning trajectories have evolved in response to these changes. We take stock of English Learners and their trajectories to examine the implications of these changes.
Our key findings:
- The mix of EL students is changing but still dominated by US-born Spanish speakers. Over 80 percent of ELs speak Spanish; other top languages are Mandarin, Cantonese, Vietnamese, and Arabic (each 2% or less of the total). The number of new immigrants has increased modestly, especially from Central American countries such as Guatemala and El Salvador. →
- Declines in the multilingual population have been steep. While enrollment for English-only students has returned to pre-pandemic levels, enrollment for English Learners continues to decline and is now 15 percent lower than in 2015. →
- The share of English Learners reclassified as proficient still lags. Although statewide reclassification rates rebounded after the pandemic, nearly all grade levels, aside from 1st grade, have much lower shares of reclassified students. On the bright side, reclassification by 1st grade is now at its highest level. →
- Almost a third of families do not have translation services at their schools. Well over 90 percent of Arabic, Hmong, and Filipino speakers are linguistically isolated—without support in their language, but this is also true for nearly a quarter of Spanish speakers, the most common language spoken by K–12 families. →
Despite declining enrollment, districts still aim to meet the state’s biliteracy goals by expanding programs to help English-only and EL students gain fluency in a second language. Still, districts face shortages in bilingual staffing and some need to offer additional training or hire non-credentialed teachers.
Several policies are on track to address challenges in identifying and tracking English Learners. In 2025–26 districts will begin administering a new reading difficulty screener in K–2 that will identify younger students who need extra reading support. For older children, the California School Dashboard is beginning to monitor long-term English Learners to help districts track their numbers and progress.
Introduction
More than a quarter of California’s youngest children arrive in public schools not yet fluent in English (reading, writing, listening, and speaking). Federal law requires that these children receive supportive services so they can access academic content while becoming fluent in English. Over time, most children who receive supportive language services in California’s schools become proficient in academic English and succeed in K–12 and beyond. However, for those who do not advance quickly, the transition out of supportive services appears to be slow or never happens. These children have some of the poorest outcomes in the state and receive a great deal of focus from educators and policymakers.
At the same time, educators and policymakers are increasingly interested in helping maintain fluency in a child’s home language because of the benefits for future academic and employment outcomes (Porter, Vazquez, and Umansky 2023). Further, children who speak only English benefit from becoming fluent in an additional language.
Recent developments in California present new challenges to keeping English Learners (ELs) on track to be reclassified as English proficient at a reasonable pace and in meeting the goals of the state’s Global California initiative (see text box). First, California’s population of current and former English Learner students is no longer growing and is increasingly diverse, which may require districts to adjust their bilingual program offerings. Second, remote instruction during the pandemic challenged the system’s ability to identify new students who needed English learning instruction or current English Learners who no longer needed services. The pandemic also made it difficult to provide instructional services, leading students to remain classified as English Learners longer than in the past.
This leads us to address the following questions:
- How has the size and composition of the English Learner population changed over the last decade?
- How has the reclassification of English Learners evolved?
- What are the implications of these enrollment changes on services, program offerings, learning trajectories for English Learners?
We used publicly available data from the California Department of Education (CDE) to describe key demographic characteristics of English Learners, how the EL population has changed, and recent changes in identification and reclassification. In addition, we conducted nine interviews with school district staff from a diverse set of districts to understand whether and how they are adapting programming and services as well as how they may be addressing changes in the size and characteristics English Learner students. We conclude with recommendations to policymakers, districts, and other educational stakeholders.
The English Learner Population
Roughly 1 million students are currently English Learners and over 900,000 are former English Learners (also referred to as reclassified students). Together, these ever-EL students constitute just over one-third of the total enrollment in California public schools.
Among current English Learners, over 100 language groups are represented, but 81 percent of these students speak Spanish. Other top language groups include Mandarin (approximately 22,000 students or 2.1% of ELs), Vietnamese (20,000 or 1.9%), Arabic (15,000 or 1.4%), Russian (14,000 or 1.3%), Persian (12,000 or 1.1%), and Cantonese (12,000 or 1.1%). No other language is spoken by more than 1 percent of ELs. The top languages have shifted somewhat over time, but Spanish has been the dominant language among ELs for decades (Hill 2018). Filipino used to be somewhat more predominant, while Persian and Russian are new additions to the top language groups.
Most school districts have a relatively high proportion of Spanish-speaking students, but other language groups may be more concentrated by region. In districts with over 100 students, over 85 percent of children speak Spanish at home (Figure 1). And in some districts, children who speak a non-English and non-Spanish language at home are relatively isolated. For example, Russian, which is the fifth-most-commonly spoken language among ELs, is spoken in many districts across the state (Technical Appendix Figure B1), but doesn’t exceed 13 percent in any district. Further, Russian-speaking families are concentrated in districts in the Bay Area, Sacramento, Central Valley, and Southern California.
Share of district students who speak Spanish, 2023–24
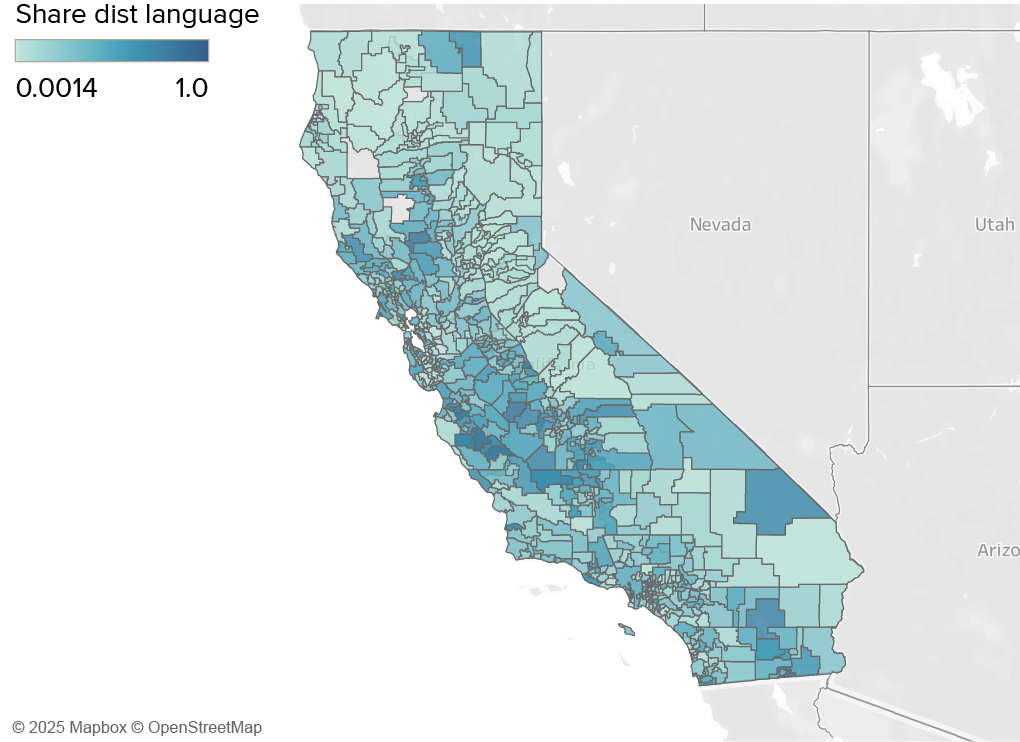

SOURCES: California Department of Education, English Learners by Grade & Language 2023; Fluent English Proficient Students by Grade & Language 2023; Census Day Enrollment Data 2023.
NOTE: Spanish-speaking students include those who are classified as English Learners or Fluent English Proficient (whether they are Initially FEP or Reclassified FEP). Map depicts all districts, including those with less than 100 students. The largest share of district students who speak Spanish is 100% in Jefferson Elementary with only 4 students. The next largest is Calexico Unified, with about 87% of the district’s total 8,022 students.
Most ELs are born in the United States and begin receiving services when they enter kindergarten (or transitional kindergarten for those who are age-eligible). Some students move from abroad at older ages (often termed “newcomers”) and could include unaccompanied minors, asylees, refugees, undocumented youth, and migratory students (CDE 2025).
In 2023–24, California schools had about 190,000 immigrant students (ages 3–21, not born in the US, and have been attending US schools for less than three years), up from 165,000 immigrant students in the previous year. While public data on newcomers is limited, the districts that we spoke to mention that most newcomers arrive at the secondary level. Most newcomers are from Mexico, but there has been a recent influx of newcomers from Central American countries such as Guatemala and El Salvador, and in some districts Yemen and French-speaking Africa.
Trajectories for English Learners
Every student is screened for the possibility of needing EL services when they start school (Figure 2). After students are identified as ELs, districts are meant to provide appropriate English Language Development services. While programs today are largely English immersion courses, districts are slowly shifting toward dual-language immersion programs.
Schools Identify English Learners Soon after Enrollment
When parents enroll their children, they are asked to fill out the Home Language Survey, which asks a series of questions to ascertain whether the child speaks primarily English at home. If not, the child will then take the Initial English Language Proficiency Assessments for California (ELPAC) if in grades K–12. Scores on the ELPAC determine whether the child qualifies for English Learner services or is instead classified as Initially Fully English Proficient (Figure 2).
These determinations are meant to be completed within 30 days of enrollment. During the 2020–21 school year, however, many students were not identified into any language group status because so many children were learning remotely—15 percent were classified as “To be Determined” by the end of the school year compared to only 0.7 percent from the year prior.
Schools begin the process of identifying English Learners when students are enrolled

NOTE: School entry can happen at any age, but in practice, most children are screened in kindergarten. Younger children identified as English Learners are often referred to as Dual Language Learners, to acknowledge that young children are gaining fluency/literacy in their home language as well as English. Students who enter the K–12 system in 8th grade or later would never become LTELs, completing their schooling as either ELs or RFEP students.
Districts have some concerns about the process of identifying English Learners
In our conversations with districts, a few mentioned some concerns about the Home Language Survey and English Learner identification. More than one district indicated that some parents were unaware that a family’s survey responses would determine whether their child would ultimately need EL instruction. Some parents felt adamant that despite speaking more than one language at home, their children primarily spoke English at home and therefore should not need any EL services:
“Some [parents] have shared with me that they filled out English and Spanish [on the survey] because their child is exposed to two languages at home. But to this day now they don’t have any mastery of the Spanish, so they feel their children are being given a disservice … because they have to … participate in designated ELD, [and] then that child doesn’t have the opportunity to engage in other activities… So personally I do believe that we [need] to have a conversation about the survey.”
Parents may be concerned about sharing immigration status
We also learned some parents intentionally fill out the survey to indicate that English was their home language even though their families spoke another home language to avoid having their child classified as an EL given the immigration climate.
“[We] have found over the years that many of our parents on their home language survey are marking English even though they may not even speak English just yet. And I foresee next year when we have our parents enroll their kindergartners for next year, we’re going to see less numbers as potential ELs because their parents are … in this political arena where [they’re] making sure their children are not labeled as English Learners.”
This approach poses problems for districts around providing the services these children require to develop proficiency in academic English. If children are not correctly identified, it may hinder districts’ abilities to provide dual language immersion programs and help students achieve biliteracy.
Another district has been tracking chronic absenteeism among their EL students. Over the past two years, they had managed to reduce absenteeism among the EL population but noted a marked increase since the 2024 November election.
“[There are] parents who have immigration status concerns […] And so some of those students we know have been affected, and even some that might be legal. But not knowing really all the information, they themselves weren’t coming to school.”
This district has been training their staff about how to support these students and families, and explaining the purpose and benefits of EL instruction to parents through designated parent committees or family resource centers.
Students Move through Different Stages of EL Status
To track how the same group of ELs fare over time, we would need longitudinal data; however, a snapshot of all students who were ever English Learners in 2023–24 by grade level (Figure 3) can also provide a sense of the typical flow into and out of English Learner status.
- At the kindergarten/TK level, nearly all of the nearly 140,000 English Learners have been ELs for zero to three years, and very few have been reclassified.
- Among the ever-ELs in 1st grade, roughly 7 percent were Reclassified Fluent English Proficient (RFEP).
- Among ever-ELs in high school, large shares—from 65 to 73 percent—were RFEP students.
Looking more closely at different grades, we see that in the 4th grade, 11 percent of EL students were new entrants who had been ELs for between zero and three years, meaning they arrived from abroad or other states in 1st grade or later. These new entrants were a steady but small presence in each grade.
A small percentage of current 5th grade ever-EL students (i.e., current and former EL students) met the basic criteria for being termed long-term ELs (LTELs, in EL status for at least six years). Long-term ELs were nearly half (42%) of all 6th graders; this was the peak grade level for long-term EL status because ELs who entered in kindergarten had now been in school long enough to be long-term ELs.
Even in 12th grade, however, about 20 percent of students were still long-term ELs. According to a report by the Learning Policy Institute, only 16 percent of 12th grade long-term ELs began schooling in kindergarten (Price et al. 2024). This suggests that a larger share of long-term ELs may come from newcomers who arrive later in the K–12 system but remain English Learners for more than six years.
While long-term EL status can lead to poor outcomes, former ELs tend to have strong outcomes
It is important for policymakers to consider how to best address the needs of long-term English Learners. As we discuss later, long-term English Learners are more likely to be from low-income households and to have a disability compared to non-long-term ELs. Moreover, students still in EL status at the end of their high school career are among those least likely to graduate (Price et al. 2024), and if they do graduate, are less likely to be prepared for college, as measured by having completed A–G requirements (courses required for admission to the University of California or California State University systems), completed any college credits, or earned AP credits (Buenrostro 2024).
However, former EL (or reclassified) students are among the most successful of California’s students in terms of test scores, graduating, and completing A–G requirements (Buenrostro 2024; Betts et al. 2019; Hill, Hayes, and Weston 2014). Reclassification is a crucial component in the trajectories for English Learners because it indicates when students have demonstrated sufficient language proficiency to follow the academic curriculum without support (see text box for more details). Students who are reclassified are more likely than current English Learners to have earned the State Seal of Biliteracy. Policy working on both ends—encouraging on-time reclassification and supporting students at risk of becoming long-term ELs—is essential to ensuring English Learners’ academic success.
English Learners begin reclassifying in 1st grade

SOURCE: CDE Enrollment by English Language Acquisition Status, Long-Term English Learner, and At-Risk, by Grade, 2023–24.
NOTES: First bar includes enrollment counts for both kindergarten and TK, which helps explain why the count is about 30,000 more students than in 1st grade. At-Risk English Learners have the highest shares in the 3rd–5th grade since this is typically four to five years after initially being classified as an English Learner. A small share of students are already identified as At-Risk (EL 4–5 years) as early as 2nd grade and LTEL (EL 6+ years) as early as 4th grade since some English Learners could have been initially classified when in TK or early transitional kindergarten, offered in some districts throughout the state.
Most Programs Are English Immersion but Dual Language Immersion Is Growing
After students are identified as English Learners, the EL Road Map should guide the English Language Development services students should receive through their district. A variety of language acquisition programs can provide English Learner Development (ELD) services. The majority of English Learners receive their English instruction through Structured English Immersion (SEI) where the school places them in traditional courses with non-EL peers so that students receive integrated and designated ELD instruction that scaffolds learning.
After a fraught history with bilingual education in the state, California ELs are increasingly participating in bilingual programs, such as dual language immersion or Transitional Bilingual or Early-Exit Bilingual Education, and in newcomer programs.
In 1997, California passed Proposition 227, which banned bilingual teaching in schools and required English Learners to learn only in English immersion classes. This law was overturned by Proposition 58, which implemented the California Multilingual Education Act of 2016.
In the 2022–23 school year, 1,281 schools in California—roughly 13 percent of all schools—offered at least one language immersion program, as reported by the CDE. The most popular form of bilingual instruction is the dual-language immersion program (DLI), which typically comprises half English native speakers and half speakers in the other language. Given this requirement, many languages will never have enough students to offer DLI—Spanish is the most common language for DLI programs. The aim of these programs is to foster proficiency in English among ELs as well as develop bilingualism in both languages for all students, thereby supporting the state’s biliteracy goals. However, almost 20 years of an emphasis on English-only instruction has now left California lagging states such as Texas, Wisconsin, and Alaska as well as Washington DC, in the share of English Learners who are enrolled in bilingual education (Williams and Zabala 2023). Furthermore, despite the similarities in EL population size between Texas and California, Texas enrolled 38 percent of English Learners in any bilingual education programs, which is more than twice the percentage (18%) that California does, according to a report by The Century Foundation (Williams 2025).
Other forms of bilingual instruction include transitional bilingual programs, which uses both English and students’ home language in academic instruction to help English Learners transition to “English only” instruction by third grade. Similarly, developmental bilingual programs keep instruction in both languages through 8th grade, with the goal to obtain proficiency in both languages. One-way immersion courses are like dual-immersion class instruction but include only English Learners rather than a mix of language learners.
Newcomer programs serve relatively few students, but these grew 12 percent between 2019–20 and 2022–23. Data from the 2023–24 school year suggests a recent increase in the number of newcomers. Regardless of the language acquisition program, students participate in English Learner Development instruction until they demonstrate English proficiency.
The Changing EL Population
Overall public school enrollment in California has been declining steadily over the last decade. Up until 2016, statewide enrollment hovered around 6.2 million students. In 2023, enrollment stood at 5.8 million students.
The drop in multilingual students has largely driven this enrollment decline. The falling numbers for multilingual students are due to lower birth rates, especially among Latina women, and to changes in migration, including lower international migration to California and higher migration away from California to other states (Johnson, Cuellar Mejia, and McGhee 2025). The COVID-19 pandemic then further exacerbated declines, especially among English Learners.
Counts of ever-English Learners—that is, current and former EL students—have plummeted since 2015–16, falling about 15 percent (or 372,000 fewer) by 2023 (Figure 4). In contrast, the English-only population of students has been holding steady: while this group declined in 2020–21 and in 2021–22, it bounced back a bit starting in 2022–23. English-only enrollment is about 8,000 students lower in 2023–24 than it was in 2015–16. The declines in the ever-EL population explain 96 percent of California’s K–12 enrollment decline since 2015–16 and 87 percent since 2019–20 (Figure 4).
Drops in ever-EL enrollment have driven overall enrollment declines in California since 2015–16

SOURCE: CDE Enrollment by English Language Acquisition Status, Long-Term English Learner, and At-Risk, by Grade, 2015–16 to 2023–24.
NOTES: Percentages represent percent change in enrollment since 2015–16. Ever EL includes current English Learners and Reclassified Fluent English Proficient students.
The Drop in EL Population Varies across Districts
The declines in ever-EL enrollments have not been uniform across the state; some districts have enrolled greater numbers of EL students over the last few years.
In eight of the ten largest school districts, numbers fell; only in Elk Grove and San Juan Unified—both in Sacramento County—did numbers grow. Ever-EL declines were most dramatic in large coastal districts like Los Angeles (-27%), San Diego (-26%), Long Beach Unified (-38%), and San Francisco (-15%) and most other Bay Area districts (Figure 5). When weighting for district enrollment, it is clear that the majority of the state is experiencing ever-EL declines.
In total, ever-EL enrollment grew in about one-third of all districts (337) since 2015—mainly in the Central Valley, Northern, and Sierra Foothill communities; only a few coastal districts showed increases.
Districts with shrinking current and former English Learners dominate the state
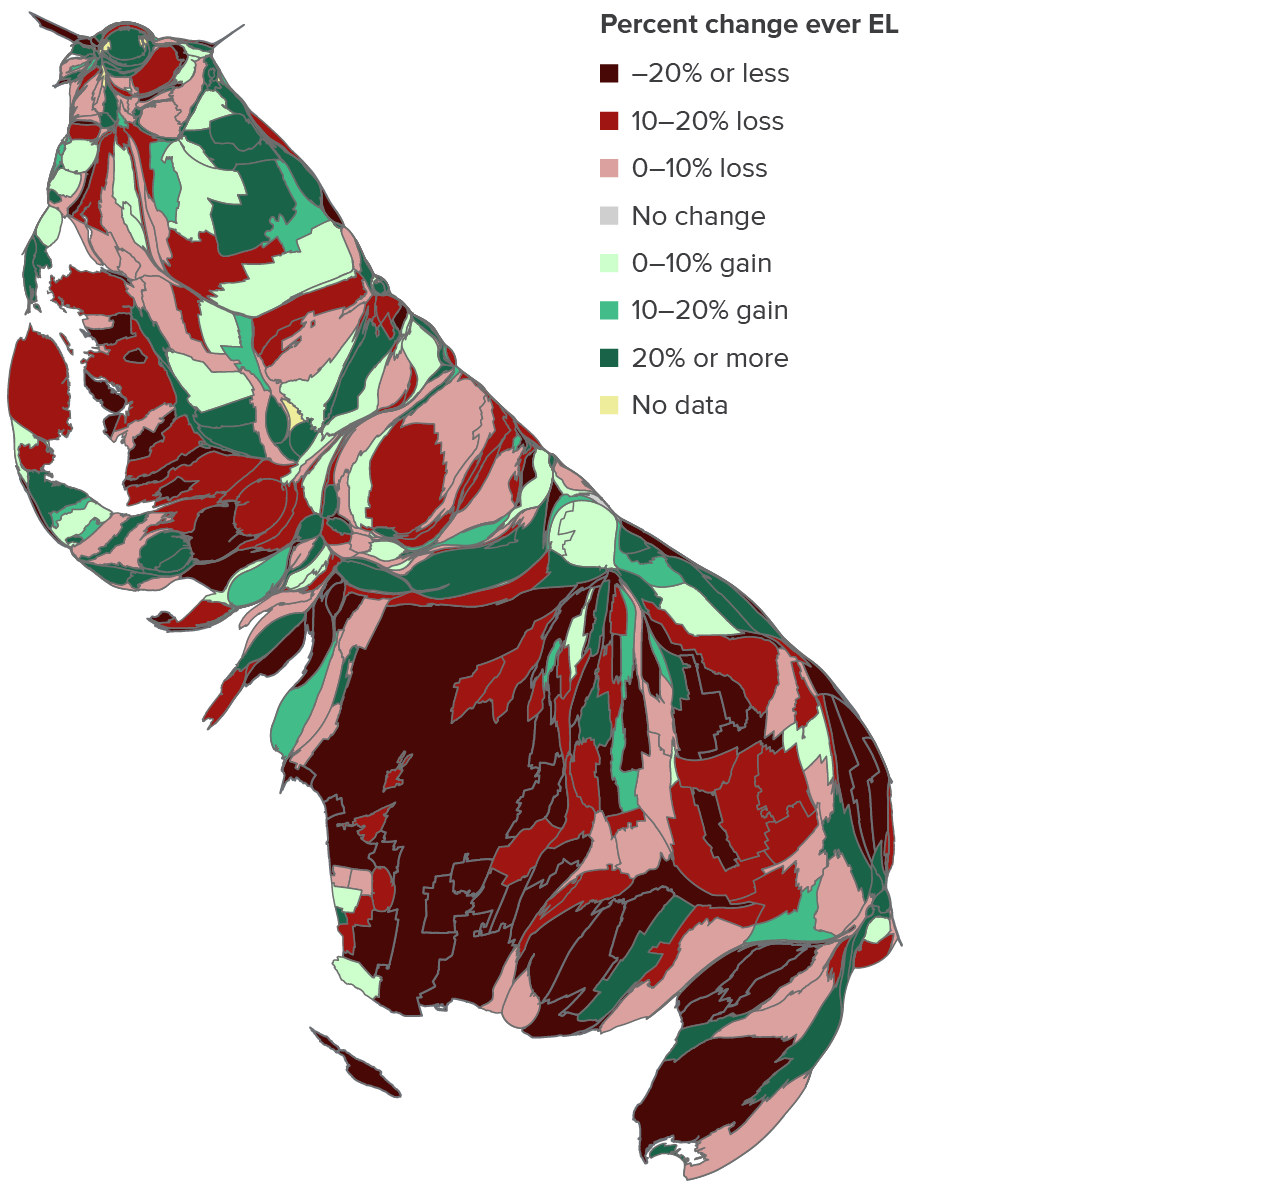
SOURCE: CDE Enrollment by English Language Acquisition Status, Long-Term English Learner, and At-Risk, by Grade, 2015–16 to 2023–24.
NOTE: Map depicts district-level percent changes in ever-ELs from 2015 to 2023. Ever-ELs are current and former (reclassified) English Learner students. Districts labelled as “No data” did not have data from either 2015 or 2023 to calculate percent change. School districts’ size is weighted by 2023 district enrollment.
In about 64 percent of school districts, the population of ever-EL students declined (Technical Appendix Figure B3). Among districts with declines, ever-EL enrollment has fallen on average by around 20 percent since 2015. Of the districts that grew their English Learner population, ever-EL counts have increased on average by about 40 percent since 2015.
Generally, districts that had declines or increases in ever-EL enrollment had similar drops or growth in overall enrollment. However, a handful of districts had declines in their ever-EL population but growth in overall enrollment (about 12%), and vice versa (Technical Appendix Table B2).
Table 1 highlights the variation in enrollment changes across districts, from those with the biggest decline (-65%) to those with the largest growth (795%) (see Technical Appendix Table B3 for complete table). Among the top five districts with the biggest drops in ever-ELs, the EL decline accounted for almost half or more of the total district enrollment decline. For instance, at Waugh Elementary in Sonoma County, 76 percent of the overall district decline appears to be due to the decline in ever-ELs.
Top five districts with the largest percentage of ever-EL growth or declines since 2015


SOURCE: CDE Enrollment by English Language Acquisition Status, Long-Term English Learner, and At-Risk, by Grade, 2015–16 to 2023–24.
NOTES: Top 10 districts with largest growth/declines are of districts that had at least 100 ever-EL students in 2015.
We spoke to some districts where enrollment increased over the past several years. Several pointed to eastward migration to more inland areas of California due to higher costs of living in larger, urban counties.
Projections suggest that overall enrollment will continue growing slightly in the Sierra and Northern Central Valley regions through 2032. However, all other regions in California are expected to see further enrollment declines within the next decade, even in areas that have grown over the past decade, such as the Sacramento metro region and the San Joaquin Valley (Lafortune and Prunty 2023).
The Demographics of English Learners Have Changed
We spoke to school districts across the state, most with decreasing population, but some with increasing populations. Many reported that the demographics of their EL students are changing. The director of curriculum and instruction at one district noted fewer reclassified English Learners as families moved to different areas within the county due to job market changes. At another district, the assistant superintendent in charge of English Learner planning and instruction reported growing numbers of long-term English Learners.
The newcomer population has also changed in many districts. While the overall number of newcomers in the state is not changing much, these students are often concentrated in a few districts. Several districts indicated a rise in newcomers from Mexico, including children who speak indigenous languages and are not fluent Spanish-speakers. One district even had growth in their ever-EL population due to a greater influx of dual-citizen children residing in Mexico who cross the border daily to be schooled in the United States. Overall and ever-EL population fell in another district while the numbers rose for newcomers from Venezuela and Central American countries such as Guatemala and El Salvador.
Many districts mention that newcomers often arrive at the secondary level, either in middle school or high school. Some children are arriving with substantial interruptions to their schooling. One district reported some newcomer students have attended school only in refugee camps prior to arriving in the US and had very limited school experience … “This kid has trouble holding his pencil, or he only can write his name.” A district teacher on special assignment described the newcomer landscape:
“We’re getting a lot more students with interrupted formal education … boys mostly, who, for whatever reason, they may have gone to 1st and 2nd grade. Then they skip a few grades, then they may have gone to 5th. Then they skip a few [more]. They have really low literacy in their home language. They have very underdeveloped academic skills. So that’s been a huge adjustment to try to figure out.”
These changes in the EL population have led some districts to shift EL instruction towards newcomer programming and away from their typical, traditional models geared towards US-born English Learners, who are mostly long-term ELs in high school. Newcomers benefit from specialized instruction, especially during their first year, which may include intensive English language and literacy development, cultural transitioning to the United States and the school system, and extended learning opportunities such as after-school programs (Finn 2023). One district attempted to place high school newcomers in bilingual classrooms when newcomer options were not available. In a later section, we discuss the challenges some districts face in educating the mix of newcomer, long-term English Learners, and reclassified students in their bilingual programs.
The Evolution of Reclassification
Reclassification is a key milestone in the academic trajectory for English Learners. Deciding when an English Learner becomes reclassified is based on four standard criteria (see text box), but districts can establish their own locally approved policies and practices. These policies and practices can impact whether the timing of reclassification is ideal—that is, the moment when students can succeed in the full curriculum without EL supports and just as they stop making progress with those EL supports (Betts et al. 2019; Robinson-Cimpian and Thompson 2016).
The pandemic school closures, periods of remote instruction, and increased absenteeism made it difficult to adhere to standard practices, leading to delays in reclassification. We examine reclassification data from the California Department of Education (CDE) and discuss reclassification from the perspective of the districts we interviewed. It is clear that many districts are still struggling to catch their EL students up to pre-pandemic levels, and they aspire to do more.
Reclassification Rates Fell Sharply during the Pandemic
California’s annual reclassification rate hovered around 13 to 14 percent in the years leading up to the pandemic; it sank to 7 percent in 2020 (Figure 6). Since then, statewide reclassification rates have not been reported by the CDE, making it difficult to understand any post-COVID trends.
We estimate the rates after 2020 using available enrollment counts data for English Learners (see Technical Appendix B for details). The overall reclassification rate remained low in 2021 (6%); it began increasing again in 2022 and reached pre-pandemic levels in 2023.
Statewide reclassification dropped sharply during the pandemic
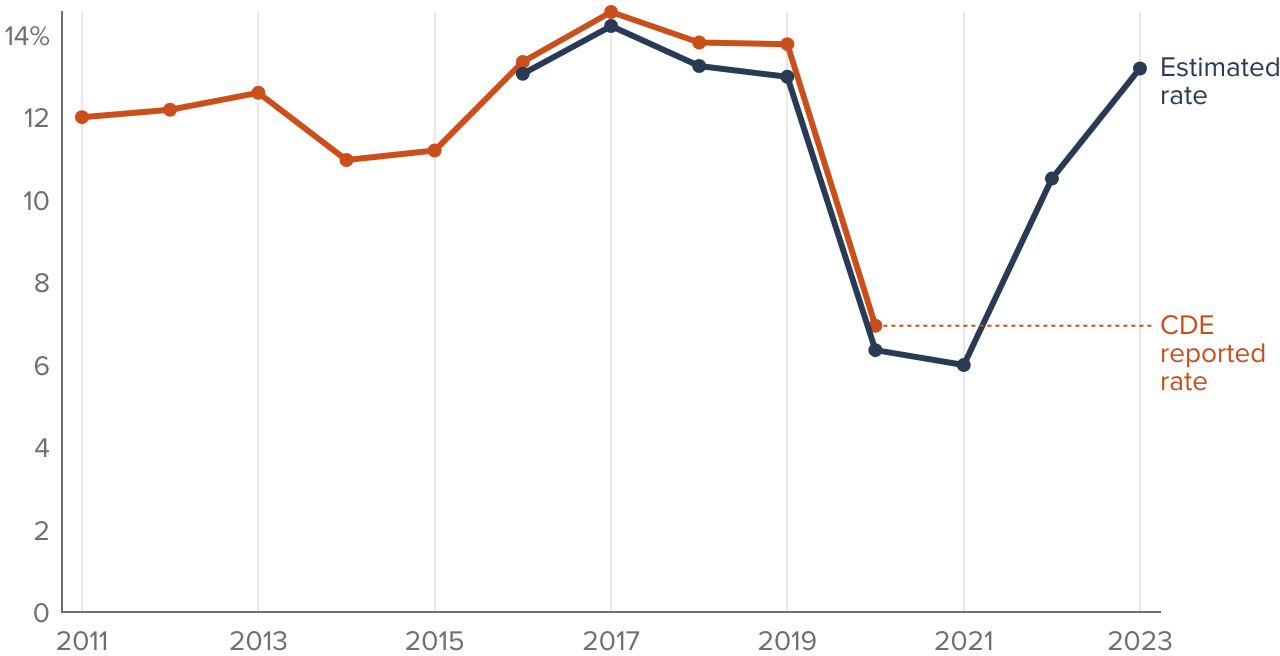
SOURCE: CDE Enrollment by English Language Acquisition Status, Long-Term English Learner, and At-Risk, by Grade, 2015–16 to 2023–24
NOTES: See Technical Appendix B for our full methodology for calculating reclassification rates. Since 2015 is the first year we have reclassified counts by grade, we calculate only from 2016 onwards. Our method cannot account for students moving away from the state nor entering the state between grades.
Reclassification rates generally increase by grade until 6th grade as more students reach the proficiency level to become reclassified. At older grades, reclassification rates might plateau and even fall, since English Learners who have not been reclassified after six years become less likely to ever be reclassified (Thompson 2015).
We find a similar pattern when we examine these reclassification trends by cohort and grade level over time with pre-pandemic kindergarten cohorts from 2015–2018 (Figure 7). Starting with the 2015 kindergarten cohort, reclassification rates increased by grade through 2019–20, when these students were in 4th grade. Then in 2020–21, reclassification rates plummeted and remained low in 2021–22. This pattern repeats for each cohort, with lower than usual reclassification rates for each grade during the period of remote instruction.
During this period, districts faced challenges in administering key assessments required for reclassification. First, despite offering the English Language Proficiency Assessments for California (ELPAC) in an online format, remote administration delayed the identification process for many English Learner students. In the 2020–21 school year, 15 percent of kindergarteners were instead classified as “To be Determined” compared to only 0.7 percent from the year before. Second, other assessments such as the Smarter Balanced Assessment Consortium (SBAC) were discontinued, removing an important criterion that many districts used to determine reclassification. Along with these disruptions, districts were likely prioritizing instruction rather than testing, so the reclassification dip is not a surprise.
Among pre-pandemic kindergarten cohorts, reclassification rates fell in all grades during remote instruction

SOURCE: CDE Enrollment by English Language Acquisition Status, Long-Term English Learner, and At-Risk, by Grade, 2015–16 to 2023–24
NOTES: See Technical Appendix B for our full methodology for calculating reclassification rates and developing synthetic kindergarten cohorts. Each dot on a given line represents the reclassification rate of the previous year’s grade level in the cohort before the start of the current grade level. For instance, the second dot on the blue line corresponds to the reclassification rate of 1st graders prior to the start of 2nd grade in 2017. Since 2015 is the earliest year in the data, our cohort analysis can only observe students up to 8th grade.
As one district put it:
“There were such heavy lifts for educators, switching everything to online learning… Then, of course, managing your own life in that pandemic space. I think [reclassification] was one of those things educators just pushed to the side. It was not the highest priority at the time… when people came back, there was … a distraction factor as well— you just didn’t make the time to be classified. That was a perfect place for people to just say, I just can’t do it. It’s too much.”
And another:
“During COVID … to be honest, even our numbers showed that we didn’t really reclassify students. That wasn’t even part of the equation. … Children and parents and teachers [were] all going through all of it; [It was] ‘Can we get them online? Can we teach them something? Can we provide anything for them?’ Once we returned … we made it a push to make sure that we reclassified as many students as qualified.”
Moreover, once schools reopened for in-person instruction, chronic absenteeism rates for EL students remained high (23% vs. 20% for all students (Guinan and Hill 2025), which continued to make reclassification challenging.
These declines in reclassification rates flattened cumulative growth in reclassification for the 2015–2018 cohorts (Figure 8). Because of this slowdown, only about 60 percent of the initial 2015 kindergarten cohort had been reclassified by the start of 8th grade in 2021. The 2019 pandemic cohort also experienced slow initial cumulative growth. Comparing the 2015 and 2019 kindergarten cohorts, only about 20 percent of the 2019 cohort was reclassified by the start of 4th grade relative to almost 40 percent in the 2015 cohort.
Cumulative growth in reclassification of English Learners slowed due to the pandemic
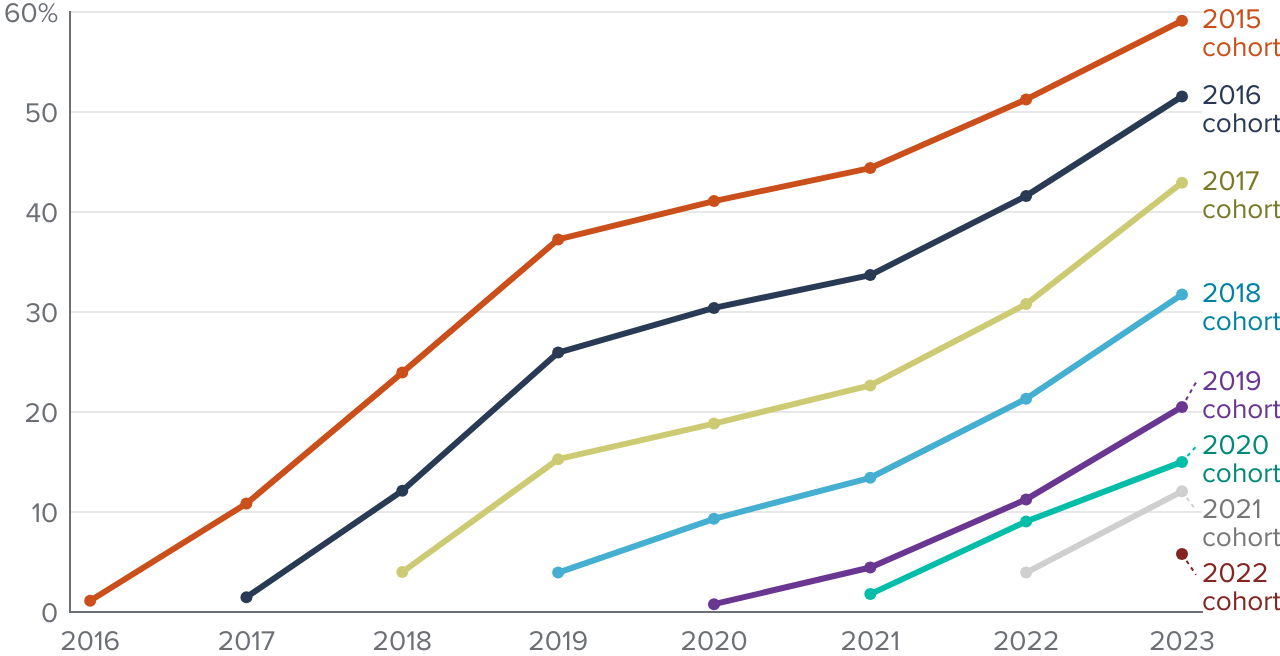
SOURCE: CDE Enrollment by English Language Acquisition Status, Long-Term English Learner, and At-Risk, by Grade, 2015–16 to 2023–24
NOTES: See Technical Appendix B for our full methodology for calculating reclassification rates and developing synthetic kindergarten cohorts. Each dot on a given line represents the cumulative reclassification rate of the initial kindergarten cohort before the start of the current grade level. For instance, the fourth dot on the blue line represents the cumulative reclassification of the 2015 kindergarten cohort by the start of 4th grade in 2019. Since 2015 is the earliest year in the data, our cohort analysis can only observe students up to 8th grade.
Pandemic Effects Linger but Reclassification Is Rising in Very Early Grades
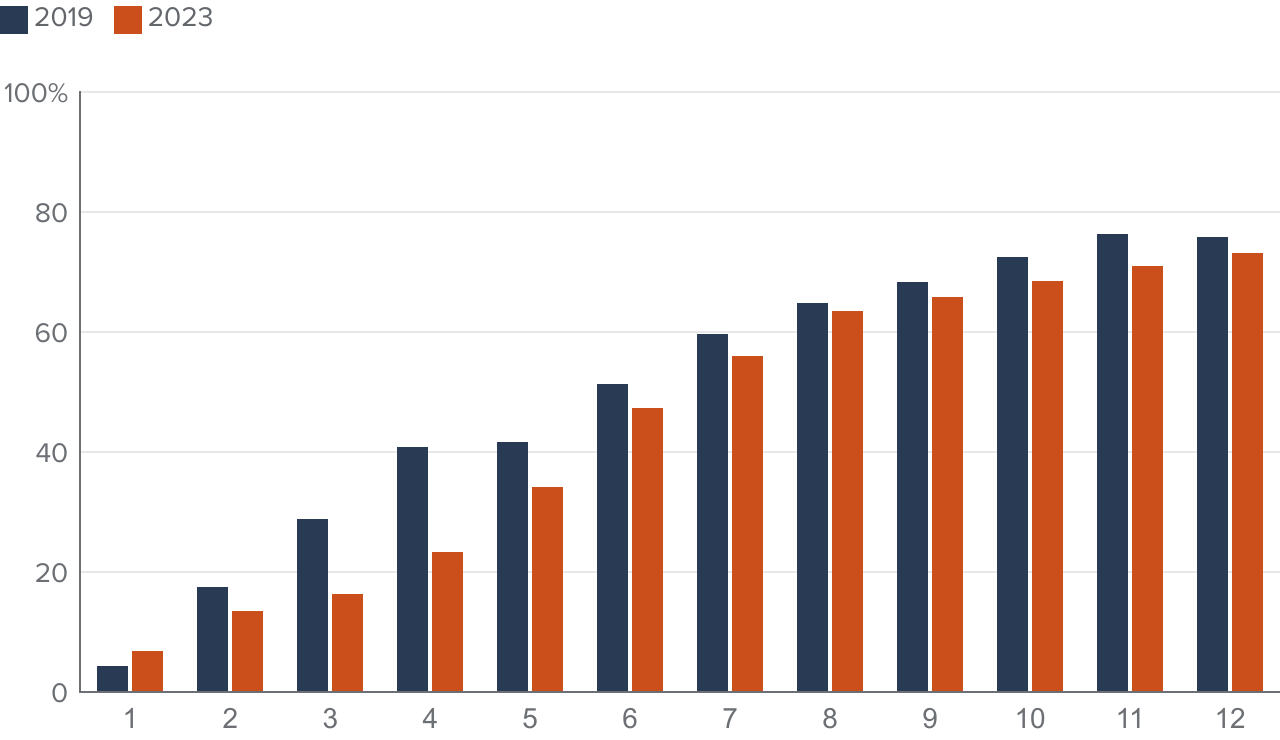
The effects of the pandemic on reclassification still linger for most EL students in 2nd through 6th grade in 2023–24. Many more of them remain in EL status now than would have in the past. These impacts are evident when we compare the share of ever-EL students reclassified by grade, pre- and post-pandemic (Figure 9). Nearly all grade levels, aside from 1st grade, have much lower shares of reclassified students than before the pandemic; the impact is especially pronounced among 3rd and 4th graders.
On the bright side, the number of students who are reclassified within the first year is slowly recovering. In the 2021 kindergarten cohort, 12 percent of students were reclassified by the end of 1st grade/start of 2nd grade in 2023 compared to only 4.5 percent in the 2019 pandemic cohort. In the most recent year of data, 6 percent of kindergarten English Learners in 2022 were able to be reclassified before they even started 1st grade, which has been the highest initial share of all cohorts. Even before the pandemic, initial reclassification rates within the first year were on the rise.
One possible reason for this increase could be related to increasing numbers of children starting in public schools while they are just four years old, through the Transitional Kindergarten (TK) program. Analyses of the impact of TK on EL students found that those participating were slightly more likely to be identified as ELs than similar students who enrolled directly in kindergarten, but that they were also reclassified quickly (Lafortune and Hill 2023).
Reclassification has yet to catch up for all grade levels except 1st grade
SOURCE: CDE Enrollment by English Language Acquisition Status, Long-Term English Learner, and At-Risk, by Grade, 2015–16 to 2023–24.
NOTES: Bars represent the share of ever English Learners that are reclassified. See Technical Appendix B for our full methodology for calculating reclassification rates.
Districts are aware of the work they must do to catch EL students up. While we did not ask districts this question, the issue surfaced across many conversations,
“We have one TOSA [Teacher on Special Assignment] for our entire district… Our TOSA got some training and went to SIOP [Sheltered Instruction Observation Protocol] training…so hopefully they’ll be able to do some professional development to give teachers more tools to directly focus on how to do really good instruction for ELs.”
Two districts were struggling to ensure that all EL students were being offered language acquisition programs at all. Each highlighted the need for a designated ELD program to be administered during a protected time during the school day at every school in its own district (“…something that we’re working on is ensuring that designated ELD is happening across the board at every single one of our school sites.”). Another emphasized that having an integrated ELD program—a pedagogy that is provided to ELs throughout the full school day and across all subjects by all teachers—is necessary at the secondary level.
We heard from a few districts that started to standardize reclassification policies and procedures to make sure eligible students were not overlooked and that students were treated equitably. Their process included investing in software to help keep track of the various components of the reclassification requirements as well as to automate decision making.
A few districts described increasing the number of times a year students could be reclassified. One district reported that by allowing multiple opportunities for reclassification, English Learners who met the English Proficiency requirement did not have to wait to be reclassified (Criteria 1, with qualifying ELPAC scores of 4). Moreover, students could meet the Basic Skills requirement (Criteria 4) and have more opportunities for reclassification by having the results of any of the Northwest Evaluation Association (NWEA) MAP Growth Test or the Smarter Balanced Assessment Consortium (SBAC) assessments.
Many districts were also optimistic about implementing the OPTEL to promote a standardized and equitable metric for teacher and parental evaluations (Criteria 2 and 3 for reclassification). One district noted that this tool is especially useful in assessing students with disabilities and giving them the appropriate pathways to be reclassified on time.
The Share of Long-Term English Learners Is Higher Now than Pre-Pandemic
Students who are not reclassified in a timely manner are at risk of becoming long-term English Learners (LTEL). This group of students receives much policy attention due to their poor academic outcomes, including lower standardized test scores in English language arts and math and lower graduation rates (Price et al. 2024).
Schools with higher concentrations of LTELs also have fewer courses taught by fully certified staff and are less likely to offer a State Seal of Biliteracy (Price et al. 2024). Moreover, 32 percent of LTELs have a disability compared to 14 percent of other English Learners who are not LTELs, and 88 percent of LTELs are socioeconomically disadvantaged compared to 84 percent of non-LTEL English Learners (CDE Dataquest 2023-24 enrollment data). This makes it important for districts and policymakers to carefully approach the problem of (1) mitigating the number of students who are at risk of becoming LTEL and (2) providing the necessary support for existing LTELs.
In our cohort analysis, we observe the EL status in the most recent year of data for the grades primarily impacted during the pandemic (grades 2–5), and we compare their progress to that of pre-pandemic students in the same grade levels (Technical Appendix Table B4). Despite a lower absolute number of LTELs in 2023 than 2019, the share of LTELs or those at risk of LTEL status (being an EL for four to five years) is about 3 percentage points higher among 5th through 8th graders in 2023 than in 2019. Furthermore, the share of reclassified students is lower in each grade level in 2023 compared to 2019. While it is reasonable to expect that these higher shares of at-risk and LTEL students will return to pre-pandemic levels eventually, districts may be straining to serve and reclassify these students now.
The state has now started monitoring long-term EL students on the California School Dashboard, which will help highlight the needs of these students. In our conversations with school districts, many mentioned their efforts and challenges (especially at the secondary level) in identifying students and providing the support and instruction they need:
“We’ve differentiated our ELD courses: one geared for academic language development for long-term English learners versus a traditional ELD class course for students who aren’t LTELs. We had to rethink the courses that we’re offering at the secondary level… I think we are in year six or seven with the Sobrato Early Academic Language [(SEAL) Program]… to really look at diminishing… our numbers of long-term English Learners.”
“We saw the impact [of COVID]… that many [students] are behind in acquiring reading foundation skills … in K, 1st, 2nd, 3rd grade. And it continues where we see students now who are in 5th grade, 6th grade struggling to read… We’re adding more support at the elementary level … supporting our teachers to then directly impact instruction. We’re going to bring that to secondary as well next year.”
“We’re finding that those materials [in the high school EL curriculum] aren’t really meeting the needs of our students. [T]here’s a big shift … we need more academic oral language development…. Nor is it [oral language development] common, instructional pedagogy with a lot of our teachers, even though they have a cross-cultural language acquisition, development, certification.”
A district staff member described their high school EL curriculum as inconsistent, with each teacher creating their own lesson plans. In this district, inexperienced teachers are often assigned to ELD classrooms, but as they gain experience, they transfer out—leaving these classrooms to the next group of new hires. The staff member had been developing a standardized high school ELD curriculum, but staffing cuts due to declining enrollment meant that this task would likely be put on hold until the staff member is returned to the classroom.
Moreover, districts that we spoke to often cited student burnout or apathy as a common trait among their LTEL student population:
“We also see a disengagement … within our [LTELs]… They have fluent practices in English… [but only] with common vernacular, [and] not academic language. So teachers mistake that they don’t need the supports because of that… We also see disengagement from the students because they’ve been failing for a while… and so if they… can … have fun in class and be more social with their peers, it covers up the fact that they struggle academically.”
The same district indicated that they have started to implement new hands-on and practical approaches to better educate their LTELs, including integrating arts in their English language development program or adding career and technical pathways into their programming.
EL Programs, Staffing, and Services
Given the enrollment declines in the EL population, districts may struggle to provide robust programs with properly trained teachers. Demand for bilingual instruction has increased despite falling enrollment, and districts are facing shortages of qualified teachers.
Districts Are Working to Offer and Staff More Bilingual Programs
Generally, bilingual instructional programs are still relatively uncommon, but they are increasing in popularity, particularly the Dual Language Immersion (DLI) program. Studies have recognized the long-term academic and social benefits of these programs for EL students (Marian, Shook, and Schroeder 2013; Nascimento 2017; Porter, Vazquez, and Umansky 2023). Such benefits have increased parent demand and spurred state funding of $10 million to expand DLI programs.
DLI programs are also essential in helping meet the state’s biliteracy goals. CDE reports that in the 2023–24 school year, 1,360 schools offered a multilingual program, up from 1,281 schools in the 2022–23 school year. This does put the state on track to achieve one of Global California 2030’s goals to have 1,600 multilingual programs in schools by 2030, fewer than 240,000 students participate in bilingual instruction.
Parent worries about student progress make it difficult to offer bilingual courses
While dual immersion programs typically require a 50/50 mix of English Learners and English-only students, demand for these programs is shared unequally, as some districts noted:
“It continues to be a struggle to get our Spanish-speaking [students] into the [Dual Language Immersion] program. We have a waiting list for our English-only students, but for Spanish-speaking, we have to go out and really recruit and [explain] why it’s good for your child. It’s changing those mindsets of our Spanish-speaking parents to understand that if your child can have this support they will learn English faster, and they will learn the academics at the same time.”
“There’s a decline in EL enrollment within our dual immersion programs at the secondary level…We want a 50/50 mix at least. But we’re not really seeing that. It’s really going about two-thirds [English only].”
This hesitation—coupled with the declining enrollment among English Learners—can make it harder for dual-language programs to exist. While the common concern among EL families is that bilingual instruction might slow progress in English, research shows that ELs educated in bilingual classrooms may take longer to reclassify, but they achieve the same reclassification rates and have better academic outcomes than ELs without bilingual instruction (Umansky and Reardon 2014).
A few districts noted the benefits of dual immersion programs for newcomer students. One noted that the model was particularly good for high school new arrivals—they could best be paired with reclassified ELs in these classrooms and have home language support while acquiring English. Another noted:
“Within our DLI task force, [we ask] where is a good placement for newcomers? Is it in a dual language program, or is it in a structured English immersion program? And what we found is that when we put them in a dual language [program], they do better… because they’re supported by their primary language… Structured English Immersion becomes a little bit more like a sink [or] swim model.”
The shift from Structured English Immersion programs to Dual Language Immersion programs is therefore important to consider in both addressing the needs of the existing English Learner population as well as aiding in the state’s biliteracy goals.
Many districts face shortages of trained bilingual teachers
Despite having fewer EL students, and perhaps because of increased demand for bilingual instruction, districts still report having shortages of qualified teachers. None of the districts we spoke to mentioned any great ease in finding teachers with the proper training and certification to teach English Learners. This was a particular issue in more remote and less urban districts.
“It’s been difficult to get the credentialed DLI teachers. And maybe it’s because we’re in a small town… finding credentialed teachers that want to come to our town is difficult unless they’re [home] grown. And [even] then, they don’t want to come back here.”
“Staffing that program has been difficult because you’re looking for that needle in a haystack… We are competing with those bigger districts around us, and it’s very difficult.”
Another more remote district lacked both sufficient students and staff to provide DLI instruction in the way they wished to. Instead, their one district school with DLI had very few students, and they had to combine grade levels in the same classroom and they employed staff without full credentials.
“We also struggled with being able to staff [schools with] teachers that are meeting the requirements of Spanish-speaking instruction… [or] what the state calls highly qualified or appropriately assigned… so we’ve had to sink down our teaching staff and [form] combo classes, [meaning]… the teacher is teaching two different grade levels [in a dual language immersion] within one classroom.”
The slow progress in establishing enough approved bilingual teacher preparation programs likely hinders efforts to fully staff EL programs. While the Global California 2030 Initiative projected 50 approved bilingual teacher preparation programs by 2020 and 90 approved programs by 2025, the state still lags and currently offers 48 bilingual authorization programs, according to the California Commission on Teacher Credentialing (García Mathewson 2025).
Districts lament the lack of training services in Bilingual, Cross-Cultural, Language, and Academic Development (BCLAD) for their teachers and often must resort to other ways to staff bilingual programs:
“Some of our dual immersion teachers at the high school level may not be fully [certified] with BCLAD… [so instead] we have some high school teachers who are native Spanish speakers who may not have the BCLAD authorization and are going through the process.”
“We have recruited outside of our district because we don’t have the credentialed teachers within the district that have a BCLAD to be able to teach a [DLI program]. So it’s been a struggle. We could not recruit a TK teacher so… right now, we are with a long-term substitute.”
Demographic Changes May Leave More Families Linguistically “Isolated”
Along with declining enrollment among English Learners, the composition of ELs who speak a language other than English is slightly changing as well. While the majority of English Learners are still Spanish speaking (81%), this share has been slowly falling over time (Technical Appendix Figure B4). The share of English Learners who speak Mandarin and Arabic both rose until 2019, and the Mandarin share has increased again recently to 2.1 percent in 2023–24.
These changes in enrollment and language composition could also have an impact on the potential language services that English Learners need at schools. Schools are required to provide translation services for any notices, reports, or documents sent to parents or guardians in any language when at least 15 percent of the student population speaks it at home, which includes students who are classified as English Learners or Fluent English Proficient (both reclassified or initially fluent), according to the California Code, Education Code 48985(a) (2019). With enrollment declines, some families may not receive translation services anymore; families may end up isolated, missing out on important school notifications because the messaging is in English, and parents or guardians may not understand the notice or may not realize they should be concerned. Similarly, newly arriving groups may not reach the threshold that requires translation services.
To estimate the number and share of linguistically isolated students, we sum all multilingual students (EL, RFEP, and Initial Fluent English Proficient (IFEP)) by language at the school level and divide by the total number of multilingual students. Those who fall below 15 percent at the school level are linguistically isolated; those above 15 percent receive translation services.
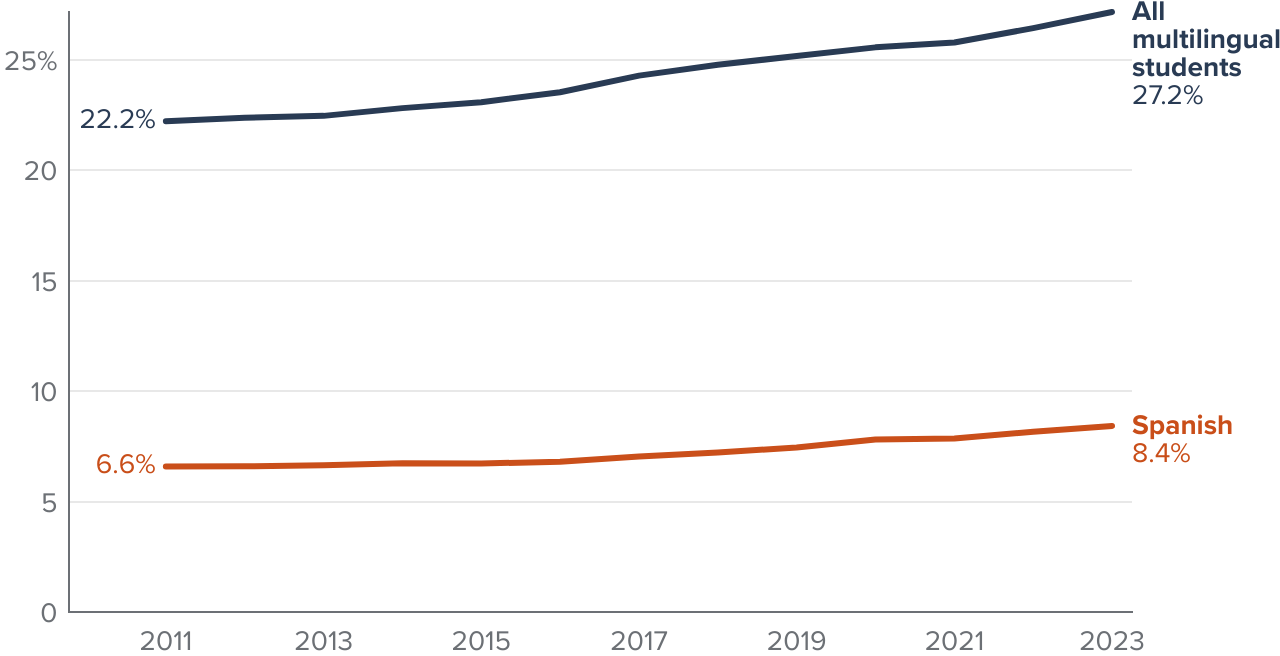
Of all the languages that are offered translation services at schools, Spanish accounts for over 90 percent. The other main languages that are offered translations are Mandarin (2%), Vietnamese (2%), and Cantonese (1%). However, the share of multilingual students who are isolated at schools with no translation services has increased by about 5 percentage points since 2011 and now stands at over a quarter of all multilingual students—or 616,500 students (Figure 10). For Spanish speakers, the isolated share has ticked up slightly from 6.5 percent in 2011–2012 to 8.4 percent in 2023–24 (or 143,500 students).
The share of multilingual students who are isolated without translation services at schools has increased slightly
SOURCES: California Department of Education, English Learners by Grade & Language 2011–2023; FEP Students by Grade & Language 2011–2023; Enrollment by School Files 2011–2022; Census Day Enrollment Data 2023.
NOTES: To determine the share of a language group that is isolated, we first calculate how many students speak a certain home language at a given school, combining both English Learners and Fluent English Proficient students (which includes both Initially FEP and Reclassified FEP). If the counts do not meet 15 percent of the school’s total enrollment, those students do not receive translation services, and we classify them as being isolated. We aggregate the total number of students who are isolated, by language, and the total number of students who speak the given home language to calculate the share of students that speak a non-English language who are isolated. We then aggregate across all languages to calculate the total share of students who are isolated.
For other major language groups, the isolated share varies, but more than half of the students from most language groups are at schools that do not offer any translation services for families (Technical Appendix Figure B5). Students who speak Hmong experienced the largest increase in isolation over the past decade, with the percentage rising from 75 percent in 2011 to 96 percent in 2023. Shares also increased for Cantonese, Korean, and Filipino-speaking students who attended schools where their numbers do not meet the 15 percent threshold.
Two other groups are becoming more likely to receive translation services: Mandarin and Armenian speakers. In fact, Armenian-speaking students have the lowest share of isolated students aside from Spanish, with about 60 percent of students receiving translation services. This implies that despite being a less-represented language group statewide, Armenian-speaking communities are more likely to be clustered in schools such that they comprise at least 15 percent of the total school’s enrollment.
Parent committees are also changing as enrollment declines
Parent organizations such as a District English Learner Advisory Committee (DELAC) and English Learner Advisory Committee (ELAC) may also be affected by declining English Learner enrollments. In California, each public school requires at least 21 ELs to establish an ELAC, and each school district requires at least 51 ELs to form a DELAC.
While we did not interview any districts with fewer than 51 EL students, we estimate this requirement could impact as many as 295 districts (27%) in the state in 2023–24. Between 2015–16 and 2023–24, 32 districts that had previously been above that threshold fell below it. Conversely, 22 districts moved above.
ELACs and DELACs work to improve parents’ understanding of programs and services targeting English Learners. For instance, parents involved in the ELAC receive training to best develop the Single Plan for Student Achievement (SPSA) for English Learners or increase awareness of the importance of regular school attendance. In the DELAC, committee members may also review school district reclassification procedures or conduct a district-wide needs assessment on a school-by-school basis. We heard examples from our district interviews of the many important ways these committees have helped districts improve services to their EL students.
Districts told us that they had to work hard to communicate with non-English speaking families about benefits of English Language Development Instruction through Dual Language Immersion programs:
“We continue to really focus on educating families about the value of first language instruction… Something that has really supported [families]… is sharing the data [on] reclassification rates … and the academic achievement data of our English Learners who have been part of the dual language program versus those that have not… Sometimes the data tells a story that they will … pay different attention to.”
For districts, communication with families is essential to understanding the populations in their schools. Through parent discussions, a district discovered that they had a growing Mandarin-speaking population. While the children were enrolling as initially fluent in English, many families are monolingual Mandarin-speaking. The district is about to offer translation services, and through engagement with the parent community has learned that there is demand for Mandarin DLI instruction.
“[One goal] written into our [Local Control and Accountability Plan] was to bring in bilingual community liaisons. At that time … they were bilingual English and Spanish. We really began focusing on having parent centers at each of our schools… Needs assessments were conducted through that process, which was how we surfaced this growing Mandarin community… [We] added a Mandarin-speaking community liaison that has really opened the door.”
Upcoming Policies May Help with Planning
Efforts are underway to improve EL identification with the youngest students and to better determine when they need supportive services. First, districts piloted the reading difficulty screener during the 2024–25 school year, and the screener is due to be implemented at all districts in 2025–26. Also in the 2025–26 school year, districts will use a new assessment to identify transitional kindergarten students who need EL services.
Most districts we spoke to already used some form of universal screener to identify which of their youngest students were struggling to read. At least one district was already using a screener approved by the state, and most others were in the process of deciding which of the state’s four approved assessments they would use next year. For districts we interviewed, those with Spanish-language versions of the test are being prioritized.
Children entering TK were not screened with the ELPAC in 2024–25, even if they were identified as having a home language other than English on the Home Language Survey (see Figure 2, earlier). Prior PPIC research found TK administrators mostly thought this was a good outcome, but one noted that teachers in their DLI programs missed having the initial and summative ELPAC test scores to measure the progress of TK ELs (Hill and Lawton 2025). Similarly, most EL administrators felt the ELPAC was not appropriate or helpful for 4-year-old children, and might over-identify children as needing EL services:
“I am thrilled at how we move forward with not assessing transitional kindergarten children with the initial ELPAC for many reasons… When we bring a child to an assessment center with a stranger, the child might not even produce the language. They won’t speak anything. They don’t know you. And it [could] be the most friendl[y] environment, but that child might not produce what you want them to produce because they are not comfortable. And it’s normal!”
EL administrators reported that TK instructors find test scores unnecessary in providing a language-rich environment conducive to English acquisition: “Every kid at that age is an English learner.” Most felt that the ELPAC taken after the TK year would reveal the “true” English proficiency of their students who speak a language other than English at home.
Still, one district wished there were more concrete measures of progress for TK students learning English as a second language. Another district commented that while it makes sense developmentally for children to take the assessment after TK, the elimination of the ELPAC still leaves districts uncertain on how to provide the appropriate learning structure to students who will still likely be classified as English Learners in kindergarten.
Conclusion and Recommendations
English Learner enrollment has been falling for a decade. Over half of districts are seeing losses, and the decline in EL students explains most of the overall K–12 enrollment decline in the state. Slightly more than a third of districts are seeing growth; most are inland districts in more affordable areas of the state. However, the makeup of EL populations has shifted even in some declining districts: greater numbers of newcomer students (from Central and South America) are enrolling as their population of native-born EL students (mostly of Mexican decent) is shrinking.
And while EL numbers are shrinking, interest in offering bilingual instruction rather than Structured English Immersion is on the rise. District staff have found that, despite fewer EL students, pressure has not eased on the shortage of longstanding bilingual certified teachers. Further, we do see subtle increases in the share of families who are linguistically isolated at their schools—without translation services—as overall numbers of EL students decline and the language diversity among EL students increases.
The period of remote instruction took a toll on the rates of EL students who were Reclassified Fluent English Proficient (RFEP). Our estimates suggest that while overall reclassification rates have rebounded, the share of ever-EL students who are currently reclassified is below pre-pandemic levels. Districts reported real struggles in just reaching students during remote instruction, especially the youngest of children, and reclassification was not a priority in all districts. Many districts have doubled down on their efforts to catch up but acknowledge having work to do with both younger students (who missed key reading instruction) and older students (who have failed to reclassify before high school). A bright spot in recent reclassification data—rates of reclassification for first graders are higher than ever.
One development that shows some promise for improving reclassification rates is eligibility for universal transitional kindergarten. By bringing students into California’s K–12 system at a younger age, students gain access to a rich, language-based curriculum and possibly receive English Language Development services earlier.
A second development is that all kindergarten children will be screened using a reading difficulty assessment, starting in the 2025–26 school year. There is optimism that this assessment will be a useful tool in properly identifying learning difficulties separately from lags in learning English for second-language learners. Using an early screener may lead to more accurate and timely identification of challenges with reading and potential learning disabilities. Prior research has demonstrated that students who have a disability are more likely to remain English Learners for more than six years (Umansky et al. 2017).
Finally, a third development is that long-term EL students are a focus of new attention in the state’s dashboard.
We conclude with a few recommendations.
- The California Department of Education should help parents and educators monitor reclassification rates by publishing those data as they had prior to 2021–22.
- The State Board of Education should encourage districts to automate reclassification decisions, standardize reclassification decisions, and provide opportunities for reclassification multiple times a year—each time new results (e.g., ELPAC, Basic Skills, teacher evaluation) are available.
- As districts implement the reading difficulty screener, help teachers identify and target EL students with reading challenges early, with an eye towards avoiding LTEL status (and avoiding misdiagnosis of special education status).
- Despite declining numbers of ELs, California should continue to graduate new teachers and train existing teachers prepared to educate ELs and meet the increasing demand dual language immersion instruction.
- Districts should be attuned to families’ concerns about stigma around being identified as an English Learner and help them understand the benefits of participation in Dual Language Instruction.
- Some districts report using technology and partnerships with community-based organizations to assist with translation as newcomer populations and shifting migration patterns create new challenges in communicating with students’ families. Given the ease of digital translation, these resources could be marshalled across districts.
- CDE should continue to report language instruction program data indicating the number and type of bilingual programs at the school level. Starting in 2024-25, it began publishing the number of students enrolled in bilingual programing. We encourage CDE to continue publishing these data (differentiated by EL and English-only status) to better track progress in achieving one of the main goals of Global California 2030.
Topics
Immigrants in California K–12 Education PopulationLearn More

Policy Brief: Accelerating English Learner Progress by Improving Reclassification

California’s English Learners Face District Roadblocks to English Fluency

Fewer English Learners but No Less Demand for Programs

Making Gains in Gateway English and ESL through Dual Enrollment

Declining Enrollment among Multilingual Students Has Affected Most California School Districts