

Table of Contents
- Key Takeaways
- Introduction
- Grant Aid’s Role in Affordability and College Outcomes
- Changes in College Enrollment and Financial Aid Access
- College Enrollment and Aid Access across Student Groups
- College Choice and Aid Access by Institutional Sector
- Conclusion and Recommendations
- Notes and References
- Authors and Acknowledgments
- PPIC Board of Directors
- Copyright
Key Takeaways
California needs more college graduates to meet future workforce demands, and expanding access to financial aid is a key strategy to support this goal. Completing a financial aid application—such as the Free Application for Federal Student Aid (FAFSA) or the California Dream Act Application (CADAA)—is a critical step for students to access need-based aid and make informed decisions about college. In 2022–23, California implemented a universal FAFSA/CADAA policy, which requires school districts to ensure that all high school seniors complete a financial aid application or formally opt out.
This report analyzes changes in college enrollment and student access to financial aid in the policy’s first year of implementation. We find:
- The policy contributed to an increase of almost 1,500 additional students enrolling in college. This increase corresponds to a 0.3 percentage point uptick in the college-going rate. Compared to the year before the policy took effect, the share of high school seniors completing the FAFSA rose by 10 percentage points. The shares of seniors eligible for grants given to low-income students went up as well (by 7 points for the federal Pell Grant; by 4 points for the Cal Grant). →
- The share of high school seniors who completed a FAFSA and enrolled in college grew by 6 percentage points. This reflects not only an overall increase in college enrollment but also more students gaining access to financial aid upon enrollment. In fact, the share of college enrollees eligible for the Pell Grant rose by 6 percentage points, and the share of in-state college enrollees who received a Cal Grant increased by 2 percentage points. These gains were broadly distributed across counties in the state. →
- Historically underserved students experienced a greater increase in college enrollment with a completed FAFSA. After the policy, first-generation students, low-income students, and those attending high schools with high shares of underrepresented racial/ethnic groups, including African Americans and Latinos, saw greater gains in both FAFSA completion and college enrollment compared to their peers. →
- Students’ college choices remained mostly unchanged, with a slight shift toward public, in-state institutions. The distribution of college enrollees across higher education sectors changed only slightly, with an uptick of 2 percentage points in students attending public, in-state institutions. Among these institutions, FAFSA completion rates increased the most at California’s community colleges. However, despite this progress, the FAFSA completion rate at community colleges lags behind rates at the University of California and California State University. Public and private higher education institutions in California all saw gains in students’ access to Pell Grants and Cal Grants. →
Introduction
Finding an affordable college and limiting debt remain a priority for parents and students alike in California. Indeed, a recent PPIC survey found that while 71 percent of parents with school-age children in the state want their children to complete at least a bachelor’s degree, a similar share of parents are concerned about their ability to pay for their children’s college education (Baldassare et al. 2025). In an attempt to ensure that more students have access to financial aid that can reduce the cost of college, the state passed legislation through the 2021–22 budget that requires school districts to ensure that each of their graduating seniors, starting in the 2022–23 academic year, complete a Free Application for Federal Student Aid (FAFSA), a California Dream Act Application (CADAA), or an opt-out form.
This policy showed promising signs of success in its first year of implementation, increasing the number of combined FAFSA and CADAA applications 16 percent by the March 2nd deadline for the University of California (UC) and California State University (CSU). Students in the lowest-income category, African Americans, and Latinos—groups that are historically underrepresented in higher education—saw the largest increase in completed applications, leading to hopes that this policy could narrow persistent gaps in college access (Cook, Jackson, and Gomez 2024).
Prior to this policy, only about half of the state’s graduating seniors completed a financial aid application, leaving an estimated $550 million of grant aid on the table, and California’s FAFSA completion rate ranked in the middle of the pack nationwide (Wu 2019). After the policy, gains have been notable: 66 percent of graduating seniors completed the application two years after implementation, and California now ranks seventh in FAFSA completion nationwide (NCAN 2025).
While these gains in completing a financial aid application are promising, applying for aid is just the first step in the often complex process of college enrollment. This report seeks to understand how college enrollment patterns changed in the first year after implementing the universal FAFSA/CADAA policy. Specifically, we aim to answer the following questions:
- How did college enrollment and enrollees’ financial aid access change?
- How did changes in college enrollment and aid access vary across student groups?
- How did college choice and aid access shift across institutional sectors?
To answer these questions, we use individual-level student data provided by the California Student Aid Commission (CSAC), matched with data from the National Student Clearinghouse (NSC), a repository for data on college enrollment and degree completion.
This report begins with a brief overview on the role of grant aid in college affordability and student outcomes. Next, we look at changes in college enrollment and access to financial aid, including regional variation in these changes, and the extent to which the policy contributed to these trends. We then investigate the socioeconomic composition of FAFSA completers and college enrollees by linking data from the California Department of Education. Next, we seek to understand if students’ college choices changed following greater access to financial aid information and whether access to aid varied across sectors of higher education. Finally, we conclude with policy recommendations based on our research findings.
Grant Aid’s Role in Affordability and College Outcomes
Investment in grant aid (i.e., financial aid that students do not have to pay back) has been critical to ensuring that public colleges in California remain affordable and accessible to students. In addition to subsidizing tuition for public higher education, the state will spend approximately $2.6 billion to fund its Cal Grant program in 2025–26 (LAO 2025). With assistance from Cal Grants, federal Pell Grants, and institutional aid provided by UC and CSU, more than half of UC and CSU students do not pay tuition. At California’s community colleges, about half of students receive grants and scholarships, and 40 percent do not pay enrollment fees (Zhou 2024).
Grant aid in California and at the federal level is based on an estimation of students’ financial need, which is provided to the state and higher education institutions through the FAFSA. The FAFSA uses students’ and their parents’ combined federal tax information on family assets and income to determine students’ eligibility for financial aid programs. Students are then provided with their FAFSA submission summary, which includes information about Pell eligibility and federal loan options. The colleges to which students applied then send an award letter detailing students’ program eligibility and what they can expect to pay after all available federal, state, and institutional aid is applied to the cost. Consequently, graduating high school seniors who do not complete a financial aid application do not have access to need-based grant aid, which provides the vast majority of financial support for tuition and living costs for college students in California.
Grant aid has been shown to improve students’ college enrollment, persistence, and degree completion, and shorten time to degree. An established and growing literature has shown that for every additional $1,000 in grant aid that students receive, their likelihood of enrolling in a four-year college the following year increases by 3 to 4 percentage points (Dynarski 2003; Castleman and Long 2016). Grant aid also improves persistence and time to degree by reducing students’ need to work while attending school and allowing students to take a full course load (Denning 2017). Similar studies looking at the relationship between receiving grant aid and degree completion also show small but significant effects. Students who receive an additional $1,000 in grant aid have a higher likelihood of completing a degree, by 1.5 to 2 percentage points (Nguyen et al. 2019; Akers et al. 2017).
More broadly, access to need-based grant aid is essential to ensure that higher education remains a ladder of economic mobility for students from different socioeconomic backgrounds. Recent research has shown that most economically disadvantaged students who receive grant aid earn more than their parents’ combined income by their third year after graduating with a bachelor’s degree, regardless of race, ethnicity, or gender (Kwakye and Oliver 2022). Indeed, in 2023, workers with a bachelor’s degree earned on average 61 percent more than high school graduates (Cuellar Mejia et al. 2025).
California is not the only state to employ a universal FAFSA policy to try to boost financial aid receipt and college access. Fifteen other states have passed similar legislation. In fact, 44 percent of high school seniors in the nation currently attend school in a state with such a policy (Granville, Ramirez-Mendoza, and J. Mikoulinskii 2025). Louisiana was the first state to pass this legislation in 2017–18. In the first year after implementation, the state saw a 19-percentage point increase in FAFSA application submissions, which led to a nearly 2 percent increase, or roughly 500–870 additional students, in college enrollment in the state (Denault 2023). Similar to findings from California and other states, Louisiana’s gains in FAFSA completion and subsequent college enrollment disproportionately favored lower-income students. Since the vast majority of states implementing these policies have done so since 2022, it is not yet possible to measure longer-term policy outcomes like student persistence and degree completion.
Changes in College Enrollment and Financial Aid Access
In this section, we examine trends in college enrollment and access to financial aid, including regional variation, after the implementation of California’s universal financial aid application policy. We also study the extent to which the policy may have contributed to these trends.
FAFSA Completions and Financial Aid Eligibility Grew
In the first year of policy implementation, the state experienced sharp increases in FAFSA completion and financial aid eligibility among high school seniors. The share of high school seniors completing a FAFSA rose from 52 percent to 62 percent, representing almost 42,000 additional applicants between 2021–22 and 2022–23 (Figure 1). When we look back farther, we see that the FAFSA completion rate had been rising before the COVID-19 pandemic but declined after the pandemic began. In 2022–23, graduating seniors had a FAFSA completion rate that was 5 percentage points higher than the pre-pandemic rate of 57 percent in 2019–20.
FAFSA completions rose sharply following the policy
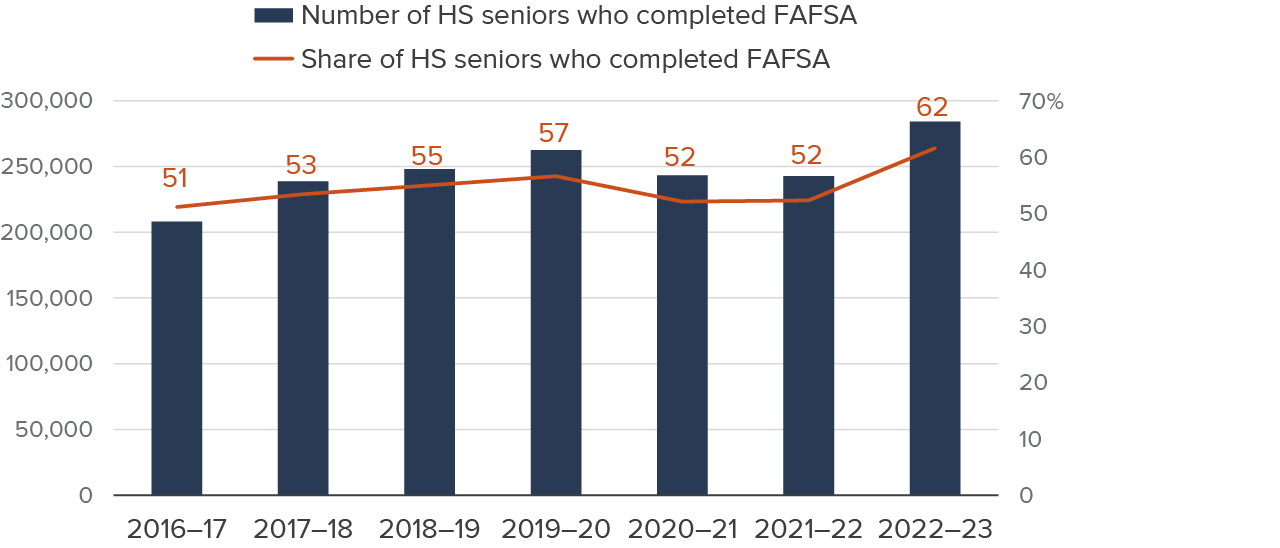
SOURCE: Authors’ calculations using CSAC data.
NOTES: Sample is restricted to high school seniors in graduating cohorts between 2016–17 and 2022–23 in the CSAC data. FAFSA completion is measured by June 30 of the student’s high school graduation year. Figure is created using data from Technical Appendix Table B1.
In addition, the share of high school seniors eligible for the Pell Grant increased by 7 percentage points (from 30% to 37%), and the share awarded a Cal Grant rose by 4 percentage points (from 29% to 33%) in the first year of implementation (Figure 2). These year-over-year increases are larger than for previous cohorts. While part of these increases may reflect factors such as post-pandemic recovery, the overall trends suggest that thousands more students gained access to critical information and support for financing postsecondary education during the first year of the policy’s implementation.
High school seniors saw a notable increase in Pell and Cal Grant eligibility
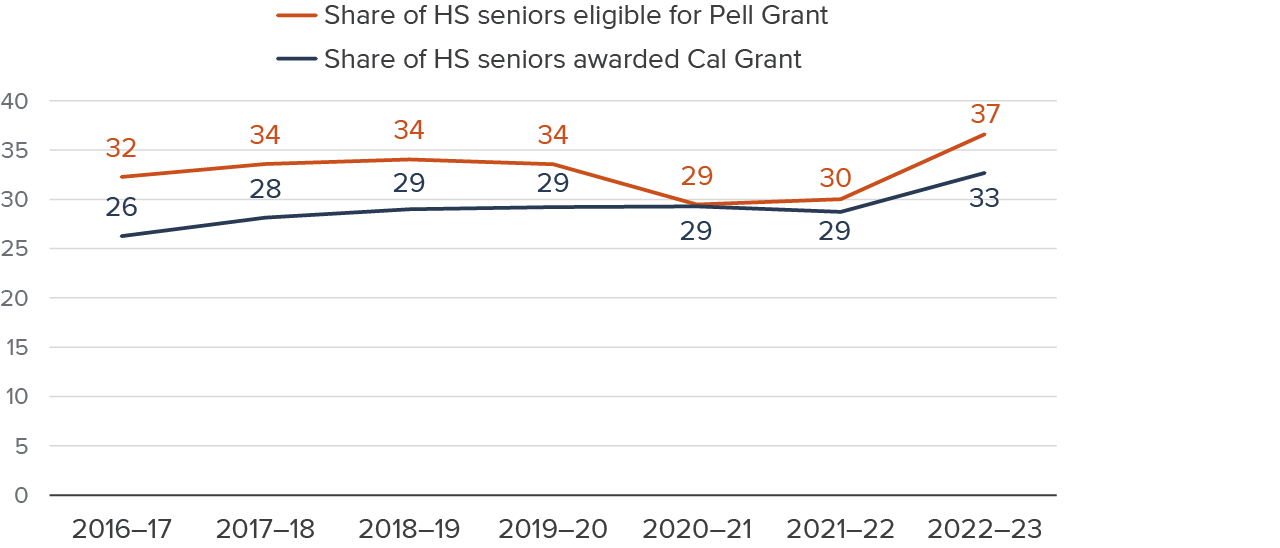
SOURCE: Authors’ calculations using CSAC data.
NOTES: Sample is restricted to high school seniors in graduating cohorts between 2016–17 and 2022–23 in the CSAC data. Figure is created using data from Technical Appendix Table B2.
The Policy Contributed to Gains in College Enrollment
Prior to the policy, the state’s college-going rate peaked in 2017–18 and then declined following the onset of the pandemic (Technical Appendix Figure B1). To analyze changes in the college-going rate, we matched student-level data from CSAC and NSC for three high school graduation cohorts: the class of 2017–18 (the pre-COVID peak cohort), the class of 2021–22 (the cohort immediately before the policy), and the class of 2022–23 (the first cohort under the policy). We find that after the first year of implementation, the college-going rate increased by 3 percentage points from the previous year, returning to the pre-pandemic level (Figure 3).
College-going increased after the policy, returning to its pre-COVID level
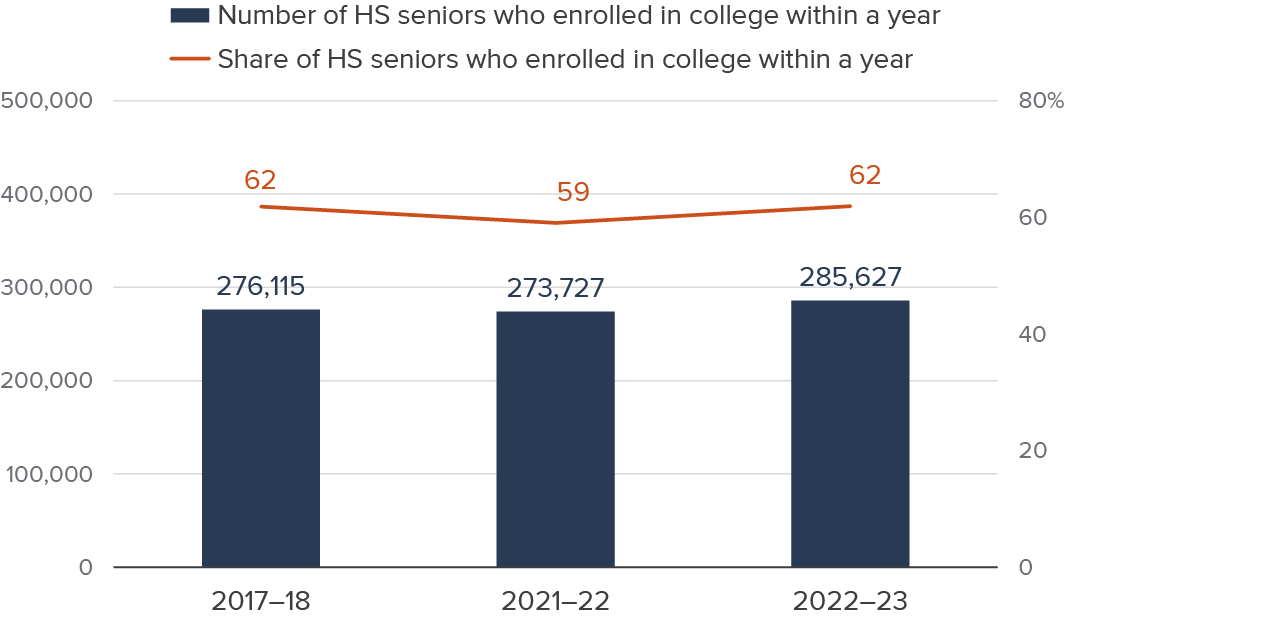
SOURCE: Authors’ calculations using matched CSAC-NSC data.
NOTES: Sample is restricted to high school seniors in graduating cohorts of 2017–18, 2021–22, and 2022–23 in the CSAC data. Students are matched to NSC records, and those with college enrollment between July 1 of the high school graduation year and June 30 of the following year are counted as students who enrolled in college within a year (e.g., for the class of 2017–18, college enrollment is measured from July 1, 2018 to June 30, 2019). Figure is created using data from Technical Appendix Table B3.
Most high schools saw an increase in college-going rates after the first year of implementation (Technical Appendix Figure B2). While this overall increase coincided with the first year of policy implementation, other factors, such as the post-COVID recovery, may have also contributed. When we compare high schools’ change in college-going rates with their pre-policy FAFSA completion rate in 2021–2022, we note that schools with lower baseline FAFSA completion rates experienced larger positive changes in their college-going rates compared to schools with higher baseline rates. Since schools with lower baseline FAFSA completion rates would have had more potential room for improvement in FAFSA completions under the policy, these patterns suggest that the policy could be a contributing factor in the overall increase in the college-going rate.
When we quantify these patterns, we estimate that the policy contributed to a 0.3 percentage point increase in the statewide college-going rate, equivalent to an estimated 1,500 additional students enrolling in college (see specifications for our dosage difference-in-difference model in Technical Appendix A). While the increase is modest, the results indicate a statistically significant positive impact of the policy on college enrollment after controlling for a range of other potential influencing factors.
Aid Access Improved among College Enrollees
Not only did overall college enrollment increase following implementation, but the number of students enrolling in college with a completed FAFSA—thereby gaining access to financial aid—also rose, and on a greater scale. The share of high school seniors who completed FAFSA and went on to enroll in college grew by 6 percentage points, from 42 percent to 48 percent in the first year of implementation (Figure 4). The most recent rate (for those graduating in 2022–23) exceeds even the pre-COVID level observed in the class of 2017–18, when 43 percent of seniors enrolled in college with a completed FAFSA.
The share of high school seniors enrolling in college with a completed FAFSA increased
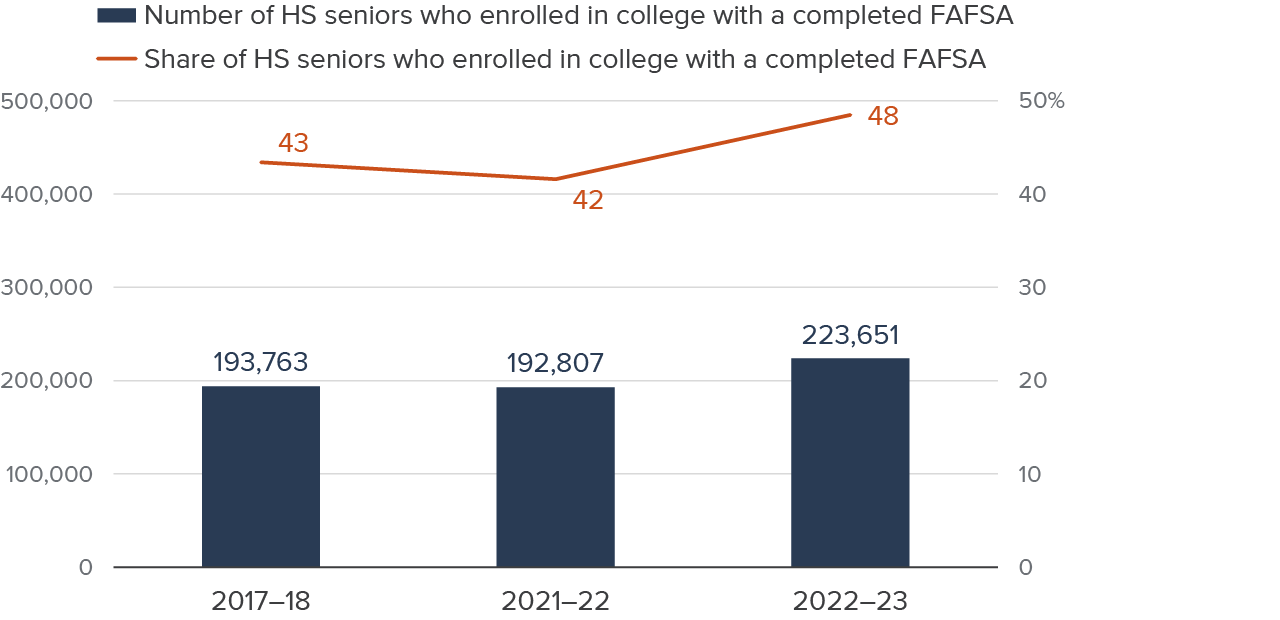
SOURCE: Authors’ calculations using CSAC data.
NOTES: Sample is restricted to high school seniors in graduating cohorts of 2017–18, 2021–22, and 2022–23 in the CSAC data. Students are matched to NSC records, and those with college enrollment between July 1 of the high school graduation year and June 30 of the following year are counted as enrolled. FAFSA completion is measured by June 30 of the student’s high school graduation year. Figure is created using data from Technical Appendix Table B3.
While some of this increase may reflect the direct effect of the policy on college enrollment or broader, unrelated trends in FAFSA completion and college enrollment, the policy may have also encouraged more college-bound students to complete the FAFSA. This highlights an important aspect of the policy: it not only supported students on the margins of enrolling in college but also improved financial aid access for those who would have enrolled in college regardless.
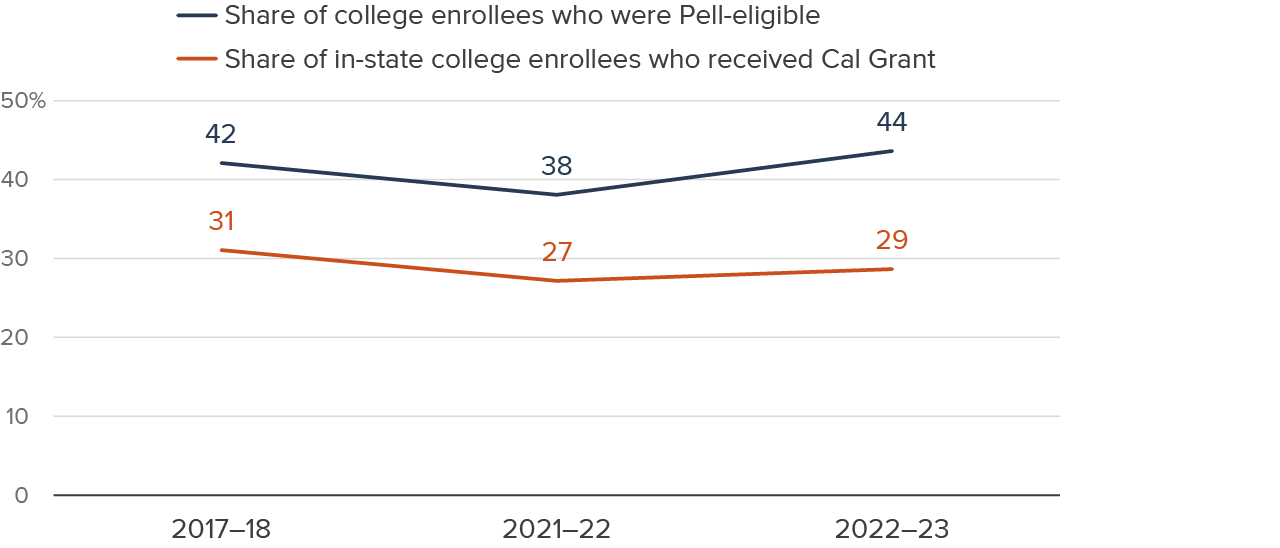
Expanded access to financial aid is also reflected in the increased share of college enrollees who became eligible for the Pell Grant or received a Cal Grant following policy implementation. Among high school seniors who enrolled in college after graduation, the share eligible for the Pell Grant rose by 6 percentage points, from 38 percent for those graduating in 2021–22 to 44 percent for those graduating in 2022–23. The share of in-state college enrollees who received a Cal Grant also increased, from 27 percent to 29 percent over the same period (Figure 5). These gains suggest that the policy helped more college enrollees successfully access the financial aid they qualify for, though other factors, such as the expansion of Cal Grant entitlement awards for community college students, may have also contributed.
More college enrollees became eligible for the Pell Grant and/or received the Cal Grant
SOURCE: Authors’ calculations using CSAC data.
NOTES: Sample is restricted to high school seniors in graduating cohorts of 2017–18, 2021–22, and 2022–23 in the CSAC data. Students are matched to NSC records, and those with college enrollment between July 1 of the high school graduation year and June 30 of the following year are counted as enrolled. Figure is created using data from Technical Appendix Table B4.
Most Counties Showed Gains in College Enrollment
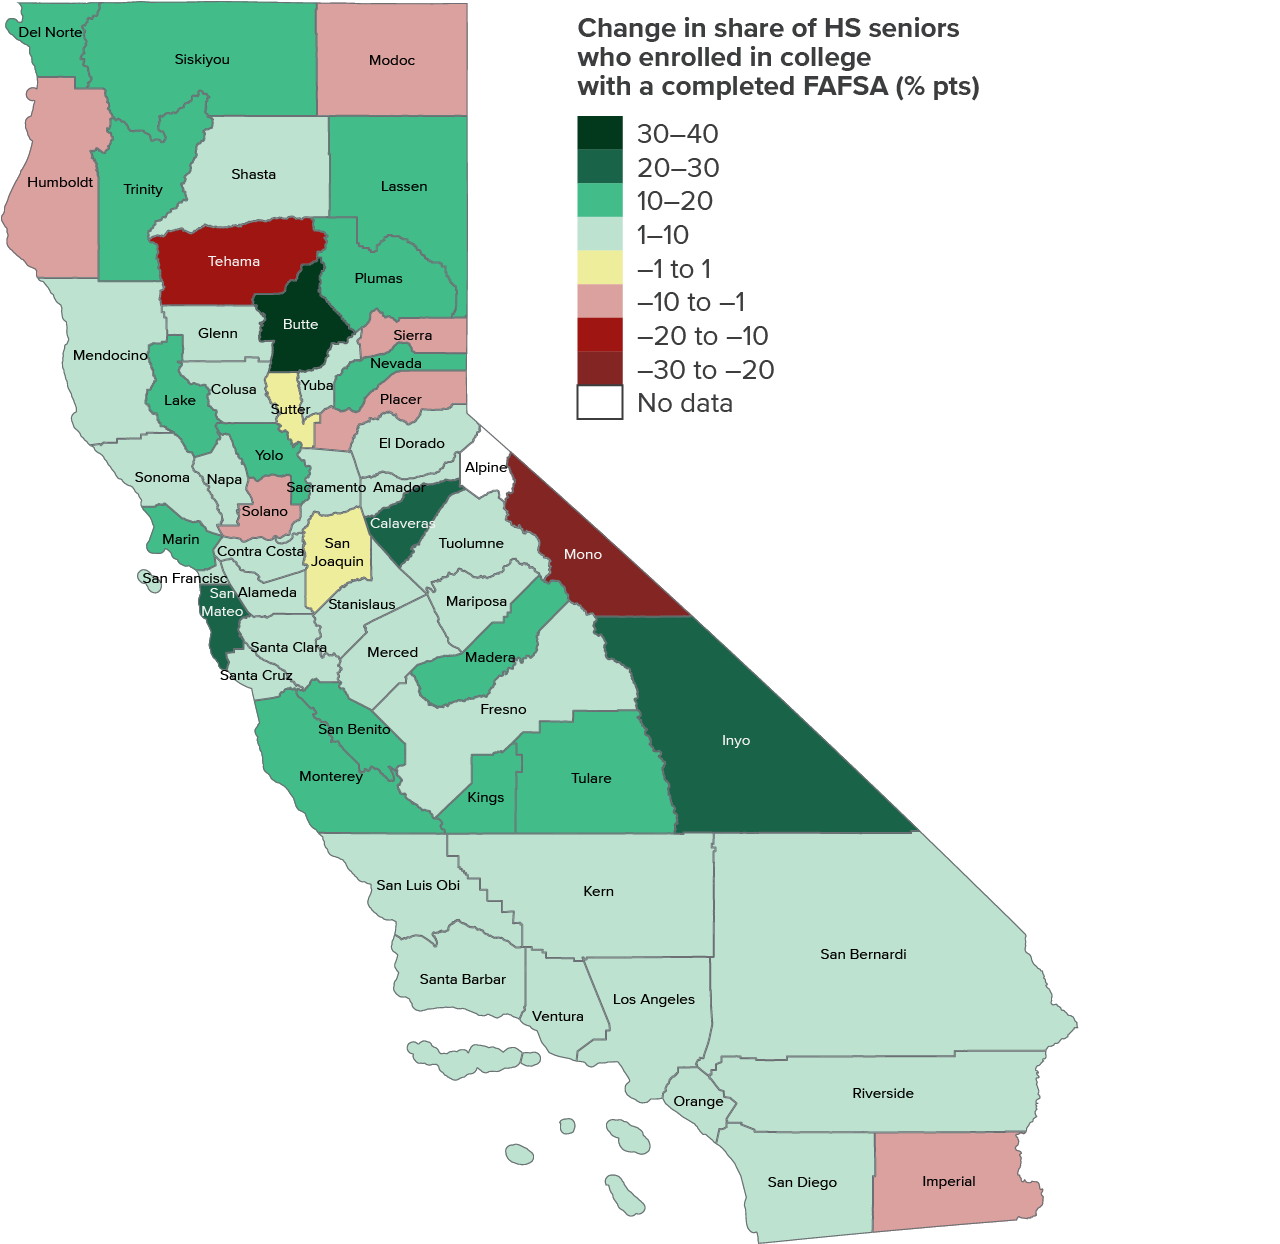
Improvements in FAFSA completion and college enrollment were widespread across counties. Of the 57 counties in California with 12th grade enrollment, most saw meaningful gains after the first year of implementation. Only ten counties experienced declines greater than 1 percentage point in the share of high school seniors who completed the FAFSA, and two counties saw minimal change (between -1 and 1 percentage point). The remaining 45 counties all saw increases of more than 1 percentage point (Technical Appendix Figure B3).
A similar pattern holds for college-going rates: only five counties saw declines greater than 1 percentage point, and seven counties showed little change. Meanwhile, 46 counties experienced increases of more than 1 percentage point. When looking at the share of high school seniors who enrolled in college with a completed FAFSA, just eight counties had declines of more than 1 percentage point, two counties showed minimal change, and the remaining 47 counties saw improvements of more than 1 percentage point (Figure 6). Overall, the results show broad gains in both college enrollment and financial aid access across most counties in the state following the policy.
Most counties showed improvements in college enrollment with a completed FAFSA
SOURCE: Authors’ calculations using CSAC data.
NOTES: Sample is restricted to high school seniors in graduating cohorts of 2021–22 and 2022–23 in the CSAC data. Students are matched to NSC records, and those with college enrollment between July 1 of the high school graduation year and June 30 of the following year are counted as enrolled. FAFSA completion is measured by June 30 of the student’s high school graduation year. Data are reshaped to the county level. Figures show changes from the class of 2021–22 to the class of 2022–23. Alpine County is missing from the figure as there was no 12th grade enrollment in 2021–22 and 2022–23 in the county. Figure is created using data from Technical Appendix Table B14.
College Enrollment and Aid Access across Student Groups
In this section, we investigate the socioeconomic composition of FAFSA completers and college enrollees to examine which student groups are benefiting from greater access to financial aid.
First-Generation Students Saw Greater Gains
First-generation students, for whom neither parent has a college degree, often face unique challenges in higher education, including limited access to resources, financial barriers, and less guidance from family on navigating college. Generally, first-generation students are underrepresented in higher education and have lower college enrollment and completion rates compared to their peers (Choy 2001; Ishitani 2006; Pascarella et al. 2004; Stephens et al. 2012; Woosley and Shepler 2011).
When comparing those graduating in 2021–22 (the class of 2022) and those graduating in 2022–23 (the class of 2023), first-generation students experienced a larger increase in FAFSA completion (19%) than their peers (16%; Technical Appendix Table B9). Over the same period, first-generation students also saw a greater increase in college enrollment with a completed FAFSA (17%) than their peers (15%; Figure 7). These patterns suggest that, although historically underserved in higher education, first-generation students made greater gains in college enrollment and financial aid access following the policy change.
First-generation students showed a greater increase in college enrollment with a completed FAFSA
% increase in the number of students enrolled in college with a completed FAFSA from the class of 2022 to class of 2023

SOURCE: Authors’ calculations using CSAC data.
NOTES: Sample is restricted to high school seniors who submitted FAFSA in graduating cohorts of 2021–22 and 2022–23 in the CSAC data. Students are matched to NSC records, and those with college enrollment between July 1 of the high school graduation year and June 30 of the following year are counted as enrolled. FAFSA completion is measured by June 30 of the student’s high school graduation year. We define first-generation students as those for whom neither parent indicated having a college degree, based on information from the CSAC data. Figure is created using data from Technical Appendix Table B9.
Lower-Income Students Saw Large Improvements
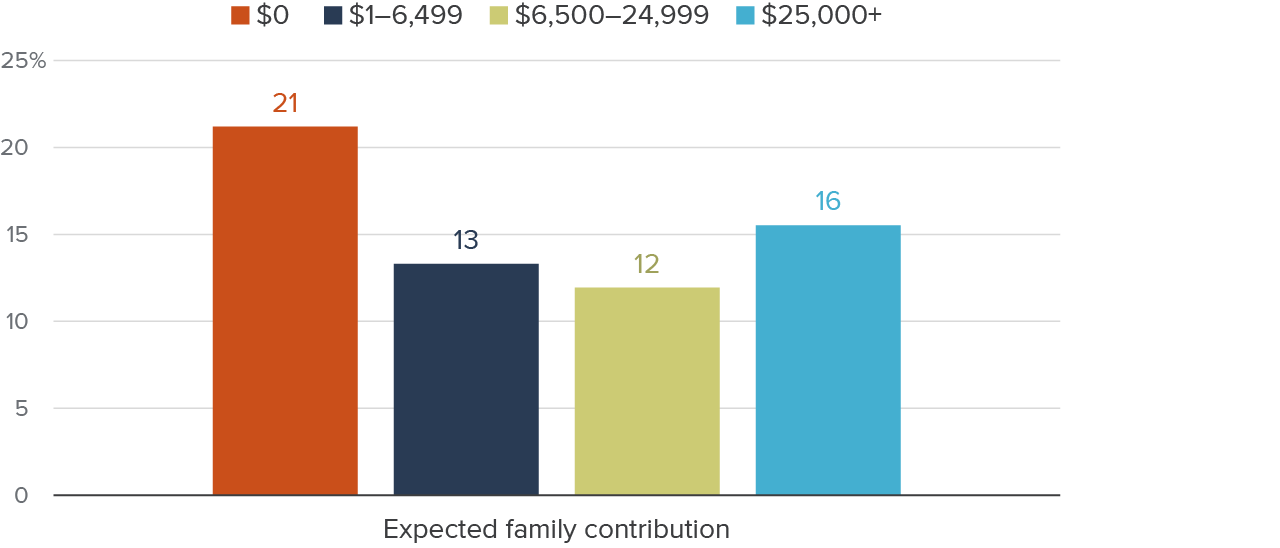
Previous research has shown that students from the lowest-income group experienced the largest gains in financial aid application submission after the policy (Cook, Jackson, and Gomez 2024). Our analysis confirms this trend. We use Expected Family Contribution (EFC) as a proxy for students’ financial need, with lower values reflecting lower-income backgrounds. EFC is a federal measure used to assess a student’s ability to pay for college based on factors like household income, family size, and assets. Students who have an EFC of zero are expected to have no resources from their families to contribute toward the cost of attendance, and we refer to this group as “students with the greatest financial need.”
Our data show that, after the first year of implementation, students with the greatest financial need saw the largest increase in FAFSA completion (23%) compared to other EFC groups (less than 20%; Technical Appendix Table B10). Students with the greatest financial need also showed a larger increase in college enrollment with a completed FAFSA (21%) than other groups (below 20%; Figure 8). These findings suggest that the policy may support upward mobility, as students from the lowest-income families showed the largest gains in college enrollment and financial aid access following the policy change.
Students with the greatest financial need showed a larger increase in college enrollment with a completed FAFSA
% increase in the number of students enrolled in college with a completed FAFSA from class of 2022 to class of 2023
SOURCE: Authors’ calculations using CSAC data.
NOTES: Sample is restricted to high school seniors who submitted FAFSA in graduating cohorts of 2021–22 and 2022–23 in the CSAC data. Students are matched to NSC records, and those with college enrollment between July 1 of the high school graduation year and June 30 of the following year are counted as enrolled. FAFSA completion is measured by June 30 of the student’s high school graduation year. The EFC (“Expected Family Contribution”) ranges were selected to align with key thresholds that correspond to eligibility for major federal and state financial aid programs: (1) Students in the $0 EFC group typically are fully Pell eligible and qualify for the maximum level of need-based aid; (2) Students in the $1–6,499 EFC range generally remain Pell eligible but may receive a reduced amount compared to the $0 EFC group; (3) Students in the $6,500–24,999 EFC range are generally not Pell eligible but may qualify for Cal Grants or other targeted aid such as Middle Class Scholarship; (4) Students in the $25,000+ EFC range typically do not qualify for need-based aid but may receive merit-based aid or other assistance. Figure is created using data from Technical Appendix Table B10.
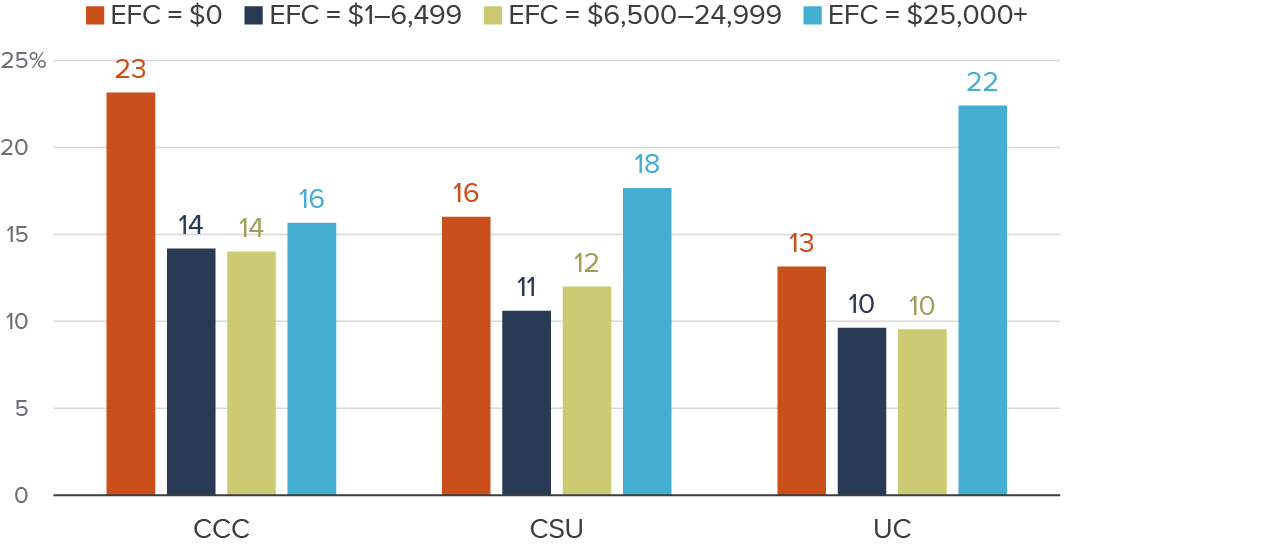
Focusing on students enrolled in in-state public institutions, we find that community college enrollees saw the largest gain in college enrollment with a completed FAFSA among students with the greatest financial need. From the class of 2022 to the class of 2023, the number of students with the greatest financial need enrolling in a California Community College (CCC) with a completed FAFSA increased by 23 percent, a higher rate than any other EFC groups enrolled in CCC (Figure 9). While students with the greatest financial need at CSU and UC also saw increases, the gains were more modest and more closely aligned with those of other EFC groups—and, in fact, lower than the increases observed among the highest-EFC group at these segments.
CCC enrollees saw the largest increase in FAFSA completion among students with the greatest financial need
% increase in the number of students enrolled in college with a completed FAFSA from the class of 2022 to class of 2023
SOURCE: Authors’ calculations using CSAC data.
NOTES: Sample is restricted to high school seniors who submitted FAFSA in graduating cohorts of 2021–22 and 2022–23 in the CSAC data. Students are matched to NSC records, and those with college enrollment between July 1 of the high school graduation year and June 30 of the following year are counted as enrolled. FAFSA completion is measured based on the CCC deadline of September 2 for enrollees at CCC and on the UC/CSU deadline of March 2 for enrollees at UC/CSU. The EFC (“Expected Family Contribution”) ranges were selected to align with key thresholds that correspond to eligibility for major federal and state financial aid programs: (1) Students in the $0 EFC group typically are fully Pell eligible and qualify for the maximum level of need-based aid; (2) Students in the $1–6,499 EFC range generally remain Pell eligible but may receive a reduced amount compared to the $0 EFC group; (3) Students in the $6,500–24,999 EFC range are generally not Pell eligible but may qualify for Cal Grants or other targeted aid such as Middle Class Scholarship; (4) Students in the $25,000+ EFC range typically do not qualify for need-based aid but may receive merit-based aid or other assistance. Figure is created using data from Technical Appendix Table B10.
In addition to analyzing student-level EFC data among FAFSA applicants, we also examined trends among all high school seniors in our data by school characteristics, using the share of students eligible for free or reduced-price meals (FRPM) as a proxy for economic disadvantage. When comparing the class of 2022 and the class of 2023, we find that students from schools where more than half of students were eligible for FRPM saw an increase in the college-going rate of over 3 percentage points (Figure 10). In contrast, students from schools with fewer than 50 percent FRPM eligibility saw an increase of about 2 percentage points. These trends are consistent with our earlier findings, indicating that students from lower-income backgrounds experienced greater gains in college enrollment following implementation.
Students from schools with higher shares of low-income students saw greater gains in college enrollment
Increase in college-going rate from the class of 2022 to class of 2023 (% pts)
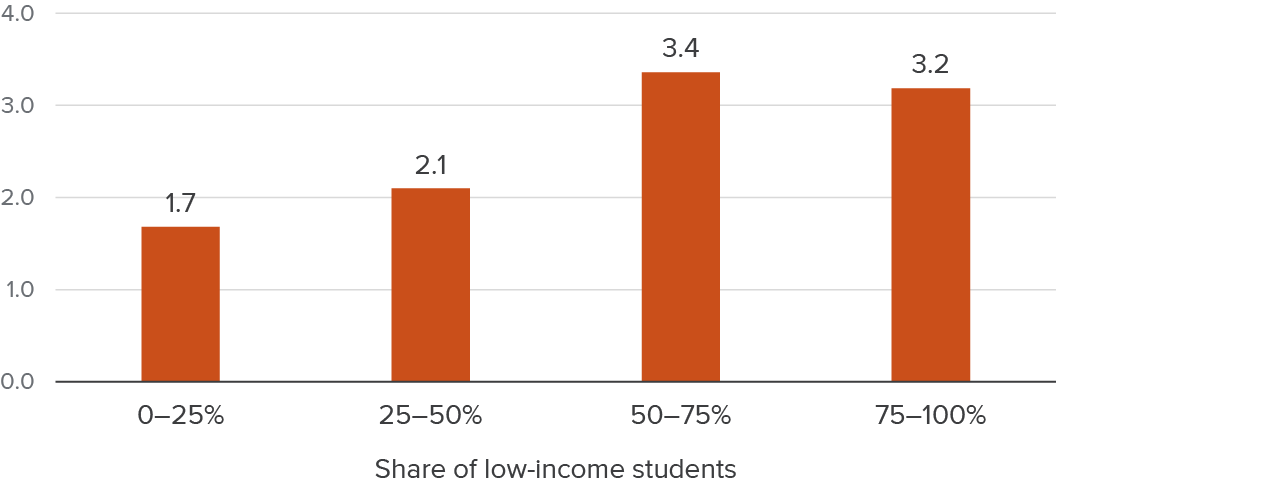
SOURCE: Authors’ calculations using CSAC data.
NOTES: Sample is restricted to high school seniors in graduating cohorts of 2021–22 and 2022–23 in the CSAC data. Students are matched to NSC records, and those with college enrollment between July 1 of the high school graduation year and June 30 of the following year are counted as enrolled. Data are reshaped to the high school level, and only high schools with more than 10 total enrollments are included in the figure. The school-level share of low-income students (those eligible for free or reduced-price meals, or FRPM) is obtained from CDE data. Figure is created using data from Technical Appendix Table B11.
Students from Schools with Large Underserved Racial/Ethnic Groups Benefited
Our findings showed that students from schools with high shares of underserved racial/ethnic groups (Black, Latino, Native American, and Pacific Islander students) had strong gains in FAFSA completion and college enrollment after the policy. Students from schools with the highest share of these student groups saw a large increase in FAFSA completion from the class of 2022 to the class of 2023. The number of students from these schools completing a FAFSA rose by 18 percent, exceeding or similar to that of students from schools with lower shares of these underserved groups (Technical Appendix Table B12). In terms of college enrollment with a completed FAFSA, students from these schools also experienced a strong increase (16%), though the growth was the largest in schools with the lowest share of these student groups (19%; Figure 11).
The discrepancy reflects that college enrollment depends on more than FAFSA completion, with many other factors potentially playing a role, such as exposure to a college-going culture, school resources, broader regional economic conditions, and access to family members, counselors, or social networks who share college knowledge and encouragement (Engberg and Wolniak 2010; Mulhern 2023; Johnson et al. 2024, 2025).
Students from schools with larger underserved racial/ethnic groups saw notable gains in college enrollment with a completed FAFSA
% increase in the number of students enrolled in college with a completed FAFSA from the class of 2022 to class of 2023
SOURCE: Authors’ calculations using CSAC data.
NOTES: Sample is restricted to high school seniors in graduating cohorts of 2021–22 and 2022–23 in the CSAC data. Students are matched to NSC records, and those with college enrollment between July 1 of the high school graduation year and June 30 of the following year are counted as enrolled. FAFSA completion is measured by June 30 of the student’s high school graduation year. Data are reshaped to the high school level, and only high schools with more than 10 total enrollments are included in the figure. School-level enrollments by race/ethnicity are obtained from CDE data, and students who are Black, Latino, American Indian or Alaska Native, and Pacific Islander are included as underserved racial/ethnic populations. Figure is created using data from Technical Appendix Table B12.
Students from schools where more than half of students were from underserved racial/ethnic groups saw an increase of over 3 percentage points in the college-going rate (Figure 12). In comparison, students from schools with fewer than half of students from underserved racial/ethnic groups experienced an increase of less than 2.5 percentage points. Since students from these racial/ethnic groups have been historically underserved in higher education, these trends suggest that the policy may be helping to improve college attendance and access to financial aid.
Students from schools with higher shares of students from underserved racial/ethnic groups showed greater gains in college enrollment
Increase in college-going rate from the class of 2022 to class of 2023 (% pts)
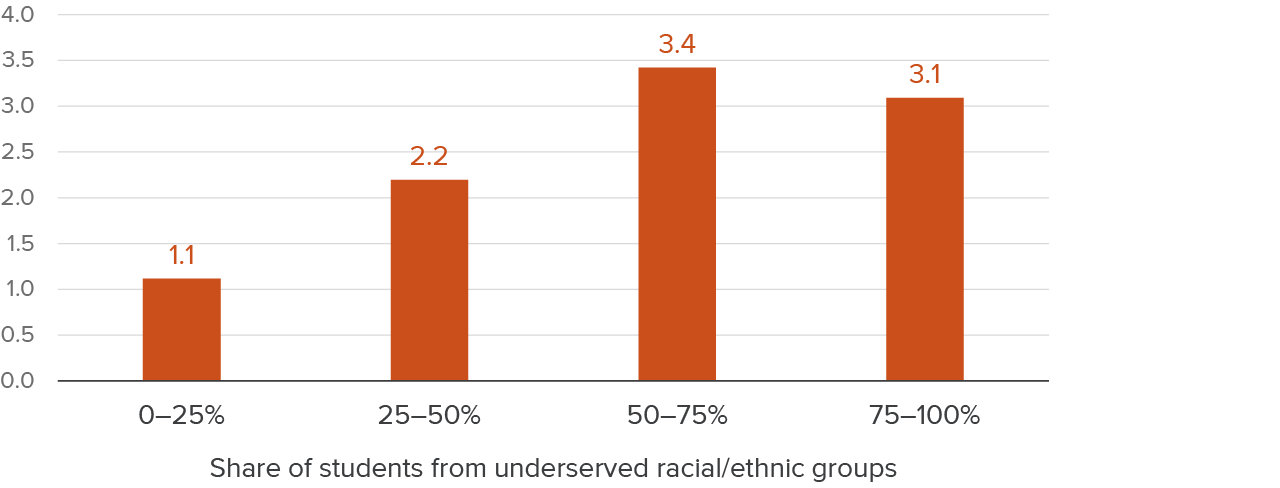
SOURCE: Authors’ calculations using CSAC data.
NOTES: Sample is restricted to high school seniors in graduating cohorts of 2021–22 and 2022–23 in the CSAC data. Students are matched to NSC records, and those with college enrollment between July 1 of the high school graduation year and June 30 of the following year are counted as enrolled. Data are reshaped to the high school level, and only high schools with more than 10 total enrollments are included in the figure. School-level enrollments by race/ethnicity are obtained from CDE data. Figure is created using data from Technical Appendix Table B12.
College Choice and Aid Access by Institutional Sector
In this section, we examine if students’ college choices have changed following greater student access to financial aid applications. We also explore changes in access to financial aid across sectors of higher education in California.
College Choice Remained Mostly Unchanged
We find that, overall, college choice patterns remained relatively stable in the first year of implementation, with most students continuing to enroll in California’s public higher education systems (see Technical Appendix Table B6). However, when combining the shares of students enrolling in CCC, CSU, and UC, we observe a small but notable increase—from 91 percent to 93 percent—in the proportion of students attending these in-state public institutions. This modest shift suggests a growing preference for in-state public options, potentially driven by more favorable financial aid packages, lower overall costs, or increased awareness of affordability at these institutions.
One possible factor explaining the limited change in students’ college choices when it comes to the state’s public higher education institutions is eligibility and academic preparation. For example, the median GPA for Cal Grant recipients at the community college system is 2.96, which is below the 3.0 GPA cutoff for freshmen admissions eligibility to UC, and many of these recipients are also below the 2.5 GPA cutoff for CSU (see Technical Appendix Figure B4). Other non-financial barriers to enrolling directly in a four-year college include physical distance from a university campus, lack of access to social capital (e.g., parents or counselors who provide guidance on college pathways), difficulty navigating the application process, limited exposure to a college-going culture, and broader regional economic conditions.
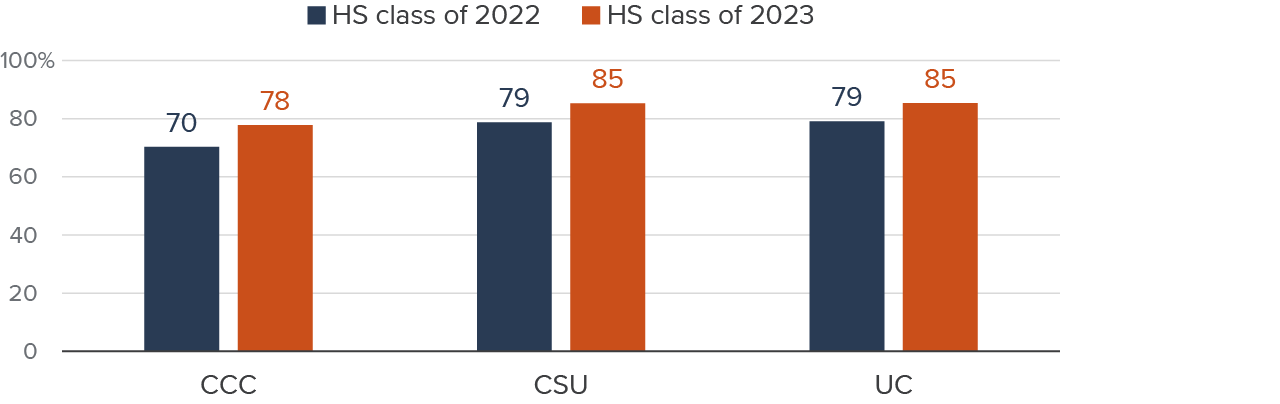
Community Colleges’ FAFSA Completion Rate Increased the Most
When we look at students who enrolled in in-state public institutions after high school graduation, we find that, although FAFSA completion rates rose across the systems, the most substantial increase occurred at CCC. The FAFSA completion rate at the community colleges rose by 8 percentage points, from 70 percent among the high school class of 2022 to 78 percent among the high school class of 2023. In comparison, both CSU and UC systems saw increases of 6 percentage points, with FAFSA completion rates rising from 79 percent to 85 percent (Figure 13). Despite CCC showing the largest increase, its FAFSA completion rate still lags behind those of CSU and UC. This ongoing gap highlights the need for targeted efforts to support FAFSA completion for students entering community colleges.
CCC saw a larger increase in FAFSA completion among enrollees, but its rate lags behind UC and CSU
Share of college enrollees with a completed FAFSA
SOURCE: Authors’ calculations using CSAC data.
NOTES: Sample is restricted to high school seniors in graduating cohorts of 2021–22 and 2022–23 who enrolled in CCC, CSU, or UC in the matched CSAC-NSC data. Students with college enrollment between July 1 of the high school graduation year and June 30 of the following year are counted as enrolled. FAFSA completion is measured based on the CCC deadline of September 2 for enrollees at CCC and on the UC/CSU deadline of March 2 for enrollees at UC/CSU. Figure is created using data from Technical Appendix Table B8.
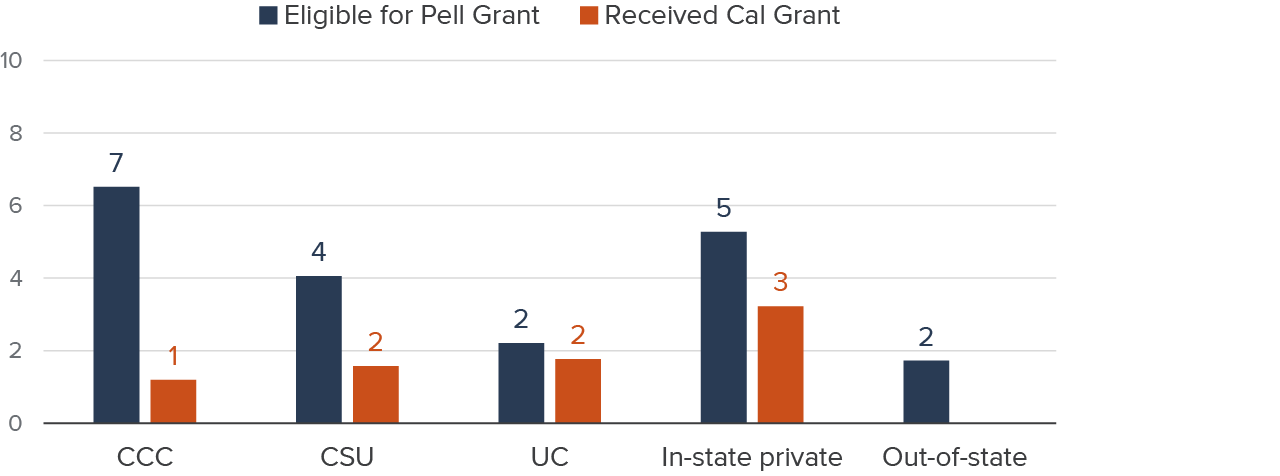
Across college enrollees in all sectors of higher education, access to aid improved as the policy helped ensure that a greater number of college enrollees completed the FAFSA and could be considered for aid. Between the class of 2022 and the class of 2023, the share of college enrollees who were eligible for the Pell Grant increased by 2 to 7 percentage points across the higher education systems. Similarly, the share of college enrollees receiving Cal Grants rose by 1 to 3 percentage points across all in-state higher education systems (Figure 14). These across-the-board gains underscore the broad reach of the policy.
College enrollees were more likely to be Pell-eligible and/or receive a Cal Grant across sectors
Change in share of college enrollees from HS class of 2022 to class of 2023 (% pts)
SOURCE: Authors’ calculations using CSAC data.
NOTES: Sample is restricted to high school seniors in graduating cohorts of 2021–22 and 2022–23 who enrolled in college in the matched CSAC-NSC data. Students with college enrollment between July 1 of the high school graduation year and June 30 of the following year are counted as enrolled. Figure is created using data from Technical Appendix Table B7.
Conclusion and Recommendations
Our findings suggest that California’s universal financial aid application policy is a promising strategy for increasing both college enrollment and financial aid uptake. The policy contributed to a modest rise in the overall college-going rate and was associated with a clear improvement in aid access across student groups and higher education systems. Notably, large gains occurred among historically underserved student groups, such as first-generation students, low-income students, and those from schools with high shares of underrepresented racial/ethnic groups, including African Americans and Latinos. These findings indicate that the policy has the potential to narrow gaps in college access and affordability across student groups.
While students’ college choices remained largely stable, there was a small shift toward choosing in-state public institutions. Among these students, community college enrollees had the largest increase in FAFSA completion, though the rate remained lower than at CSU and UC. These patterns highlight both positive changes following the policy and the continued need to support FAFSA completion, especially at institutions like community colleges that serve a high share of traditionally underrepresented students.
Informed by our research, we offer the following recommendations:
Strengthen and expand policies to encourage completion of financial aid applications for all students. Although FAFSA completions in California have increased, a significant share of students (about 30%) still lack key information for making decisions about the cost of college or the aid they qualify for because they are not completing a FAFSA or CADAA. In particular, the FAFSA completion rate for community college enrollees, who are often low-income or from other underserved student groups, remains below that of UC and CSU. Continued efforts are needed to strengthen and expand policies that support application completion, with the goal of reaching broader coverage among students who wish to go to college.
Students face a range of challenges when it comes to completing financial aid forms—such as limited access to information or technical assistance, concerns about data privacy, or uncertainty about eligibility. As the policy environment continues to evolve, these challenges may affect student groups differently. Targeted strategies to understand and address the specific barriers faced by different students will be essential to make sure that every student has the opportunity to access the financial resources needed to make informed decisions about postsecondary education. For example, investments in expanding outreach for programs like California Student Opportunity and Access (CalSOAP), which is intended to support low-income students and their families as they navigate the financial aid and college application process, could provide more targeted support services to key student populations. Important gains may also be possible by integrating FAFSA/CADAA completion into the programming that occurs through major state investments in college and career readiness—including the Golden State Pathways Program (GSPP) and College and Career Access Pathways (CCAP)—which also focus on supporting underserved students. The state could also invest in expanding access to college advisers at the high school level. Current caseloads for college advisers in California high schools are about double the suggested load number of 250 students to 1 adviser (Cook, Jackson, and Gomez 2024).
Formalize a linked data system to inform policy. The state’s Cradle to Career (C2C) data system presents a critical opportunity to build a linked data system that connects high school, college, and financial aid information with other key aspects of students’ educational trajectories. A coordinated system would reduce the need for repetitive data matching, lower administrative and research costs, and improve the state’s ability to track long-term trends and evaluate the impact of policies like the universal financial aid application requirement. Importantly, such a system could also provide timely, actionable data to schools, enabling them to better monitor students’ FAFSA completion, eligibility for safety net benefits such as CalFresh and Medi-Cal (which could help further reduce students’ college costs), and subsequent college outcomes.
In the short term, the state could develop public-facing dashboards that connect data on students’ educational paths to help students, schools, and policymakers make more informed decisions. In the longer term, expanding secure data access for researchers and practitioners would support deeper analysis to inform policy and improve outcomes. This work could be advanced by the C2C office in collaboration with researchers, institutions, and state agencies. By fully integrating financial aid, K–12, and postsecondary data, California can strengthen decision-making at every level and support more effective interventions that help narrow gaps in educational outcomes across student groups.
Complement financial aid efforts by addressing non-financial barriers to college enrollment. California’s policy has contributed to increased college enrollment by helping to alleviate students’ financial concerns. However, financial support alone is not enough to ensure that all students who want to attend college can successfully make the transition. Many students continue to face non-financial barriers that can hinder their path to postsecondary education, such as living far away from a four-year college, inadequate academic preparation, lack of access to college counseling, lack of familiarity with the enrollment process, or competing family responsibilities. Strengthening academic advising, expanding college and career counseling, and providing guidance throughout the college application and enrollment process can help more students navigate the path to college and take full advantage of the financial aid available to them. This would require increased investment and coordination among school districts, the California Student Aid Commission, and colleges and universities.
California’s universal financial aid application policy has been an important step to ensure that more students have access to financial aid that can reduce the cost of college. Key areas of future study include examining how many students use the aid they are eligible for and identifying the barriers students face accessing aid. In addition, more study is necessary to determine the role of financial aid in helping students achieve their higher education goals and the kinds of supports students need to overcome obstacles to long-term success. Looking ahead, future research to examine longer-term outcomes, including college persistence, transfer, and degree attainment across sectors, regions, and institutional characteristics such as location and level of selectivity, will be essential to helping more students succeed in college.
Topics
Access Affordability Equity Higher Education K–12 Education Poverty & InequalityLearn More

College Affordability in California

New Policy Improves Student Access to College and Financial Aid

California Increases Financial Aid Application Rate

Implementing California’s Universal Financial Aid Application Policy
