Table of Contents
- Key Takeaways
- Introduction
- Employment Was Low among California’s Released Prisoners
- What Kind of Work Did California’s Released Prisoners Do?
- How Much Did Released Prisoners Earn?
- Who Succeeds and Who Struggles after Prison?
- Policy Discussion and Conclusion
- Notes and References
- Authors and Acknowledgments
- PPIC Board of Directors
- Copyright
Key Takeaways
Policymakers have long sought to promote employment among released prisoners through policies and programs that reduce incarceration and broaden access to the labor market. This descriptive report provides previously unavailable information about employment before, during, and after incarceration for about 170,000 people released from California Department of Corrections and Rehabilitation (CDCR) prisons between 2015 and 2019, with the aim of highlighting opportunities for improvement.
- Nearly half of formerly imprisoned people never had a job outside prison. One-quarter of people had no record of working—before, during, or after prison. Four in ten held a job before prison, and 44 percent were employed afterward. By contrast, 52 percent held a prison job. Pretrial and post-sentencing incarceration explain why many in the release cohort did not have jobs outside prison. →
- Inside and outside prison, jobs were low skill, low wage, and short term. Before prison, one-third worked temp jobs; after prison, 42 percent did. Most prison jobs involved unskilled labor, lasted about a month, and supported prison operations, such as cleaning and food services. California prisoners earned 40 percent less than the national average, and 32 percent of prison jobs were unpaid—though workers could be compensated in other ways. →
- People rarely earned above the poverty threshold—before or after prison. Before prison, just 28 percent of working people had earnings above the poverty threshold ($20,200 in 2023) in at least one year. After prison, that share grew to 45 percent. While pre-prison employment-rate disparities narrowed after prison, earnings disparities persisted: men earned 20 percent more than women, and Black people earned 38 percent less than white people, on average. →
- People who worked before or during their time in prison were more likely to work after release. People who worked before prison were 9 times more likely to have a job afterward; each quarter of pre-prison employment was associated with a 42 percent increase. People who held prison jobs (compared to those who did not) were 9 percent more likely to work after release, and holding a prison job for two to six months made post-prison work 11 percent more likely. →
- Participants in some prison programs were more likely to be employed after prison. Participants in prison-based college courses, vocational trades, and substance-use disorder treatment were more likely than nonparticipants to have jobs after release. Participants in primary and secondary education, computer technology, and criminal thinking courses were equally likely as nonparticipants to hold jobs after prison. →
The findings point to several policy levers that could help promote employment among released prisoners, including rigorously evaluating prison programs, building people’s capacity for working consistently by lengthening their job tenures in prison, and exploring innovative ways to promote employment and keep people out of prison and jail while ensuring public safety.
Introduction
For the tens of thousands of people released from California prisons each year, the ability to find work can affect whether people engage in criminal behavior after release (Holzer 2007; Raphael 2011). Yet the degree to which California’s released prisoners work, how much they earn, and in which fields has not been comprehensively examined. Consequently, improving their post-prison economic security remains a challenge.
Prior research has mainly focused on the relationships between imprisonment, work, and recidivism (e.g., Sabol 2007; Pettit and Lyons 2009; Loeffler 2013; Harding et al. 2018). Studies that incorporate the pre-prison period are comparatively rare (e.g., Loeffler 2018; Harris and Harding 2019; Kolbeck, Lopez, and Bellair 2024). With a few exceptions, time spent in prison is treated as a black box (Nagin, Cullen, and Jonson 2009).
Prior research conducted in Minnesota constitutes an exception through which researchers found that participation in most prison programs improved post-prison employment outcomes, and that spending a larger share of time served participating in prison programs or working prison jobs was associated with small increases in employment after prison (Duwe and Clark 2017; Duwe, Clark, and McNeely 2025). This report builds on their work—and prior PPIC research on prisoners’ program participation—to draw a more complete picture of employment before, after, and during prison for California’s released prisoners.
Drawing a more complete picture requires understanding California’s policy context as it pertains to prisoners. In recent years, prisoners’ work and pay have come to the fore. Policies that have affected the size and composition of the prison population (and, thereby, competition for prison workers) may have directed attention to prison work, how it is compensated, and how it relates to outside work.
In particular, Proposition 47 reduced the state’s prison population by 7,700 people between November 2014 and September 2015, primarily by decreasing the chance that nonviolent offenders would be sentenced to prison (Lofstrom and Martin 2015; Harris and Cremin 2024). These changes sparked concerns about whether the camp firefighter program could continue to support the maintenance of public lands and led to changes in qualifications for firefighting positions (Vives 2024; San Diego County 2014; Technical Appendix Figure A5).
Legislation enacted shortly thereafter in 2020 has allowed camp firefighters to apply to have their records expunged so they can work as firefighters after prison, and subsequent laws intended to facilitate that process and increase camp firefighter pay were enacted in 2025 (Riggins 2020; Brennan 2025; Mihalovich 2025). In 2024, a change in regulations led to updates in prisoner pay scales for the first time in more than three decades, doubling pay rates for all working prisoners.
However, California’s voters rejected Proposition 6, a 2024 ballot measure that would have ended mandatory work in state prisons. Imprisoned people in California can still be compelled to work, and if they refuse or perform poorly, they can face penalties that include loss of pay and serving more time through revocation of good conduct credits (PC Section 2933). Perhaps as a result, people are most likely to work during prison.
This report focuses on key aspects of employment among Californians with prison histories: employment rates and why they are low in California, the kinds of work people do, earnings, including variation by geography and demography, and the factors influencing whether people work after prison. The concluding section outlines key policy levers that could improve employment rates among formerly imprisoned Californians.
Employment Was Low among California’s Released Prisoners
How much people work inside and outside prison depends on personal characteristics and local conditions. People who end up in prison typically have personal challenges that create barriers to employment, including low educational achievement, complex physical and behavioral health problems and disabilities, and persistent contact with the criminal justice system (Harris et al. 2024; Bushway et al. 2007). Local conditions can expand or limit employment opportunities. When competition for workers intensifies, employers may be more willing to hire people with personal challenges, whereas employment opportunities for such workers may become scarcer where and when unemployment is high (Sabol 2007).
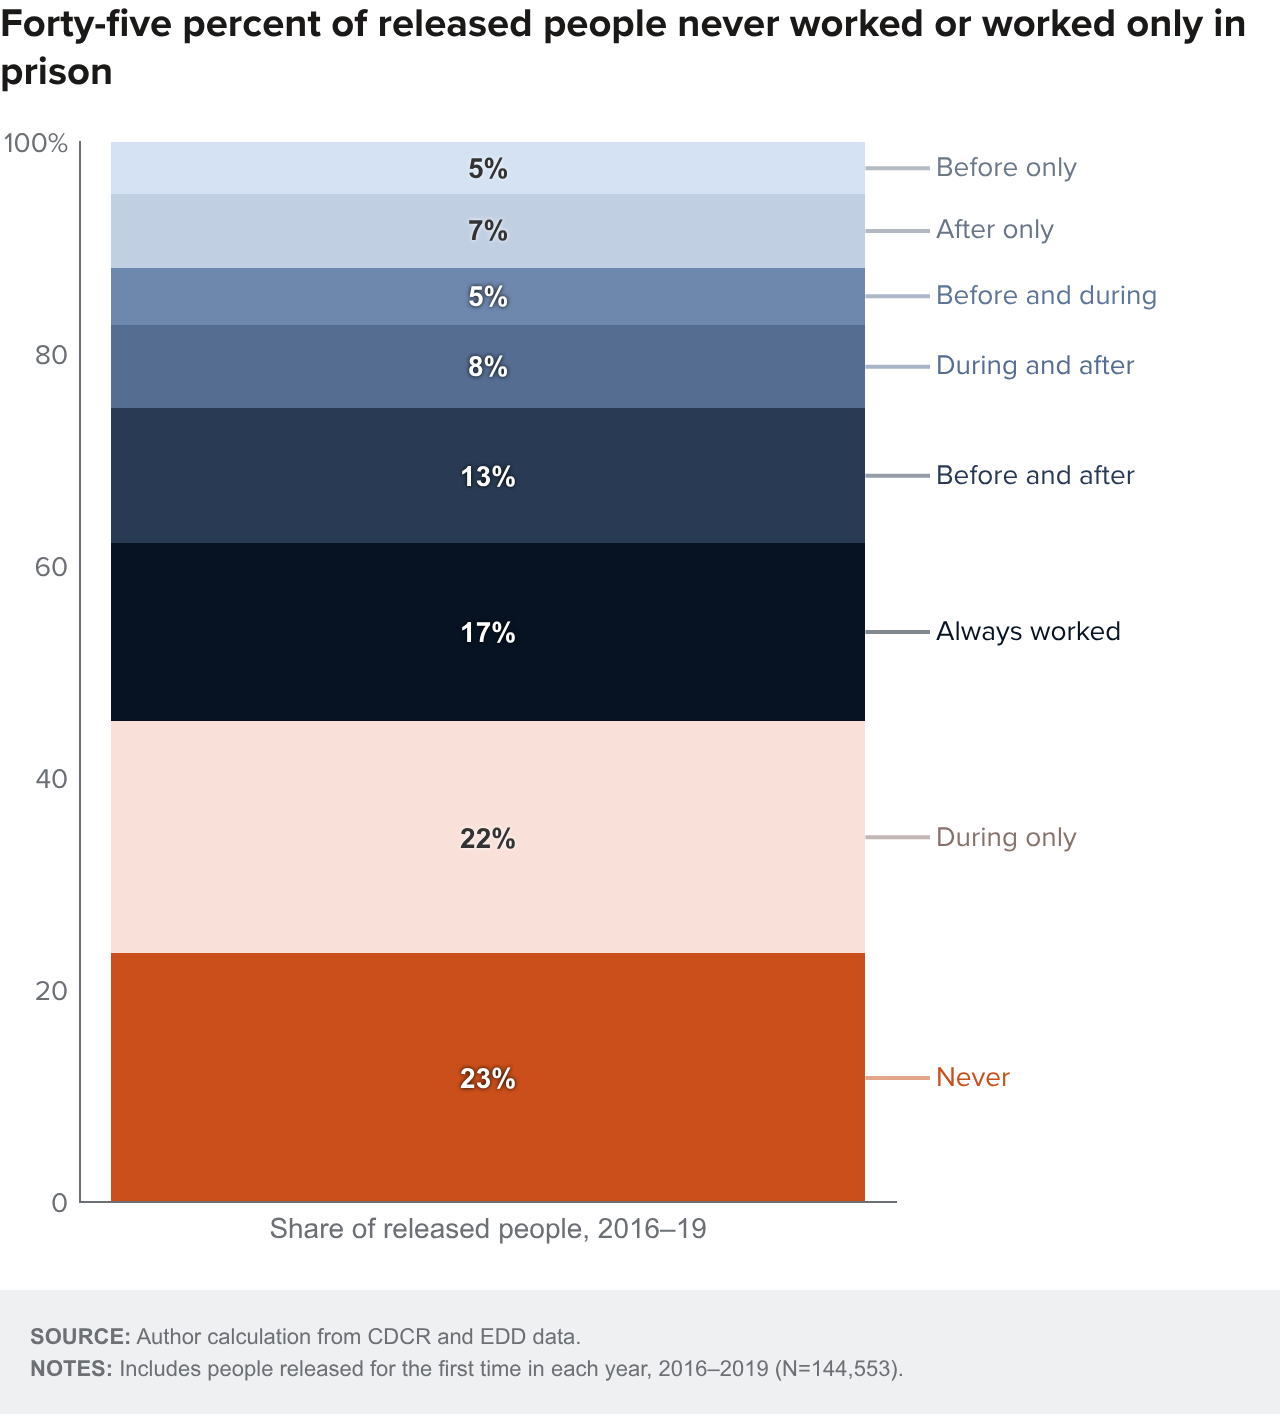
Among the population released between 2016 and 2019, 17 percent held a job in each period—the four years before prison, the last year during imprisonment, and the four years after prison (Figure 1). By contrast, 23 percent did not hold a formal job in any period and 22 percent held only a prison work assignment. Of the remaining people who worked outside prison, 13 percent had formal jobs before and after prison, and 15 percent either had jobs during and after or just after prison. Only 10 percent had jobs before and during or only before they went to prison.
Moreover, most people did not have jobs in any quarter before, during, or after prison. Figure 2 maps quarterly employment rates for all people released from California state prisons between 2016 and 2019 in the sixteen quarters before they entered prison, the four quarters before their release from prison, and sixteen quarters after their release. Employment rates are well below 50 percent in all three periods.
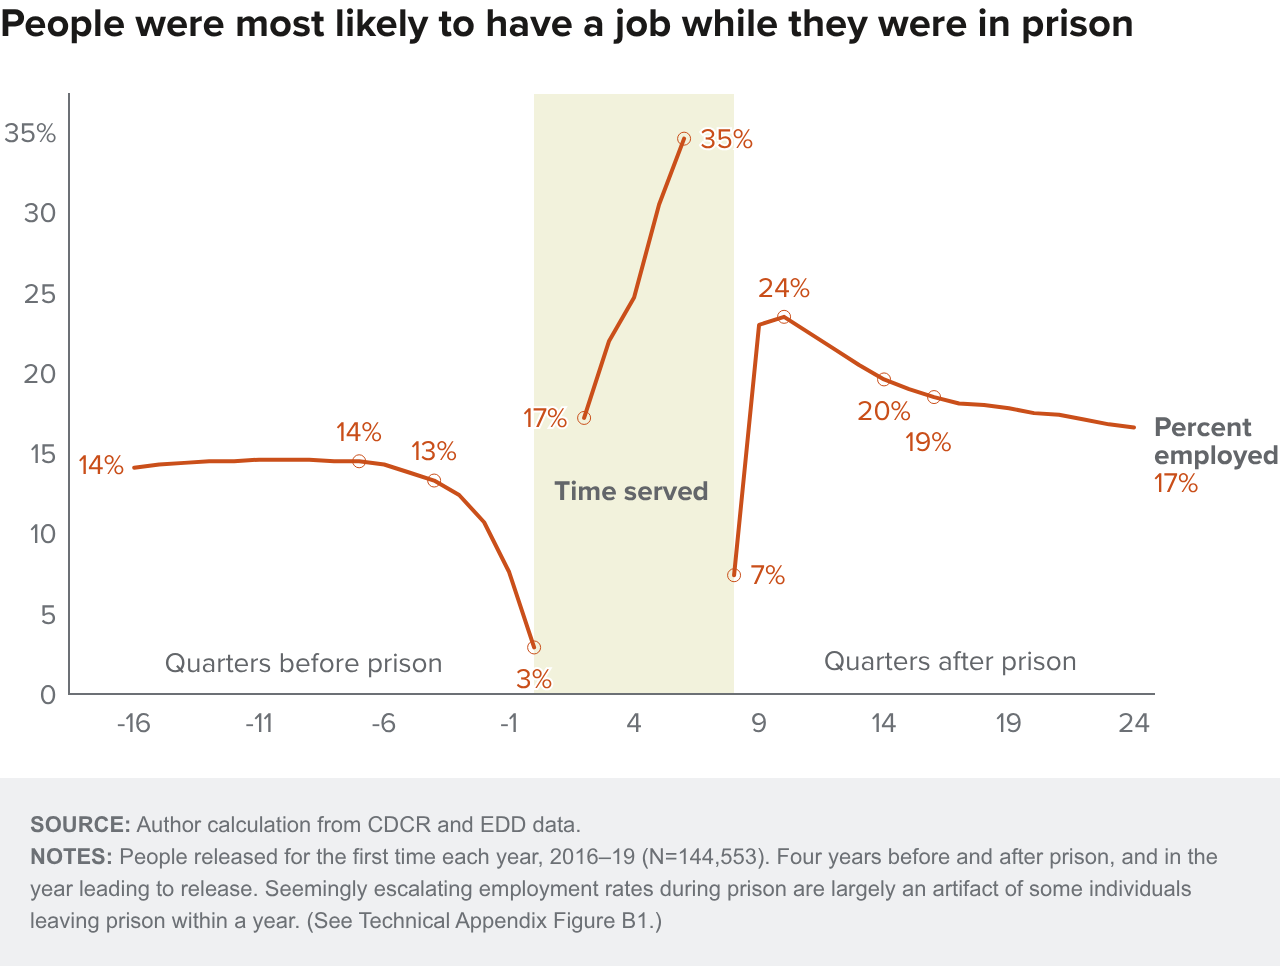
People were least likely to work before they went to prison: at most, 15 percent of people released between 2016 and 2019 worked in any pre-prison quarter. Across the four pre-prison years, 40 percent of people held a job for at least one quarter. Less than one in four people were employed annually before prison.
People were most likely to work in prison. Among people released from California prisons between 2016 and 2019, 52 percent held at least one work assignment in the year leading to their release, and 31 percent of people held a job in the quarter before release. Moreover, employment rates rose as release dates approached. In contrast to employment rates on the outside, which were lowest in the quarters people entered (3%) and left (7%) prison, in-prison employment rates were highest—35 percent—in the quarter people were released.
People were more likely to work after prison than they were before, but only in the short term. Quarterly post-prison employment rates peaked in the second quarter after release at 24 percent. Thereafter, they tapered off, falling to under 17 percent—just 2 percentage points above the pre-prison peak—in the fourth post-prison year. Forty-four percent of those released found work in at least one quarter after they were released from prison, and the annual post-prison employment rate peaked at 34 percent in the first year after prison. As described below, pretrial and post-sentencing incarceration contributed to low employment before and after prison.
Employment among Released Prisoners Varied across the State
Whether released prisoners worked varied across the state in ways that reflect local economic conditions. Unemployment rates in 2023 varied regionally from about 3 percent in some Bay Area counties to about 10 percent in several Central Valley counties (Technical Appendix Table A2). Whether people held jobs before and after prison also varied widely across the state (Technical Appendix Figure B2).
Pre-prison employment rates varied from a low of 10 percent for people living in San Francisco and Humboldt Counties to about 19 percent in Monterey, San Benito, and San Luis Obispo Counties. After prison, employment rates increased in all but two counties: San Luis Obispo and Imperial. People returning to Imperial (13%), Humboldt (15%), and Los Angeles (16%) Counties were least likely to be employed. By contrast, people returning to San Francisco (30%), Marin (27%), and Yolo (25%) Counties were most likely to be employed (Technical Appendix Figure B2).
Post-Prison Employment Gains Eliminated Some Pre-Prison Disparities
Employment rates were higher after prison across nearly all demographic groups. Pre-prison employment rate disparities by gender and race mirrored those in the overall state workforce (Thorman and Cremin 2025). Men in the released prisoner population were more likely to be employed than women (40% versus 34%) and Native American and Black people were 6 to 7 percentage points less likely to be employed before prison than white and Asian American people (Figure 3).
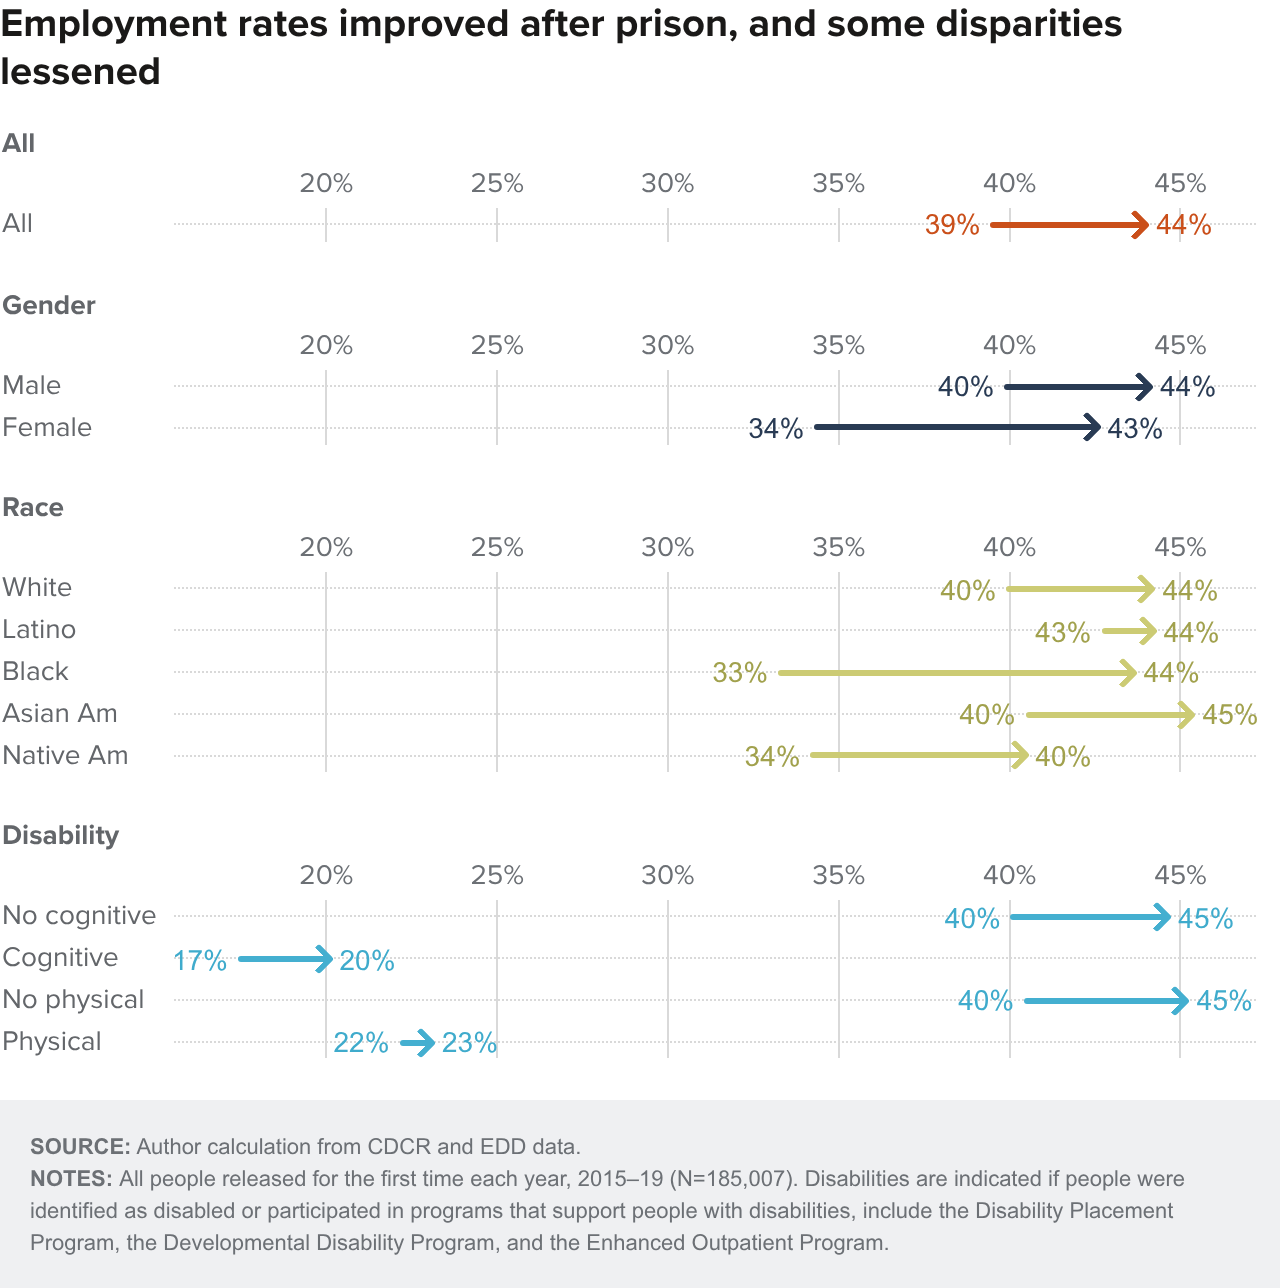
After prison, disparities in employment rates narrowed dramatically or disappeared for women and most racial groups. The 7 percentage point pre-prison difference between rates of employment for men and women fell to just 1 percentage point after prison. Similarly, the 7 percentage point gap between employment rates of Black and white people closed completely.
However, released prisoners with disabilities continued to experience challenges. In general, people with cognitive and physical disabilities face hurdles in the labor market that lead to lower employment rates, lower earnings, and higher levels of self-employment (Ananian and Dellaferrera 2024). For example, people who disclose their disabilities on job applications are 25 percent less likely to receive callbacks than those who do not (Bellemare et al. 2023).
At least 15,000 people released from prison between 2015 and 2019 had disabilities. CDCR’s Developmental Disability Program (DDP) and Enhanced Outpatient Program (EOP) identified or served nearly 5,000 people with cognitive disabilities, which include learning disabilities and some mental health conditions. Similarly, the Disability Placement Program (DPP) identified or served nearly 10,000 people with physical disabilities, which include those related to mobility, vision, speech, hearing, and need for dialysis.
Like people without disabilities, those with disabilities were more likely to be employed after prison than before prison, as shown in Figure 3. Yet already-large gaps between the employment rates of people with and without disabilities widened. The disparity in employment rates between those without and those with cognitive disabilities widened from 23 to 25 percentage points. Similarly, the difference between employment rates of people without and without physical disabilities widened from 18 to 22 percentage points.
The Pandemic Temporarily Depressed Post-Prison Employment Rates
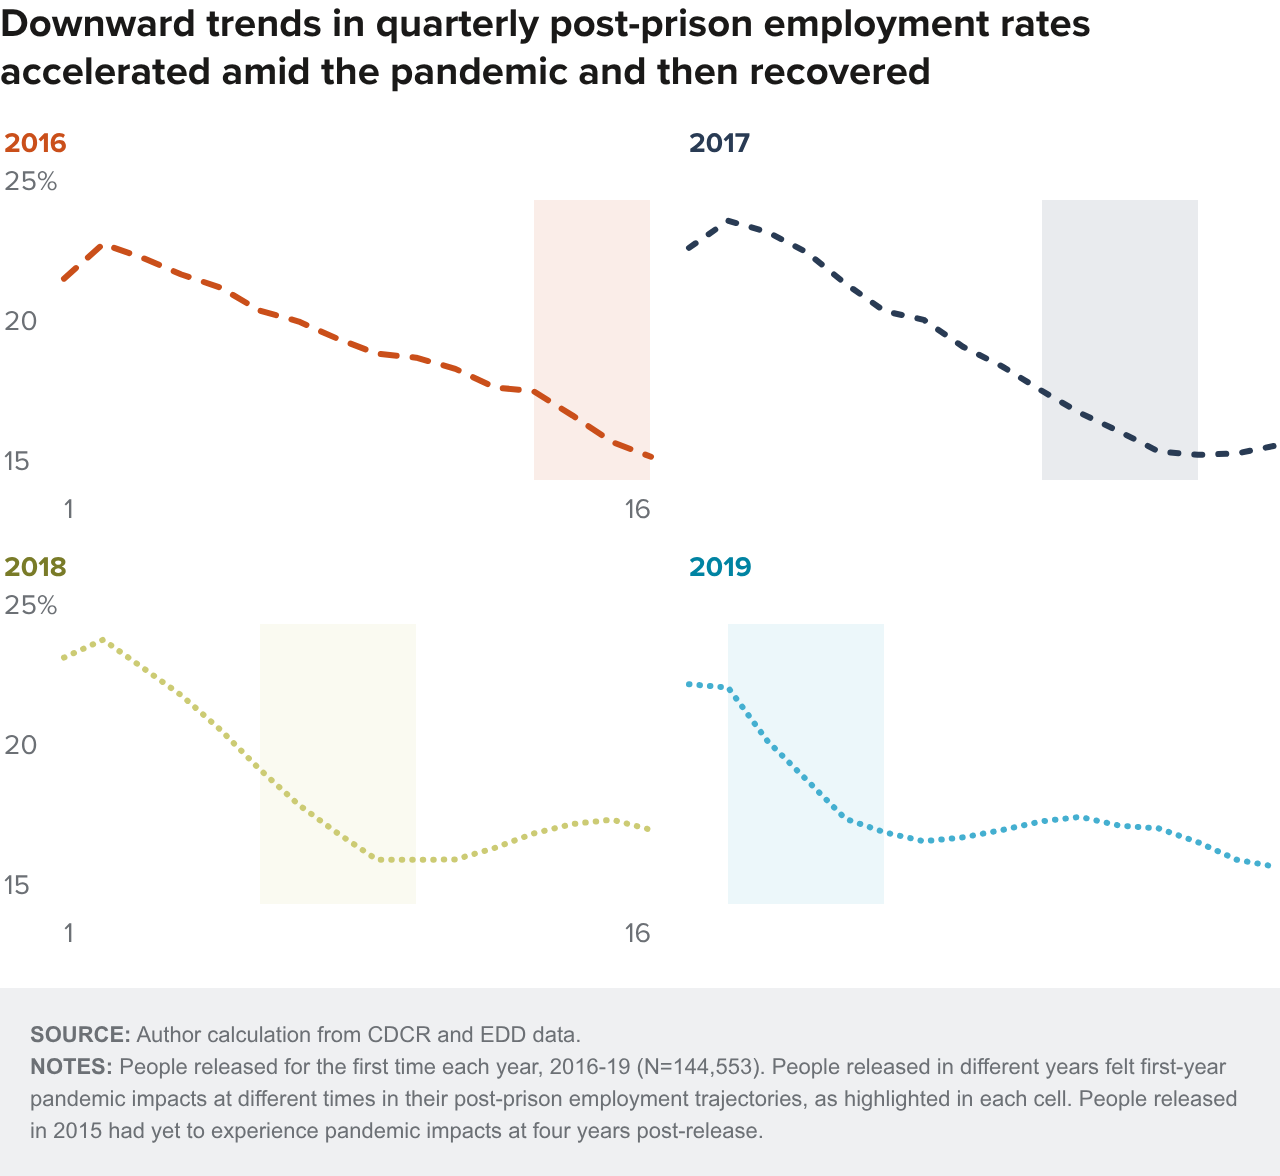
Consideration of the impact of the pandemic on post-prison employment is warranted, given that post-prison periods for most of the people released between 2015 and 2019 intersected with the pandemic (Figure 4).
People released in 2018 and 2019 experienced sharper and earlier declines in quarterly employment than those released in 2016 and 2017. These early pandemic impacts were temporary. Just as people in the state workforce regained lost ground, people released in these later years found employment. Pandemic lows that were within 1 percentage point of pre-pandemic nadirs reinforce the conclusion that pandemic impacts were temporary. But just how low were employment rates among Californians with prison histories?
Why Was Employment Lower in California than Elsewhere?
Compared to rates reported in studies of prisoners elsewhere, California’s released prisoners were employed at exceptionally low rates before they went to prison. These prior studies found that between 25 and 50 percent of people were employed in any pre-prison quarter (Pettit and Lyons 2009; Sabol 2007; Duwe and Clark 2017; Loeffler 2013). By contrast, pre-prison quarterly employment rates in California peaked just below 15 percent, even though 40 percent of people were employed at some point in the four years before going to prison.
Post-prison employment rates among California’s released prisoners were at the low end of the quarterly rates observed elsewhere, which ranged from 20 percent to 50 percent (Sabol 2007; Duwe and Clark 2017). But statewide trends in post-prison employment mirrored those found elsewhere, with employment rates peaking at levels above pre-prison rates shortly after release and then trailing off to near pre-prison levels thereafter (Duwe and Clark 2017).
Incarceration before and after sentencing explains why some people do not work
Incarceration associated with ongoing criminal behavior helps to explain why some people do not work, and why employment rates are lower among people released from prison in California compared to released prisoners elsewhere. People can be incarcerated before they are convicted of a crime via a policy called pretrial detention. People who are convicted may be sentenced to jail or prison time. People sentenced to jail or prison time in California typically “expect to serve” about half of their sentences (Technical Appendix Table B1).
California’s comparatively high bail and pretrial detention rates likely contribute to lower employment rates before and after prison. Prior PPIC research found that California’s bail rates were five times higher than the national average (Tafoya 2013). Half of people booked on misdemeanors and 70 percent booked on felonies were held in jail while their charges were resolved (Tafoya, Bird, Grattet, and Nguyen 2017).
As described in the textbox “Defining employment rates and estimating incarceration,” California does not collect and maintain statewide data that tracks the time people spend in jail during the pretrial period or after sentencing. Yet the potential impact of incarceration—including pretrial and post-sentence incarceration—can be estimated using the DOJ ACHS data, as shown in Figure 5, which depicts total estimated incarceration time associated with all arrests that led to convictions in each year before and after prison.
Figure 5 shows the estimated degree to which incarceration can explain low employment rates before prison for people in a range of circumstances. Moving from right to left, each bar shows the share of people whose work histories were beyond the bounds of the EDD data (gray); shares of people who were neither employed nor incarcerated during the year (turquoise), both employed and incarcerated (yellow), employed only (navy), and only incarcerated, which includes people estimated to be in pretrial detention and those serving sentences in prison or jail (orange).
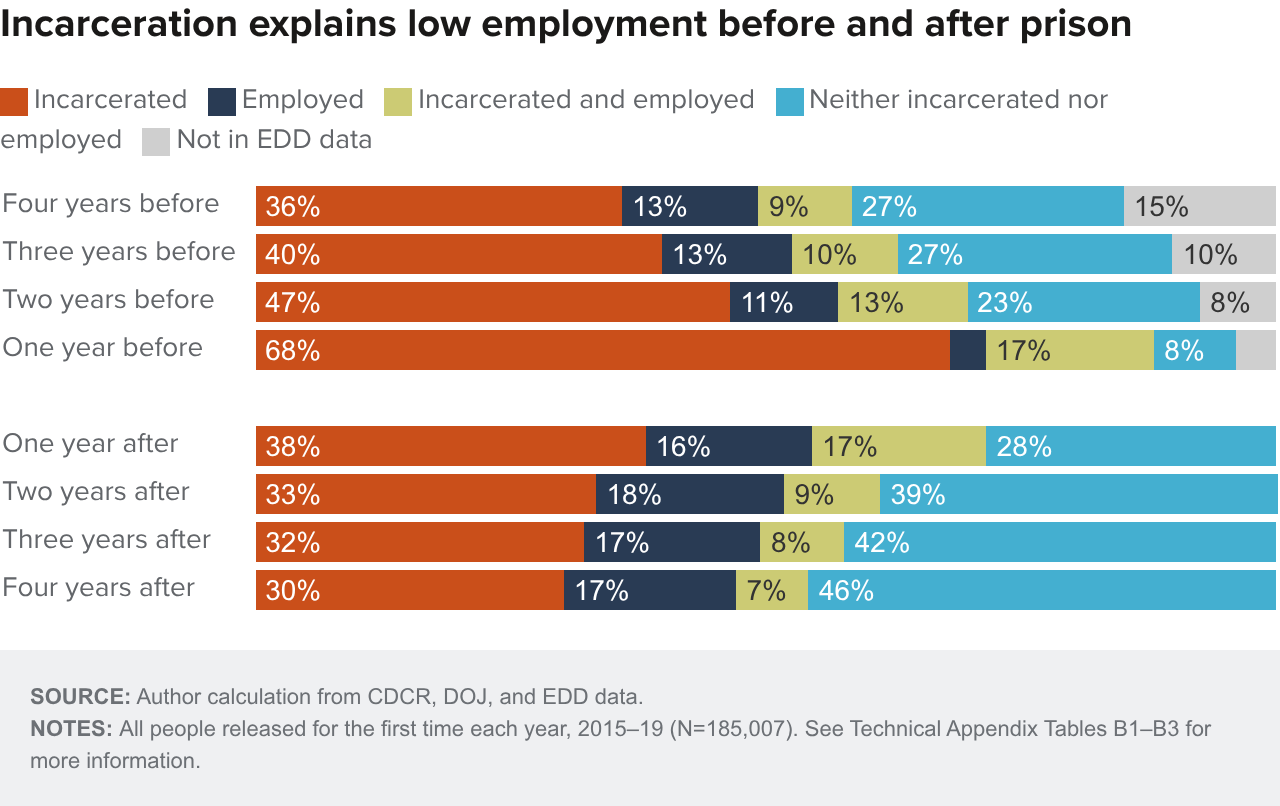
Incarceration explains why so few people were employed, especially in the year before prison. Specifically, pretrial and post-sentencing incarceration can explain why nearly 90 percent of the people who did not work in the year before prison were unemployed (Figure 5).
In each pre-prison year, the estimated amount of time people who were detained spent in jail before they were convicted averaged between 7 and 11 months. Similarly, expected time to serve averaged between 10 months and 23 months, with the longest sentences handed down in the year before prison. After prison, estimated pretrial detention lengths for rearrested (and reconvicted) people remained about the same—9 to 12 months in each post-prison year. Similarly, expected time to serve ranged from 11 to 14 months. Figure 5 accounts for these estimated incarceration periods (Technical Appendix Tables B1 and B2).
Incarceration is a less comprehensive explanation for low post-prison employment. Shares of people who are neither employed nor incarcerated grew from 28 percent in the first post-prison year to 46 percent four years out. Moreover, by the fourth post-prison year, incarceration had the potential to explain why 40 percent of nonworking people did not have jobs—still a substantial number, but a much less comprehensive one.
Other factors can also contribute to low employment
Other potential explanations for low employment among California’s released prisoner population, generally and in relation to similar populations in other states, include the changing composition of the prison population, the structure of parole in the state, and labor market conditions, which include California’s regulatory environment, informal employment, and the rise of gig work, which is excluded from unemployment insurance data.
Most released prisoners in California have violence in their past. California prisoners are more likely to have been convicted of violent felonies and much less likely to have been convicted of nonviolent crimes than prisoners elsewhere in the nation because California sentences fewer people with nonviolent convictions to prison (Harris and Cremin 2024, 2025). Employers are less willing to hire people with violent criminal convictions (Cerda, Stenstrom, and Curtis 2014; Denver, Pickett, and Bushway 2017). In one prominent study, employers indicated they were nearly five times less willing to hire violent offenders than nonviolent offenders (Holzer, Raphael, and Stoll 2003). Yet prior research also shows that people with violent convictions do find work (Lattimore, Steffey, and Visher 2010). Seven in ten participants in the Serious and Violent Offender Reentry Initiative (SVORI) reported having a job at 15 months post-release. However, many of these jobs seem to have been “under the table”—informal employment that usually involves cash wages and is not tracked in state administrative data.
Under-the-table work. Self-reported employment rates generally exceed official measures because people are working under the table. Though the extent to which released people in California work under the table before or after prison is unknown, the SVORI study indicates that informal work is common, and becomes more common with time because people struggle to find formal employment. Two months after they were released, 28 percent of SVORI respondents reported having informal work. Six months later, 47 percent reported working under-the-table jobs. Thus, formal labor market employment among SVORI participants (about one-third of workers, if nearly half are working informally) seems similar to that of formal work among released people in California.
Self-employment and gig work. People with criminal histories are more likely to be self-employed than people without them. In a five-state study, 28 percent of people with criminal histories reported self-employment versus 24 percent of those without (Finlay, Mueller-Smith, and Street 2023). Self-employment rates among Black women (42%) and Latinas (32%) with criminal histories were even higher (Pager 2003). Like people who work under the table, the self-employed are not represented in administrative employment records because they do not pay into the UI system. But a substantial share of the state’s released prisoners could be working for themselves, either as small business owners or in the gig economy.
Employment regulations. California imposes more restrictions on people with criminal histories than any other state—1,523 regulations, compared to 750 on average—and three-fourths pertain specifically to employment (CSG Justice Center 2021; Umez and Gaines 2021). California bars people with criminal and prison histories from holding certain jobs, applying for business or occupational licenses in certain fields, and limits their access to small business grants, such as the Paycheck Protection Program (CSG Justice Center 2021; Finlay et al. 2023).
Labor market conditions. Most prior studies of pre- and post-prison employment were conducted using data from the late 1990s or early 2000s, when unemployment rates were quite low, whereas some released people faced pre-prison labor markets with high unemployment rates in the wake of the Great Recession. However, 4 in 10 people leave California prisons within one year, so most entered between 2014 and 2019, when unemployment rates were at or below levels seen in the early 2000s (Sabol 2007; Yang 2017; Harris et al. 2024; Technical Appendix Figure A4).
Parole supervision. While parole supervision can promote post-prison employment, it can also disrupt promising pathways. Prior research indicates that parole supervision may promote employment immediately after prison because one requirement is to look for and hold a job or enroll in school (Harding and Harris 2020). In California, 99 percent of released prisoners are released to parole supervision at either the state or county level (Harris et al. 2024). The ubiquity of parole supervision may help explain why employment rates among California’s released prisoners, which substantially lagged those of released prisoners elsewhere before they went to prison, increased markedly after prison.
However, parole supervision can also disrupt post-prison employment because people who are required to report to a parole officer are more likely to be rearrested, reconvicted, and reimprisoned—and less likely to be granted pretrial release (Petersilia and Turner 1990; Grattet, Lin, and Petersilia 2011; Tafoya et al. 2017). As time passes, arrest rates increase. Nearly one-quarter of people released from California prisons between 2015 and 2019 were rearrested within 90 days, and half were arrested within the first post-release year (Harris et al. 2024).
Nearly half of the crimes for which people are arrested are supervision violations or drug possession charges, Yet prior research has shown that rearrests for minor crimes can easily lead to job loss, especially if people are held in jail while their charges resolve (Nahra, Knight, and Western 2025; Western and Harding 2022). In California, just 17 percent of people who are arrested while under supervision secure pretrial release (Tafoya et al. 2017).
What Kind of Work Did California’s Released Prisoners Do?
Understanding what kind of work people do and how they do it can inform policies intended to increase employment. Determining the nature of people’s work can help us better understand earnings and potentially provide guidance about the support people might need as they reenter labor markets after prison.
The employment data include the industries in which people worked before and after prison and where they were located (but not their occupations or employers); also included are the quarters in which they were employed in those industries. In contrast, the prison data include more information about the actual jobs that people did in prison, the schedules they worked, and their precise job tenures (i.e., how long they held each job). Inside and outside prison, most people worked intermittently in lower-skill jobs and industries.
People Worked Inconsistently
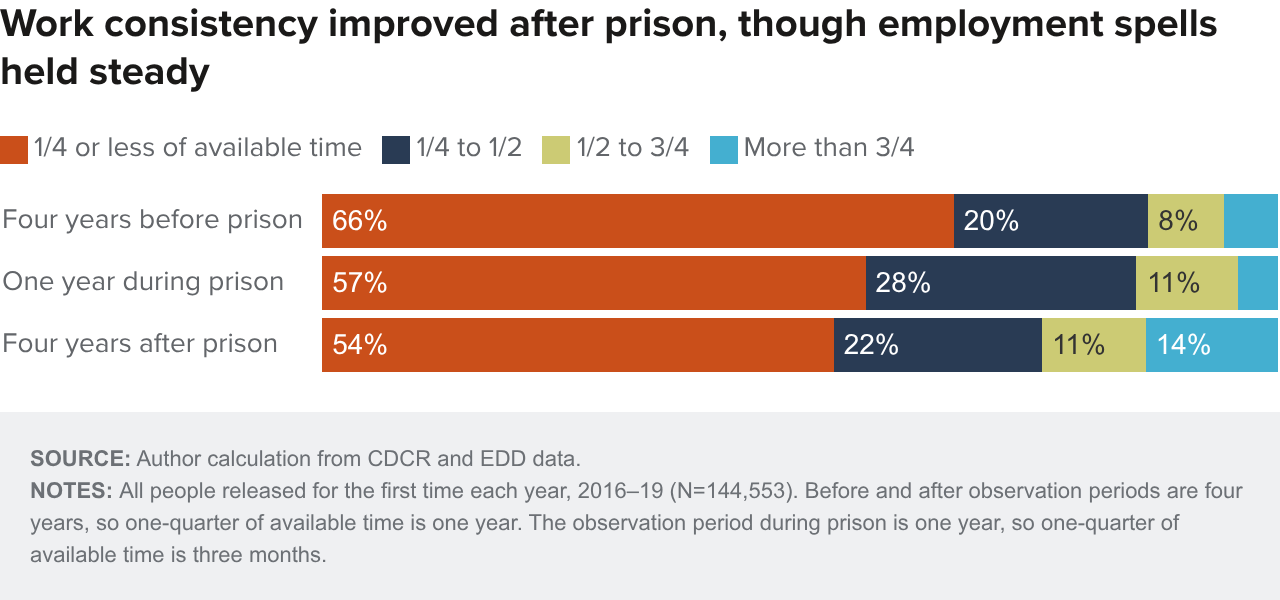
No matter when people worked or what kind of work they did, they worked inconsistently. Consecutive quarters during which unincarcerated people held jobs (i.e., “spells” or periods of continuous employment) in a four-year time frame indicate consistency. A complementary consistency measure for employment inside prison is length of time people held jobs (i.e., their job tenure) in the last year that they were imprisoned.
Outside prison, working for more than a year at a time was uncommon
Of the 73,000 people who worked before prison, more than half (54%) worked just one spell; 42 percent worked two or three spells; and the remaining 4 percent worked four or more spells.
On average, people worked for four quarters in a row. Yet most people did not work for one year; 56 percent of people held jobs for less than 4 quarters, and 23 percent worked just one quarter. Just under 6 percent of people were employed continuously for three or more years.
Consistency improved after prison, even though the distribution of employment spells was similar. Fifty-three percent of people worked one spell after prison, 43 percent worked two or three spells, and 4 percent worked four or more spells. At the same time, the average length of an employment spell increased to 6 quarters, and the share who worked continuously for at least three years more than doubled to 14 percent (Figure 6).
In prison, most people worked multiple short-tenure and part-time jobs
Most prison work assignments did not last very long. On average, people held a prison job for 36 days (61 days at the median), with one-quarter of prison jobs lasting two weeks or less. Job tenure ranged from two to six months for just 27 percent of jobs, and just 7 percent of jobs lasted longer than six months.
Most prison jobs are part time; while 94 percent of people work 5 days per week, only 19 percent work more than six hours a day (most of these workers are camp firefighters); 18 percent work between four and six hours, and 63 percent work four hours or less. Work shifts were scheduled around the clock; most worked morning shifts (Technical Appendix Figure C1). Seventy-eight percent began work between 4 AM and 7 AM; 20 percent started between noon and 7 PM; and 2 percent worked overnight.
Though job tenures were short, work days and hours—job schedules—changed at least once. For 70 percent of jobs held, the schedule changed once. Five percent of jobs involved up to six different scheduling changes, and the other 25 percent required just one.
Short job tenures and part-time schedules may be why most people who held prison jobs held more than one. Thirty-six percent of people held just one job, 28 percent held two, 20 percent held three, and 17 percent held four or more jobs—all just in the last year that they were imprisoned.
Most Prisoners Worked Jobs That Support Prison Operations
With the creation of the Department of Corrections in 1944, the extent of idleness in the prisons was considered a major problem…It was recognized that prisoners want to work, and that a work assignment can become a reward for good behavior.…One of the methods of [reducing idleness] is to utilize prisoners in the maintenance services which must be carried on in institutions, such as food services, janitorial work, repair and painting of buildings, maintenance of mechanical equipment, operation of hospitals, libraries, etc., plus those engaged in forestry and road camp work. (Hawkinshire 1959: 231, 240)
As was the case 75 years ago, most prison jobs support prison operations. Figure 7 shows more than 120 different work assignments held by released prisoners in California in categories used by the Bureau of Justice Statistics 2016 Survey of Prison Inmates (SIPA). Though SIPA statistics are not directly comparable to the findings detailed in this report, they provide a reference point for understanding the kind of work imprisoned people do.
In California and nationwide, most prisoners hold janitorial, food service, kitchen and dining room work, and building and grounds maintenance positions. Service-related jobs include many types of work, including photography and graphic design, educational and recreational support, clerk and attendant jobs, personal and animal grooming, institutional firefighting, and driving. Just as the health care industry has grown in response to California’s aging population, health care opportunities for working prisoners have expanded along with the aging prison population. Increasingly, the state’s imprisoned people hold jobs related to disability services and hospice care (Harris and Cremin 2024; Koran 2025).
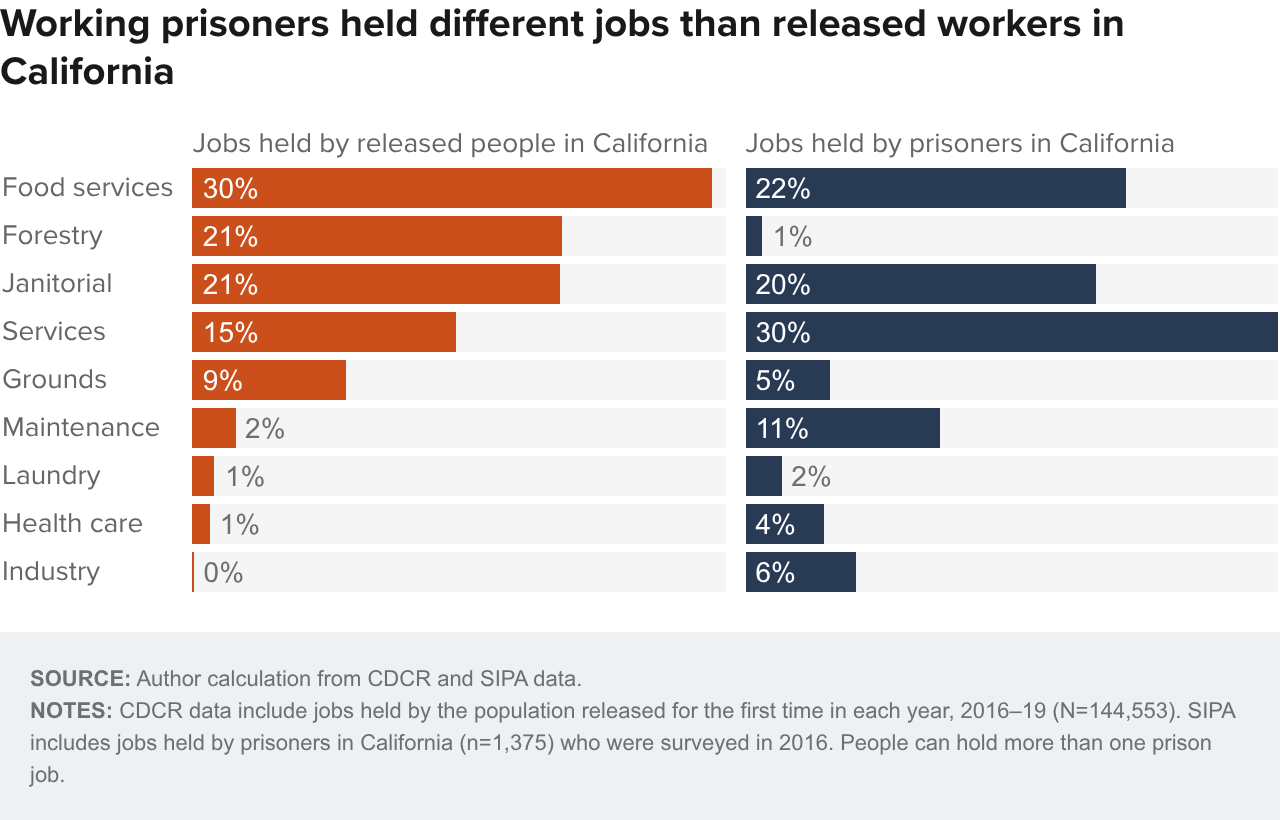
Nearly all jobs in the forestry category relate to the conservation camp program, and one in five jobs held by people released from prison in California were firefighter or trainee positions. Just 3 percent of prisoners in other states held forestry or farming jobs. Similarly, just 1 percent of imprisoned Californians held firefighting jobs in 2016.
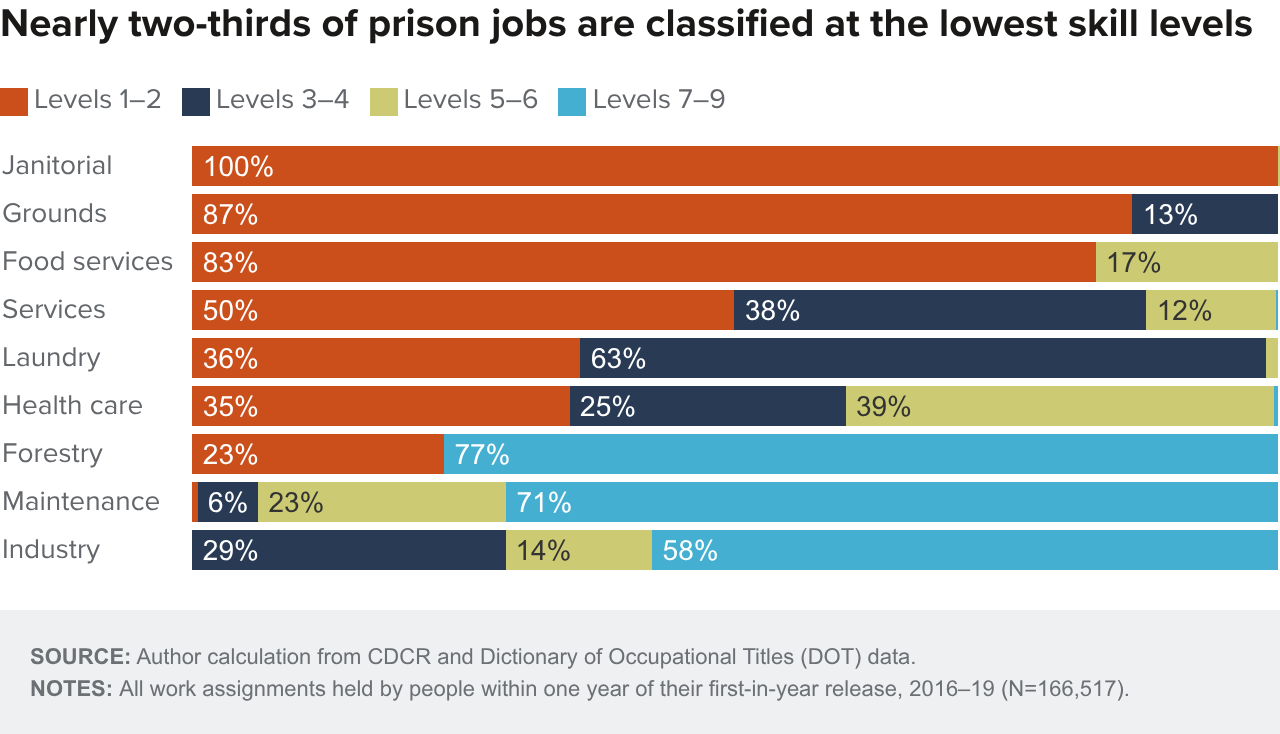
Most prison jobs are low skill
Per the California Code of Regulations, CDCR classifies prisoner jobs within the Dictionary of Occupational Titles (DOT) system. Each classified job is assigned a skill level. Most jobs require the lowest skill levels (Figure 8). The most-skilled workers are in the forestry and maintenance categories: largely camp firefighters and skilled tradespeople, such as carpenters, painters, and welders (Technical Appendix Table C1).
People with Prison Histories Did Temporary, Low-Wage Work
Prior research on released prisoners in Michigan identified five key industries in which men leaving prison commonly found work: temporary services, construction, manufacturing, retail, and restaurants (LaBriola 2020; Rucks-Ahidiana, Harding, and Harris 2021). Presenting information for men and women before and after prison in California extends this prior research.
Reliance on temporary jobs deepened after prison
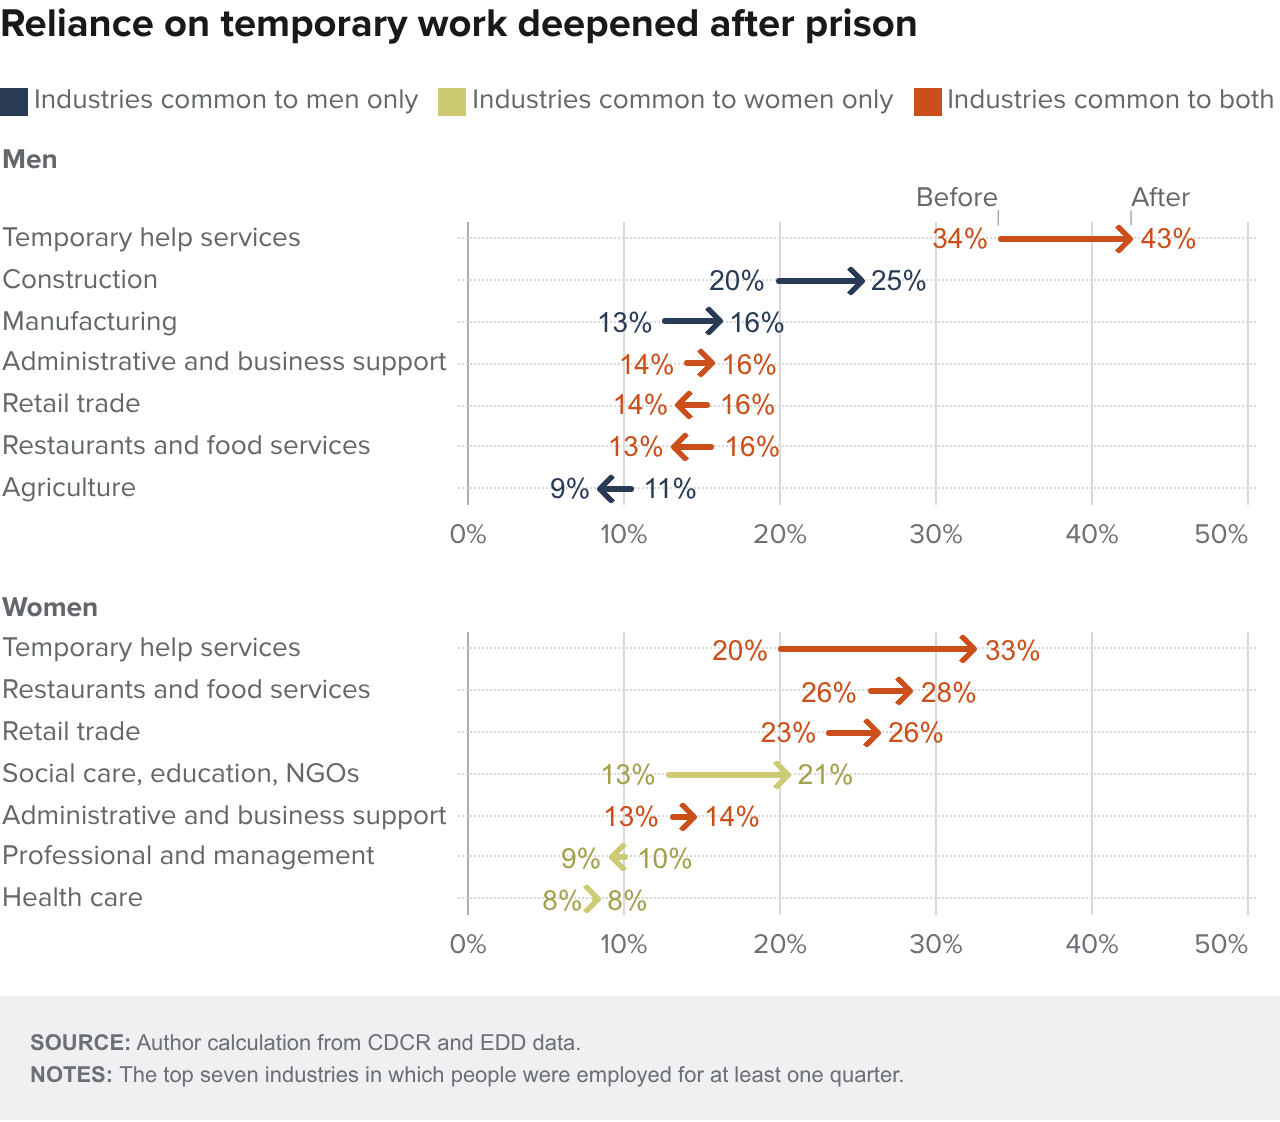
Inconsistent employment is a feature of the jobs people commonly worked before and after prison: of people who worked before prison, one-third (34% of men and 20% of women) worked at least one quarter in the temporary help services industry. By contrast, 2 percent of California’s overall workforce were employed in administrative services, of which temporary help services are a subset.
Dependence on temporary work deepened after prison, with 42 percent of working people (43% of men and 33% of women) spending at least one quarter in the temporary workforce (Figure 9). The prevalence of temporary work in the released prisoner population means that, annually, as many as 3 in 100 people in California’s temporary workforce were released prisoners.
Released prisoners’ dependence on temporary employment may be of concern because temporary jobs are more likely to offer low levels of stability, pay, benefits, or advancement opportunities (LaBriola 2020; Heinrich et al. 2007). Jobs in the temporary help services industry are defined primarily by limited tenure and can include work in almost any industry or occupation. However, three occupations—laborers, office clerks, and packers—accounted for 30 percent of all temporary positions in 2004. Nationally, about half of the nearly 3 million temporary positions held monthly are in two industries: transportation and manufacturing (Kilcoyne 2004; Dietz 2012; Dey et al. 2017; BLS 2019; Bowdle and Tito 2024; BLS 2026).
Yet temporary work can also offer a “stepping stone” to more stable, higher-wage employment (Andersson, Holzer, and Lane 2003; Filomena and Picchio 2022). In short, people who perform well in temporary jobs may be hired into full-time work and offered advancement opportunities. Whether people cycle through “dead end” jobs or “step up” to greater opportunities depends on many of the same factors that affect employment rates more generally, including labor market conditions and personal characteristics.
Men and women had different employment opportunities
Men in California worked in the industries identified in prior research and two others: administrative services and agriculture. Women worked in some of the same industries as men: temporary services, administrative services, retail, and restaurants. Women’s other industries of employment differed from men’s: social care and education, professional and managerial organizations, and health care.
Of the industries common to men and women, similar shares worked in administrative services before and after prison. Women were more concentrated in restaurants and retail than men both before and after prison, whereas men were more dependent on temp jobs before they went to prison and after coming home.
Men’s employment in construction (20% before, 25% after) and manufacturing (13% before, 16% after) increased after prison, whereas they were less likely to work in retail, restaurants, and agriculture. Similarly, women found more work after prison in social care and education (13% before, 21% after), retail (23% before, 26% after), and restaurants (26% before, 28% after), whereas they were less likely to be hired in professional or managerial organizations and about as likely to work in the health care industry (8%).
Compared to California’s population, released prisoners worked lower-wage jobs
People with prison histories tended to work in different industries than those without such histories, both before and after prison (Technical Appendix Figure C3). Generally, people with prison histories were concentrated in the lowest-paying industries (Technical Appendix Figures C4 and C5).
In addition to temporary help services, people with prison histories were overrepresented in restaurants and food services: 26 percent of women and 13 percent of men before prison, and 28 percent of women and 16 percent of men after prison. By contrast, just 7 percent of women and 6 percent of men in the overall state workforce work in restaurants, bars, and food service.
Women with prison histories had broader representation in higher-paying industries than similarly situated men. Yet relative to women workers overall, women with prison histories were underrepresented in these higher-paying industries, which include health care (8% versus 17%), social care and education (13% versus 19%), and professional and managerial organizations (9% versus 12%).
Similarly, men in the state workforce were more prevalent in higher-paying industries than men with prison histories. Specifically, they worked in professional and managerial organizations (14% versus 7%) and in real estate, finance, and information (8% versus 5%). By contrast, men with prison histories were especially overrepresented in construction (20% versus 8%) before and after prison.
How Much Did Released Prisoners Earn?
The kind of work that people did before and after prison suggests that they were unlikely to have earned much money. People tended to work low-skill jobs intermittently. Figure 10 illustrates meager earnings that fell well below poverty thresholds in all time periods. In 2023, the statewide poverty threshold for single adults stood at $20,200 (Technical Appendix Table A1). Median annual earnings averaged $6,545 and ranged from $4,700 in the year before prison to about $7,200 in four years before prison. People earned more than twice as much after prison, with median earnings averaging $14,120 and ranging from $10,000 in the first year after prison to $16,900 in the fourth post-prison year.
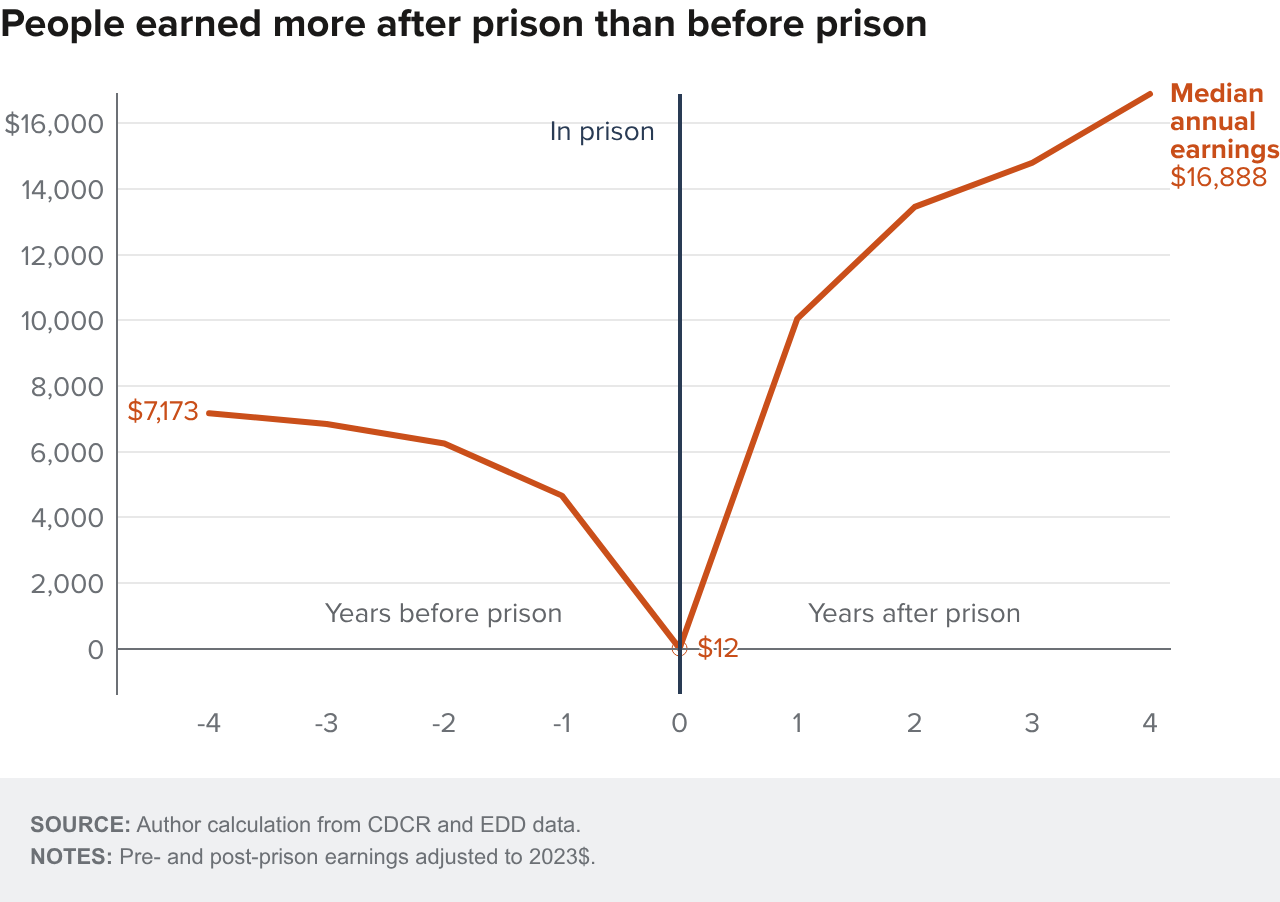
However, the sub-poverty earnings before and after prison dwarfed earnings from prison jobs. Though people were most likely to be employed while they were in prison and worked most consistently during that time, they earned the least amount of money. Of the 66,300 people who held non-firefighting and non-physical fitness training jobs (the latter are designated unpaid pre-firefighter training positions) during their last year of imprisonment, 28 percent earned no money; 33 percent earned up to $20; 31 percent earned up to $100; and 8 percent earned up to $1000. Median earnings in the last pre-release year amounted to $12 (Technical Appendix Figure D1).
Prisoner Wages Were Low, But They Were Compensated in Other Ways
Monetary compensation for prisoners’ work is low across the United States. Yet prisoners in California were paid 40 percent less than the national average before the pandemic. Between 2015 and 2019, California prisoners who did not hold camp firefighter positions earned between $0.08 and $0.37 per hour, putting the state in the lower range of prisoners pay nationally, as shown in blue in Figure 11.
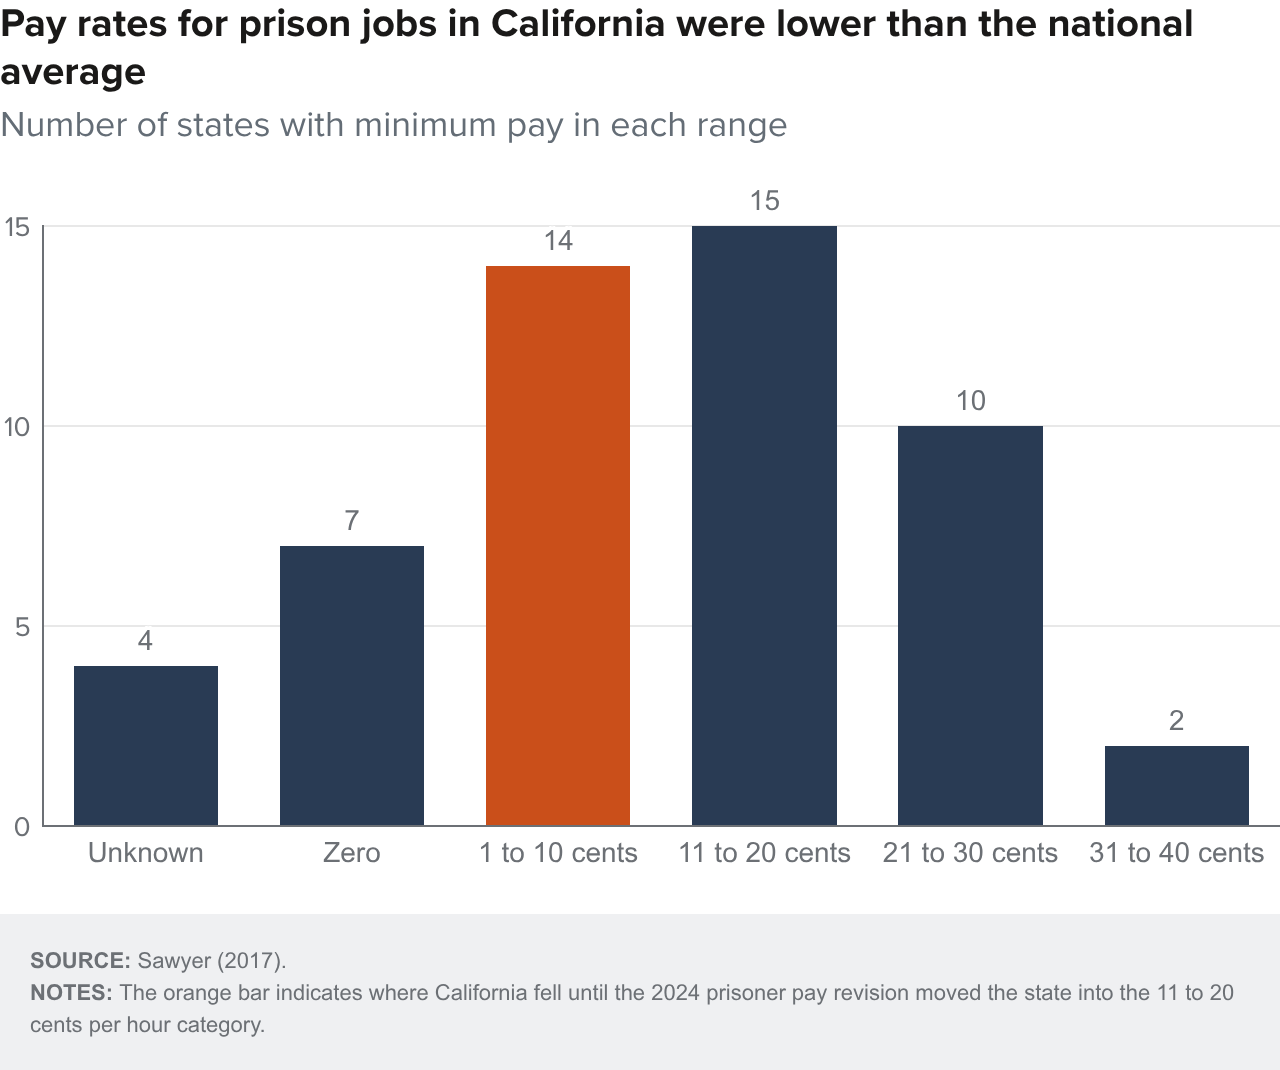
Pay rates mainly depend on job characteristics. Most jobs are classified at the lowest skill levels, so most prison jobs netted correspondingly lowest rates (Technical Appendix Figure D2). Of more than 85,000 jobs held, 45 percent paid 8 cents per hour, and workers earned between 11 and 15 cents per hour in another 40 percent of jobs. Just 4 percent of jobs allowed people to earn the highest prison wages: between 26 and 37 cents per hour.
Nearly one-third of prison jobs were unpaid
Thirty-two percent of prison work assignments were unpaid. Prior to pay reform in 2024, non-trainee jobs could be designated as pay ineligible via two pathways. The first, which still applies today, depends on prisoner behavior: sanctions for rules violations can include loss of pay.
The now-defunct second pathway hinges on prison resources: if resources allocated to pay prisoners ran out, some positions could be designated pay ineligible. Since pay-ineligibility decisions are made at the prison level, pay-ineligibility rates varied across prisons (Technical Appendix Figure D3).
The second pathway affected more people and positions than the first. Forty-six percent of people who worked—more than 34,300 people—held at least one pay-ineligible job, while loss of pay for rules violations explained less than 5 percent of those instances.
Women are less likely hold pay-ineligible positions than men (39% versus 46%) because one of the two women’s prisons has low pay-ineligibility rates. Differences in pay-ineligible employment across racial/ethnic groups are small, with Native Americans (40%) less likely to hold pay-ineligible positions than workers of other races/ethnicities (45 to 46%).
Prisoners who worked earned time off their sentences
In California, prisoners receive non-monetary compensation for the work they do, which may be more relevant than the monetary compensation they receive. Most importantly, prisoners who work and participate in rehabilitative programs can earn different types of “sentence credits,” which reduce the time they spend in prison. How much time people can earn, forfeit (e.g., due to a rules violation), and have restored (e.g., for subsequent good behavior) depends on their prison history and the jobs they hold (Technical Appendix Tables D1 and D2). Currently, PPIC lacks the data to report on the degree to which credits are earned, forfeited, and restored in relation to work and program assignments.
Wage Levels Outside Prison Varied Considerably
Outside prison, most people did not earn enough money from all the jobs they worked to exceed the statewide poverty threshold. In 2023, the statewide poverty threshold for a single adult between the ages of 18 and 65 was $20,200. Before prison, annual median earnings among the working were about $6,500 (in 2023$). After prison, those who worked made more than twice as much money: annual median earnings topped $14,000. However, these medians mask considerable geographic and demographic variation.
Earnings varied across the state
Just as opportunities to hold jobs that offered pay varied across the prison system, economic conditions and the potential for employment varied considerably across the state. For example, 2023 county poverty thresholds ranged from $15,000 in rural northern counties to $25,000 in San Francisco Bay Area counties (Technical Appendix Table A1).
Before prison, median annual earnings did not exceed poverty thresholds in any region or county. In fact, the gap between median annual pre-prison earnings and the poverty threshold averaged $12,000 across the state. After prison, people earned more, such that the average gap between poverty thresholds and people’s earnings narrowed to just $3,000. In six counties—San Francisco, Sonoma, Monterey, San Benito, Yolo, and Placer—median annual earnings exceeded the poverty threshold (Technical Appendix Figure D4).
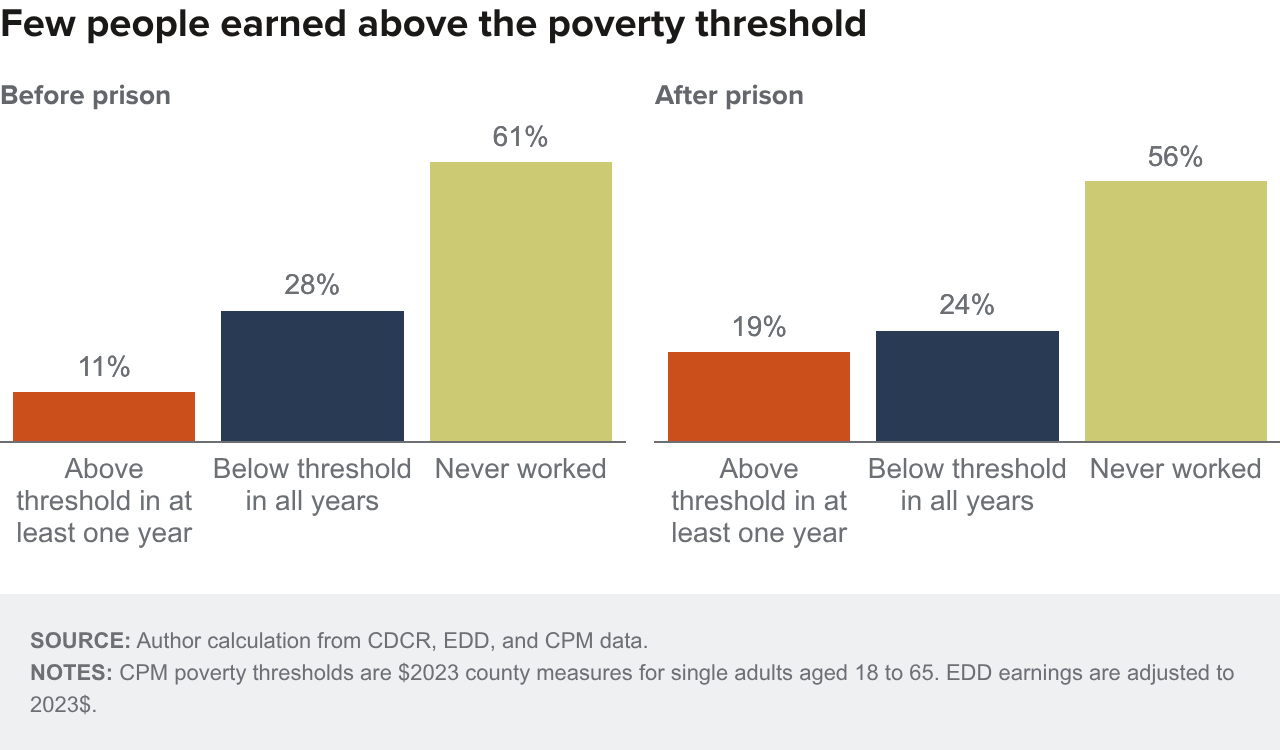
Less than half of working people earned enough to exceed poverty thresholds
Even when prisoners worked, they typically did not earn above their local poverty thresholds (Figure 12). Just 28 percent of people who worked (11% of all people) earned enough to exceed the poverty threshold in at least one year. After prison, that number grew to 45 percent of those who worked (and 19% of all released people). A contributing factor is that most did not work in all pre- or post-prison years. Before prison, one-third of those who worked were employed in just one year and 19 percent were employed in all four. After prison, 28 percent of working people were employed in just one year, and 31 percent worked in all four years.
Earnings increased for everyone after prison—but most disparities widened
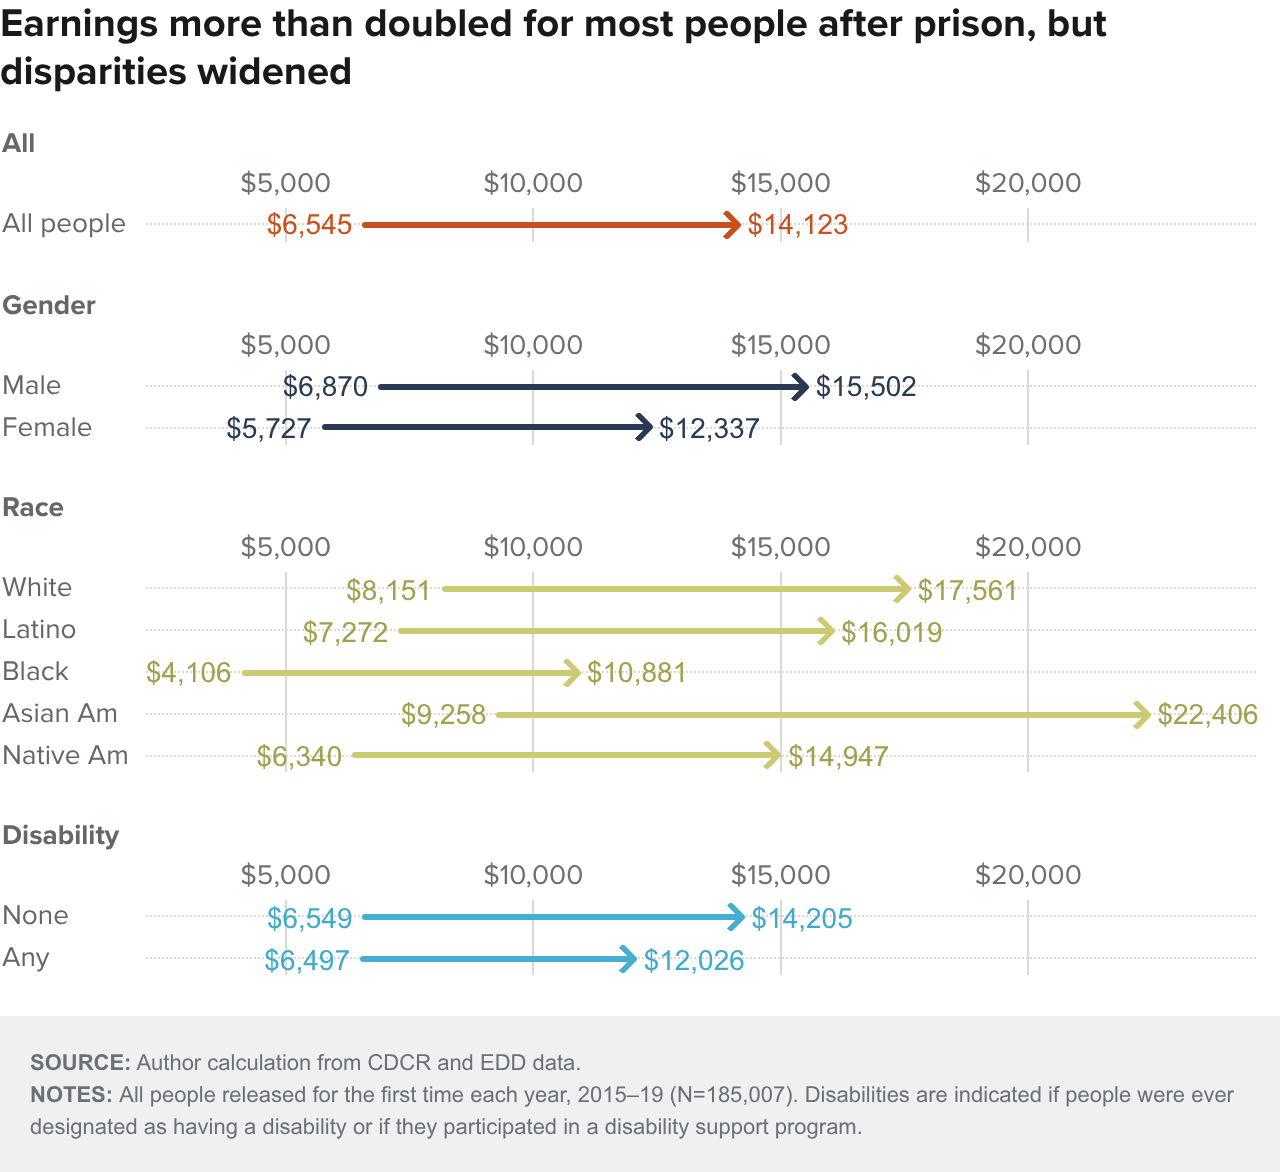
Earnings disparities among working people before they went to prison reflected those in California’s workforce, with white and Asian American people typically earning more than Black, Native American, and Latino people, (Thorman and Cremin 2025).
Before prison, women earned about $1,000 less per year (17% less) than men (Figure 13). Earnings for both men and women more than doubled after prison, but the gender gap widened to 20 percent. Similarly, the earnings gap that favors Asian American over white people widened from just over $1,000 (14% more) to nearly $7,000 (28% more).
The largest demographic disparities in pre-prison earnings were between Black and white people: Black workers earned half as much as white workers. After prison, this gap narrowed, with Black people earning 38 percent less. Similarly, wage gaps that favored white people over Native Americans narrowed from 22 percent to 15 percent.
Who Succeeds and Who Struggles after Prison?
The descriptive analysis in this section confronts the question of what differentiates released prisoners who work from those who do not, with the aim of providing insights on promoting employment among people released from prison. Prior descriptive research has found that people who had more work experience and higher education levels before prison and who participated in prison programs have better outcomes after they are released (Duwe and Clark 2017; Harding and Harris 2020; Duwe et al. 2025). This analysis reinforces these findings but cannot establish causal relationships.
Work Begets Work—So Does Working More Consistently
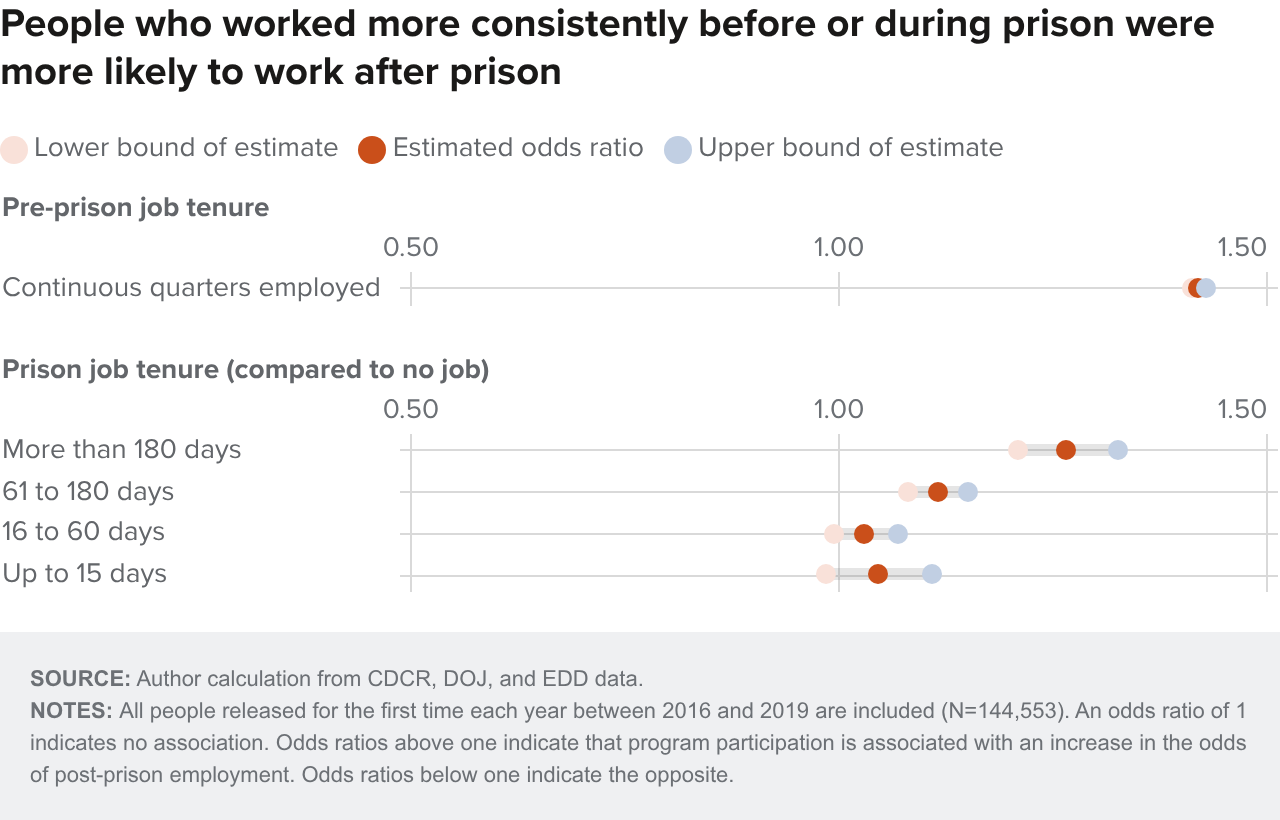
Whether people worked before prison was by far the most relevant predictor of whether they worked after prison. People who had jobs before prison were nine times more likely to work after prison than people who did not work before prison. Likewise, people who had prison jobs in the year before they were released were 9 percent more likely to work after prison than people who did not work in prison. Thus, any prior work made working after prison more likely, but work outside prison was more important than work inside prison (Technical Appendix Table E1).
Similarly, people who worked more consistently—outside and inside prison—were more likely to be employed after prison. Each additional quarter a person worked continuously before prison increased the likelihood of having a job after prison by 42 percent. As shown in Figure 14, people who held prison jobs for two to six months were 15 percent more likely to have a job after prison than those who did not work in prison, an association that deepened amid greater consistency. People who held jobs for six or more months were 26 percent more likely to be employed after prison, compared to those who did not have jobs. Moreover, those who did not hold their work assignments for at least two months saw no post-prison employment gains relative to those who did not work (Technical Appendix Table E4).
Participants in Some Prison Programs Were More Likely to Hold Jobs after Release
Over the past decade the state has invested in rehabilitative prison programs to improve in-prison behavior and post-prison outcomes. CDCR targets programs to prisoners’ assessed needs in three main program areas—education, employment, and behavioral health (Harris et al. 2024). PPIC has not yet evaluated prison programs, but this analysis suggests that some prison programs have the potential to promote employment after prison. At least one program in each of the three areas was positively associated with post-prison employment (Figure 15).
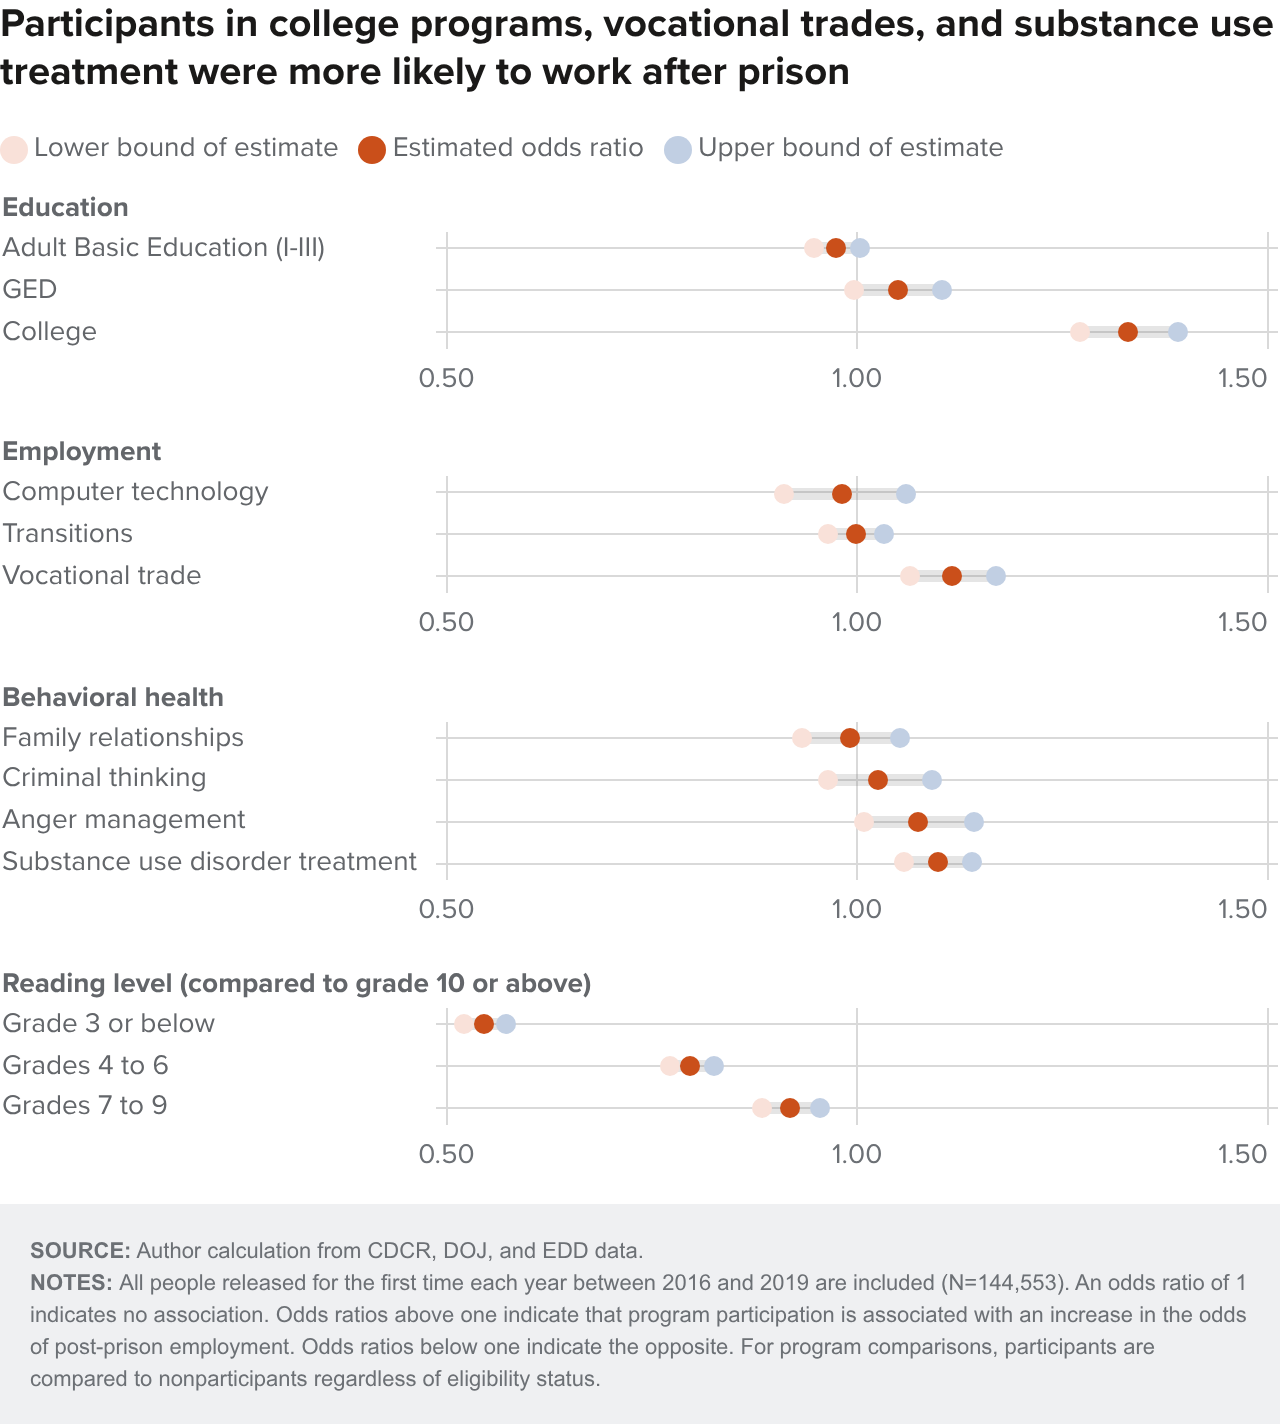
Education programs. People participated in education courses at high rates, compared to other kinds of prison programs. Thirty-three percent of people released between 2016 and 2019 participated in at least one adult basic education course, and 6 percent took GED classes. College enrollment grew from 7 percent of people released in 2016 to 11 percent in 2019.
People who participated in college courses were 31 percent more likely to have jobs after prison, whereas people who participated in ABE and GED courses did not see similar gains—a finding common to the prison literature (e.g., NCSALL 2005; Harding and Harris 2020). However, college participants had advantages that likely contributed to their success.
Specifically, people who take college courses have higher reading levels. The higher a person’s reading level was, the more likely they were to find post-prison employment. People who read at the third-grade level were 43 percent less likely than those who read at the tenth-grade level to work after prison, and people who read between the fourth- and sixth-grade levels were 19 percent less likely (Figure 15). Thus, people who participate in adult basic education seem to have greater challenges in the labor market than people who read at the college level.
Employment programs. People participated in career technical education (CTE) programs at low but growing rates. Between 2016 and 2019, participation rates in vocational trades (e.g., carpentry, plumbing, and welding) grew from 6 to 9 percent, and participation rates in computer literacy and technology courses grew from 2 to 5 percent of those released. Transitions (a job readiness and financial literacy program) was introduced in 2016, from which time participation rates grew to 26 percent among people released in 2019.
People who participated in career technical education courses that teach vocational trades were 12 percent more likely to have a job after prison, whereas participants in Transitions and computer technology courses did not experience post-prison employment gains.
Behavioral health programs. Most people who left California prisons had at least one behavioral health need when they entered: nearly 7 in 10 needed substance-use disorder treatment (SUDT) and 4 in 10 were deemed to be in need of anger management or criminal thinking programs. Participation in each of these rehabilitative programs has grown over time. For example, participation in SUDT increased from 13 percent for people released in 2016 to 19 percent in 2019.
Compared to nonparticipants, participants in substance abuse treatment and anger management were more likely to be employed after prison, whereas participants in programs related to reducing criminal thinking and improving family relationships did not see similar increases. Participants in substance-use disorder treatment and anger management programs were 10 percent and 7 percent more likely to have jobs after prison, respectively, than nonparticipants.
Some Demographic Characteristics Mattered More than Others
Some personal characteristics were associated with post-prison employment rates, whereas others were not (Technical Appendix Tables E2–E4). Men and women were about as likely to have jobs after prison, as were white, Asian American, and Native American people. Across racial/ethnic groups, Black people were most likely and Latinos were least likely to have jobs after prison. Age also mattered: middle-aged people were more likely to have a job after release than young adults and older people.
The widest demographic disparities were between people with and without disabilities. People with physical disabilities were 42 percent less likely and people with cognitive disabilities were 48 percent less likely than people without disabilities to have jobs after prison. CDCR reported in 2019 that 11 percent of released people had applied for social security disability insurance, but did not indicate how many received it.
Policy Discussion and Conclusion
State policymakers have long sought to promote employment in populations with criminal histories to reduce their likelihood of committing new crimes and to broaden economic prosperity within their families and communities. Yet people released from prison in California before the pandemic struggled to find work and were less likely to have formal jobs than released prisoners in other states.
Some people could have been working at under-the-table or other jobs not represented in employment data. And incarceration in prison and jail either during the pretrial period or after sentencing explains why many people did not work in the period studied. For example, of those who were not working in the year before prison, about 90 percent were incarcerated in prison or jail. Incarceration is a less comprehensive explanation after prison; at four years out, 40 percent of those who were not working were incarcerated—still a substantial number.
These findings indicate that key policy goals should include encouraging more people to get jobs and hold them for longer periods, which also involves keeping them out of prison and jail. Several policy levers have the potential to help promote employment among released prisoners and improve job opportunities for people with criminal histories more generally.
Examine whether state regulations create barriers to employment. California has more than double the average number of regulations affecting employment for people with criminal histories than any other state. Regulations limit released prisoners’ access to broad swaths of the labor market, including some of the higher-paying industries in which released people work: health care, construction, and transportation (CSG Justice Center 2021). A comprehensive review of these regulations—including a causal analysis of their effects on people with criminal and prison histories—could help determine which are necessary or warranted and which are counterproductive or superfluous.
Consider incentivizing employers to hire people with criminal histories. Violent offenders are less likely than nonviolent offenders to commit new crimes, and those who do reoffend are unlikely to commit violent crimes; only 6 percent of released people were reconvicted for a violent felony within two years (Harris et al. 2024). Yet employers are five times less likely to hire people with violent criminal histories, and nearly all people released from prison in California have violence in their past. What can the state do to encourage employers to hire people they perceive as risky? Evaluations of federal programs that offer hiring tax credits or modestly insure employers against potential losses due to employee misconduct has shown them to meaningfully increase the chance of employers offering jobs to people with criminal histories (Bushway and Pickett 2024; Hunt et al. 2018).
The research also cites key shortcomings of these federal programs that have led to their underutilization: high administrative burdens on employers and employer coverage for only one post-release year. State policymakers could potentially elevate employment rates among people on parole by creating similar programs that overcome these limitations. Such programs would place fewer administrative burdens on employers and insure against liabilities for longer periods, such as the entire time their employees remain under criminal justice supervision.
Build people’s capacity for consistency. Though holding jobs before and during prison for longer periods made having a job after prison—and earning above the poverty threshold—more likely, few people with prison histories who worked held jobs in the long term. Encouragingly, people’s capacity for consistency has the potential to be built inside prisons via extended job tenures and investments in education, employment, and behavioral health programs. Giving people opportunities to stay in prison jobs for at least two months might improve post-prison employment rates, and longer tenures were associated with deeper impacts.
Programs that address core behavioral health needs, including substance-use treatment, and programs that teach marketable skills, such as vocational trades and college courses, also hold promise for promoting post-prison employment. These findings will inform PPIC’s ongoing evaluation of prison programs in California.
Evaluate innovations that support success after prison. Expanding work opportunities will not increase employment rates if people continue to cycle in and out of incarceration. Incarceration associated with ongoing criminal justice system contact explained why many non-working people were not working. Yet identifying ways to help people desist from crime has been a longstanding and persistent challenge for policymakers. Prior research has shown that the year after prison is a critical time during which pathways characterized by success and struggle are established (Harris and Harding 2019).
California is providing more services to people just before and just after they are released from prison through, for example, community reentry programs. An early evaluation of these programs in California found promising results (Higuera, Jensen, and Morton 2021), but similar programs that have been brought to scale elsewhere have failed to deliver on that promise (Lowenkamp and Latessa 2002; Latessa et al. 2009; Latessa 2018; Doleac 2019). Therefore, as the state deepens its commitment to the rehabilitation of imprisoned people, a corresponding commitment to rigorous research that evaluates the causal effects of these interventions while determining why they do (or do not) work and for whom is also recommended.
Topics
Criminal Justice Economy Jobs and Employment Poverty & Inequality Workforce and Training


