Key Takeaways
As in other states, California’s birth rates have fallen to unprecedented lows, a trend with major demographic and economic implications for the state. By 2038 deaths may surpass births in California. Without higher immigration or an increase in birth rates, population growth will slow or even decline. In this report, we provide context on the state’s baby bust, focusing on 2008 to 2023—a recent period of decline. Key findings include:
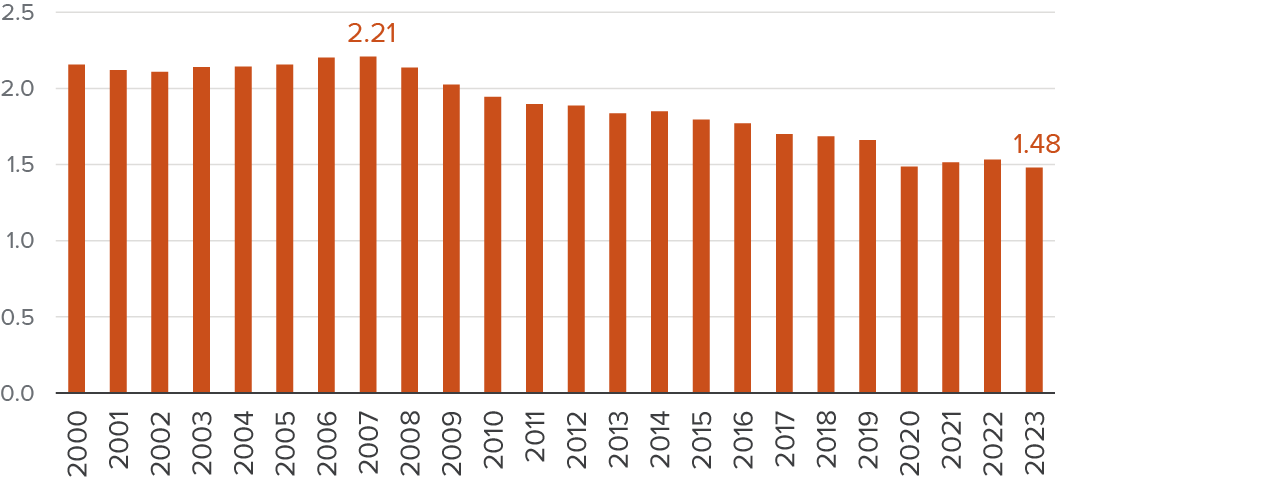
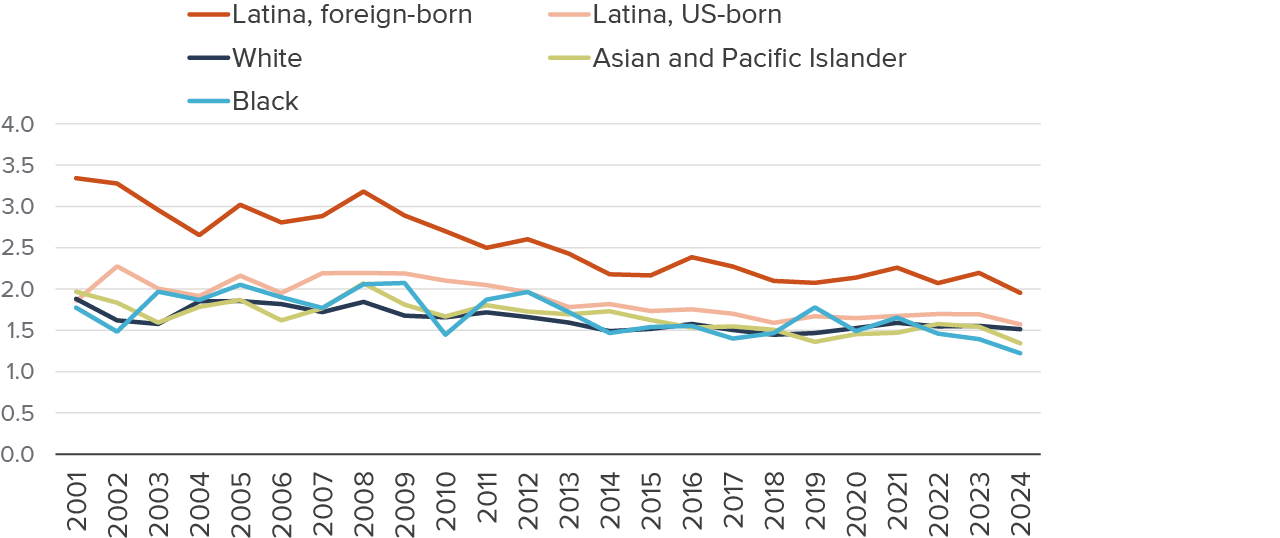
- Birth rates have fallen below “replacement” level. The total fertility rate in California has dropped from 2.21 children per woman in 2007 to 1.48 in 2023, well below the replacement level of 2.1 necessary to keep a population from declining. Rates fell for all racial and ethnic groups, but especially for Latina women—and more quickly among foreign-born women.
- Falling birth rates among younger women largely drive declines. Since 1991, teen birth rates have dropped by 86 percent, a significant public health achievement. Rates fell among women in their 20s but increased among women aged 35 and older—though not enough to offset declines at earlier ages.
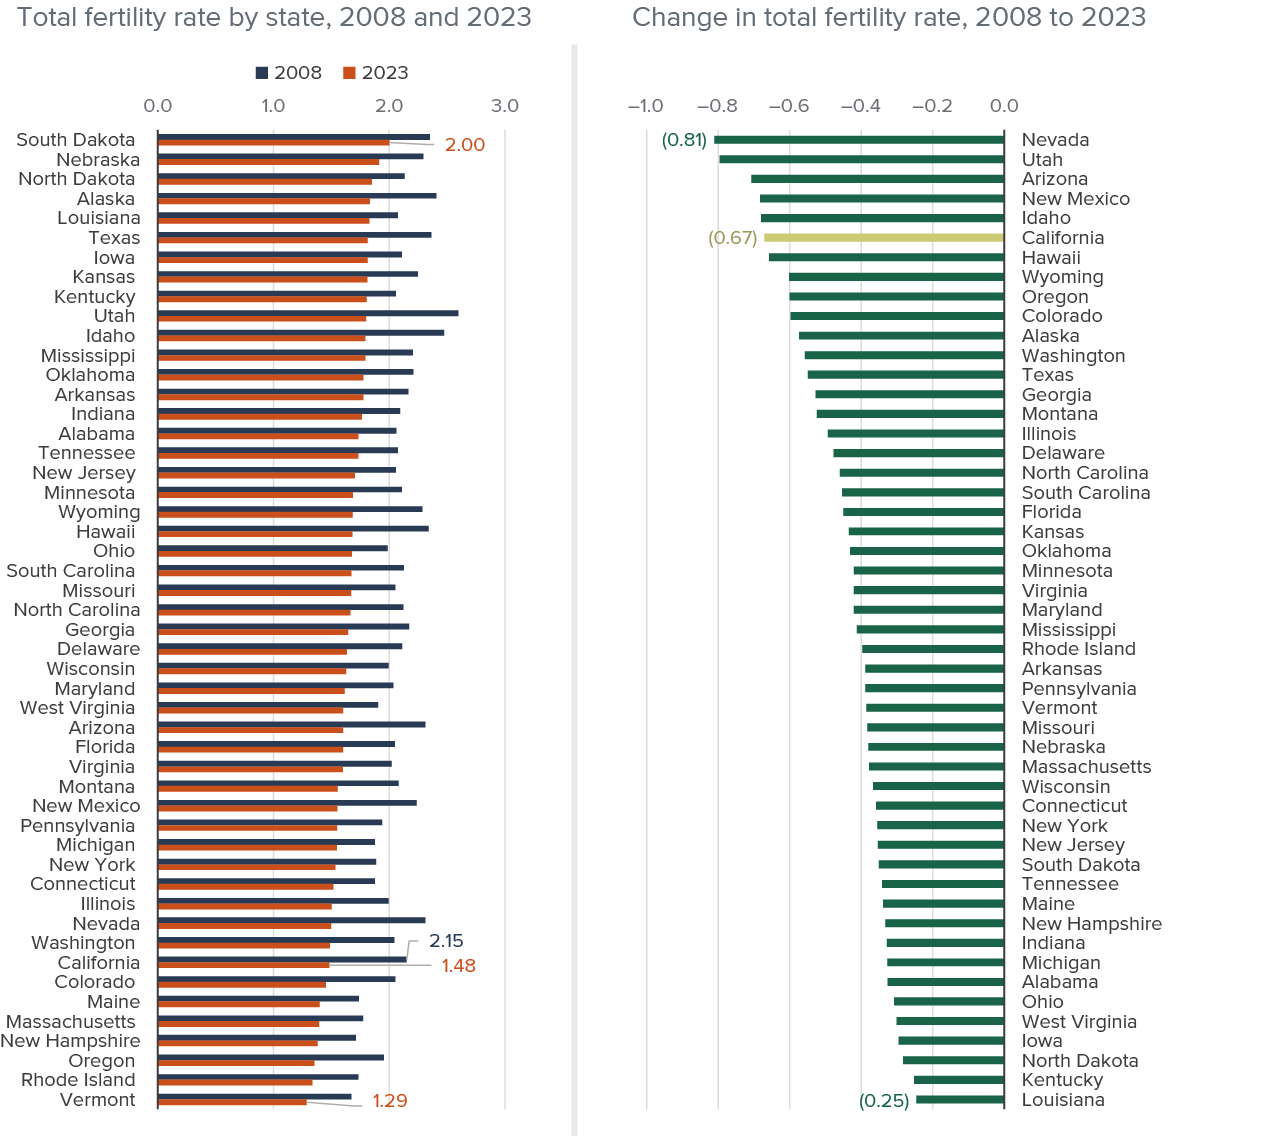
- The baby bust is not unique to California—birth rates have fallen in all states since 2008. California’s decline is slightly greater than the national average.
- Causes are multifaceted and not fully understood, but changing patterns around marriage, education, finances, housing, and birth control likely play important roles. By attaining higher education, women have gained higher wages but must weigh larger opportunity costs to having children; moreover, child care expenses have gone up, which adds to the financial cost of having children.
The implications of these changes are far-reaching. A smaller population can offer benefits: it reduces pressure on housing and infrastructure needs, easing congestion and reducing the need for expensive public works projects. The state’s housing market could soften, allowing more people to buy a home or find more affordable rent. A smaller population could also help improve the state’s environment, making it easier for the state to reach its climate goals. Given the state’s funding formula for schools, fewer children would mean more funding per student.
At the same time, fewer births—and a smaller population—may bring challenges: they could accelerate K–12 enrollment declines and strain the state’s economic and safety net systems as fewer workers support a larger share of older Californians. Labor shortages could also hinder California’s economic development. And to the extent that California’s population grows more slowly than other states, California could lose congressional representation.
Introduction
Birth rates are declining all over the globe, and California is no exception. California’s birth rates have fallen more than those of most other US states and now sit at the lowest levels on record. The recent decline to well below replacement level represents a notable shift that warrants reevaluating the state’s demographic future. With sustained low birth rates, California’s population growth may be sluggish for decades to come. During the heyday of rapid growth in the 20th century, most of California’s population gains came from migration—both international and domestic—with an important assist from natural increase (more births than deaths). Since 1990, natural increase and international migration fueled growth as domestic migration slowed and even reversed—more people moved out of the state than into it. In recent years, even natural increase has slowed: birth rates fell, deaths rose with the pandemic, and the population continued to age. Indeed, between 2020 and 2023—for the first time since records have been kept—the state lost population.
Birth rate declines have sparked a wide-ranging debate appropriate to such a foundational subject. The debate touches a diverse range of topics: income inequality and the safety net, workplace expectations, immigration, climate change, and gender roles, to name just a few. The focus of the discussion differs on the political left, right, and center, but all parts of the political spectrum are discussing it. Indeed, low population growth has far-reaching implications for California’s future, including possible changes to political representation in Congress, the size of the labor force, demand for infrastructure, the state’s environmental footprint, school enrollment, and even the sustainability of safety net programs for older Californians.
This report does not emphasize one narrative over others, nor even judge declining birth rates as positive or negative. The goal instead is to acknowledge the reality and significance of the change and explore its characteristics and possible explanations. The decline in birth rates is one of the most important developments of recent decades and will structure policy debates for decades to come. By carefully considering this change, this report offers empirical data to inform these debates.
In the sections that follow, we delve into the trends shaping California’s birth rates, explore the various factors influencing these changes, and consider implications for the state’s demographic future. Consistent with other research on birth rates, we frame the discussion in terms of how many children are born to women. This approach avoids double-counting children and does not reflect any judgment about gender responsibilities around child birth or child care. Nonetheless, the fact that women have traditionally shouldered more of these burdens is important for understanding the causes and consequences of birth rates, so our analysis acknowledges that fact where it makes sense to do so.
Trends in Birth Rates
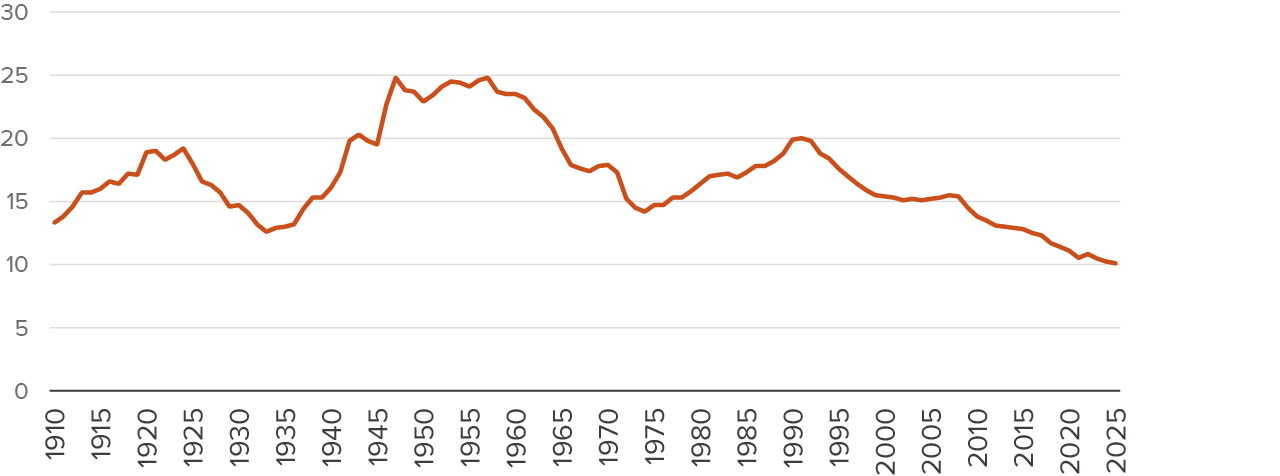
Historically, California’s birth rates have shifted dramatically, with distinct eras of higher and lower rates. The state’s crude birth rate, which measures the number of live births per 1,000 people, provides the longest historical record we have of these changes in birth rates.
After a peak in the 1920s and then a sharp decline with the Great Depression, birth rates in California began climbing after World War II. In 1960, at the height of the post-war baby boom, California’s birth rate peaked at 25 births per 1,000 residents, and then fell with the original baby bust in the 1970s to 14 births per 1,000.
Large inflows of young adult immigrants to California in the 1980s and 1990s led to a large increase, with the birth rate reaching 20 births per 1,000 in 1992 (Johnson and Hill 2002). Since then, the rate has plunged. By 2025, it had fallen by nearly half, to 10.1 births per 1,000 residents (see Figure 1).
Our focus is on the most recent decline, from 2008 to 2023. This decline is not merely a return to pre-boom levels, it represents a new low in California’s recorded history—and the speed of it is noteworthy. While birth rates have been on a general downward trajectory since the 1960s, the pace has accelerated since 2008 in California.
California’s birth rates have reached the lowest levels on record
Births per 1,000 population
SOURCE: California Department of Finance
NOTE: Chart shows crude birth rates, which is the number of births per 1,000 population for each year.
To gain a more nuanced understanding of these trends, we focus on age-specific birth rates and the total fertility rate. Total fertility estimates the average number of children a woman would have over her lifetime based on current age-specific fertility rates. Unlike the crude birth rate (births per 1,000 population), this measure provides a more accurate picture of fertility outcomes because it accounts for gender and the age structure of the population.
In 2007, California’s total fertility rate stood at 2.21 children per woman, slightly above the replacement level of 2.1 children per woman needed to maintain a stable population in the absence of migration. By 2023, it had dropped to 1.48 children per woman (Figure 2).
The significance of falling so far below replacement level cannot be overstated. It signals a fundamental shift in the state’s demographic trajectory. Indeed, the California Department of Finance projects that by 2038 deaths will exceed births in the state; by 2054, there will be 100,000 more deaths than births. This shift stands in sharp contrast to the mid- to late-2000s (2004 through 2009) when California had at least 300,000 more births than deaths each year.
California’s fertility rates have fallen sharply since 2007
Total fertility rate, 2000–23
SOURCE: California Department of Finance and National Center for Health Statistics
NOTE: NCHS and ACS report higher birth rates in 2008 than in 2007. Total fertility estimates the average number of children a woman would have over her lifetime based on current age-specific fertility rates.
Birth Rates Have Fallen among Younger Women
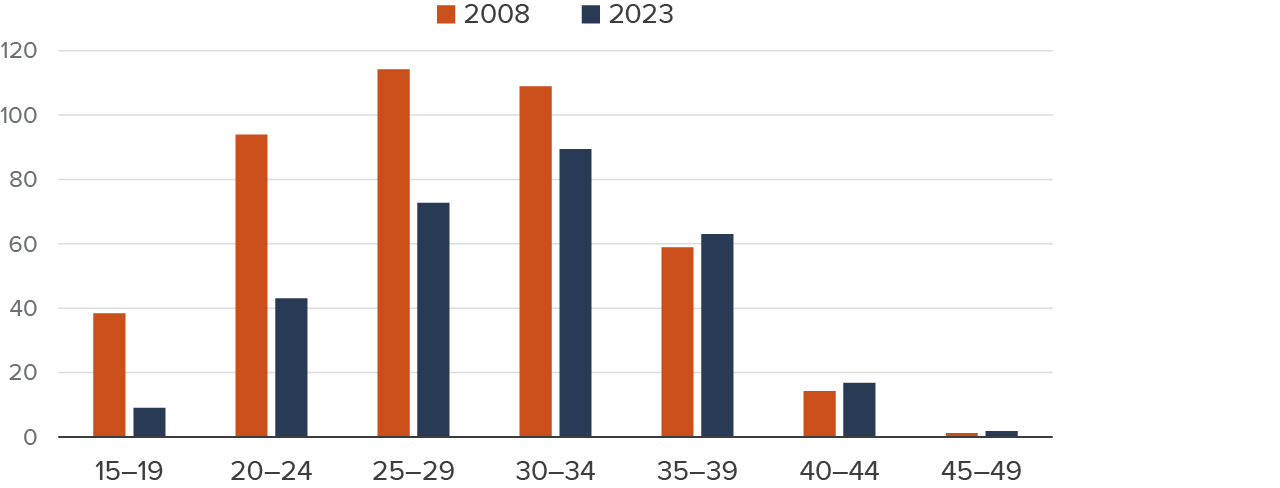
Birth rates have dropped sharply at young ages while rising slightly at older ages. Younger women in their teens and 20s have had the most dramatic absolute declines (see Figure 3).
For women aged 20–24, the birth rate fell by 54 percent: tumbling from 94 births per 1,000 women in 2008 down to 43 per 1,000 women in 2023. Women aged 25–29 saw birth rates drop by 36 percent: from 114 to 73 over the same period. Declines in these age groups are critical because prior to 2010, the majority of childbearing was among women in their 20s.
Notably, teen birth rates continued their downward trajectory. Once a public health issue of widespread concern, teen births are now rare. Teen mothers and their children often face significant economic and social challenges, and the drop in teen pregnancies likely contributes to better educational outcomes and economic prospects for young women in California.
In 1991, California’s teen birth rate was 74 births per 1,000 women aged 15–19. By 2023, this rate had plummeted to 9 births per 1,000 women aged 15–19, a decrease of nearly 90 percent. Such early childbirths disrupted progress in schooling and posed major burdens for young parents who were ill-prepared for such responsibilities. The sharp drop in teen births represents a major achievement in public health with positive implications for individual outcomes and for broader societal well-being.
California’s birth rates have fallen sharply among younger women
Age-specific birth rates, 2008 and 2023
SOURCE: Author’s calculations based on National Center for Health Statistics data
NOTE: Chart shows births per 1,000 women in each age group.
Birth rates have also fallen slightly for women in their early 30s. However, these women are now more likely to give birth than women in their late 20s, a reversal of the pattern just 14 years earlier.
The rise in birth rates among women 35 and older further underscores the trend towards delaying children. From 2008 to 2023, birth rates rose by about 7 percent among women aged 35–39. For women aged 40–44, the birth rate rose from 14 per 1,000 in 2008 to 17 in 2023. While these rates remain low in absolute terms, the upward trend is noteworthy. Nonetheless, the small gains after age 35 do not compensate for the large decreases in births among younger age groups.
Birth rates also vary widely by race/ethnicity and nativity
Historically, foreign-born women, particularly Latina women, have had higher fertility rates than US-born women. However, this gap has narrowed in recent years.
Among foreign-born Latina women, total fertility fell from 3.17 in 2008 to 1.95 in 2024, while among US-born Latina women it fell from 2.23 to 1.57 (Figure 4). Notably, fertility rates in Mexico, the primary country of origin for Latina immigrants in California, follow the same trend and level as observed among Latina immigrants in California.
Fertility rates also fell sharply among foreign-born Asian and Pacific Islander women, although not as much as among foreign-born Latina women. US-born Asian and Pacific Islander women continue to have very low birth rates, with fertility fluctuating around 1.5 for many years. Finally, birth rates also fell substantially among Black women and white women, and remain far below 2008 levels.
Birth rates have fallen for every ethnic group
Total fertility rates by race/ethnicity, 2001–2024
SOURCE: American Community Survey from IPUMS (Ruggles et al. 2025).
NOTE: Due to small sample sizes, we use a two-year moving average for Black women and US-born API women. Charts show total fertility rates, which estimate the average number of children a woman would have over her lifetime based on current age-specific fertility rates.
Declines Are Not Unique to California
An important question is whether the decline in birth rates is unique to or greater in California than elsewhere. It seems plausible that the state’s high cost of living, and in particular, its low homeownership rates, might be impediments to the larger family sizes of the past. Although California’s birth rates have fallen more than those in the rest of the nation, after we adjust for some basic demographic characteristics, California does not stand out from most other states or the rest of the nation.
Perhaps the most striking feature of the current baby bust is how ubiquitous it is. Birth rates are falling across all 50 states (Figure 5) and throughout most of the world (World Bank, n.d.). Birth rates fell in every single state within the United States from 2008 through 2023. By 2023, birth rates were below the replacement level in all 50 states. Nationally, the total fertility rate fell from 2.1 in 2008 to 1.6 in 2023; in California, the rate fell from 2.2 to 1.5.
Fertility rates fell in every state, and no state has rates above the replacement level
SOURCE: National Center for Health Statistics
NOTE: Charts show total fertility rates, which estimate the average number of children a woman would have over her lifetime based on current age-specific fertility rates.
The widespread nature of the fertility decline challenges any California-specific explanation, such as the high cost of the state’s housing, and suggests that wider forces are at play. While homeownership rates are relatively low in California, the relationship between housing and birth rates is complicated. Higher housing prices may discourage adults from forming a family or raising children; but houses also increase wealth, which may lead homeowners to opt to have more children.
For example, one study found that rising housing prices led to a slight net gain in birth rates as homeowners had more children due to increased home equity, offsetting a modest decline in birth rates among renters. Other research has found higher housing prices reduced birth rates among renters but not homeowners (Dettling and Kearney 2014).
Across states, there is little correlation between changes in birth rates and housing costs (Kearney, Levine, and Pardue 2022). Indeed, states with larger fertility declines than California—Nevada, Utah, Arizona, Idaho, and New Mexico—all had relatively low housing costs. Future research is needed to more precisely understand the role of housing costs—and cost of living more generally—on California’s birth rate trends.
One factor is common in states with large declines: all have relatively large Latina populations. In California and across the country, birth rates among Latina women fell the most of any race or ethnic group. Moreover, if California had the same demographics as the rest of the country, its decline in birth rates would nearly mirror the national rate.
Compared to the nation, Latina women in California had a slightly larger decline in total fertility (-.64 fewer children per woman nationally vs. -.75 fewer children per woman in California), as did white women in California (-.24 vs. -.28). However, Asian and Pacific Islander women in California had a slightly smaller decline (-.43 nationally vs. -.41 in California).
Recent Generations Have Fewer Children and Have Them Later
Finally, it is important to remember that we base our analysis on the current birth rates for specific ages. But the fertility rate for any generation, or cohort, of women won’t be known until they reach 45, the oldest age traditionally considered a part of the childbearing years. If women ultimately have the same number of children as past generations but do so at a different stage in their lives, it would not be reflected in our analysis so far.
Recent generations of women may wait until their 30s or 40s to have children, which may spike future birth rates. Nonetheless, biological constraints make it difficult to have children at older ages. To date, increases are very small in age-specific birth rates for women 35 and older, and nowhere near the magnitude of the declining rates for women under 35 (see Figure 3, earlier).
To explore this question, we use the June Current Population Survey from the US Census Bureau to look at completed fertility for cohorts as women grow older. Nationally, women born after 1985 are on lower trajectories and not likely to reach the completed fertility of women born before 1985 (see Technical Appendix Figure B2). Notably, no cohort born since 1970 has had enough children to reach replacement level fertility rates.
When we zoom in to California, we see some notable patterns. First, women born in the early 1980s had fewer children in their 20s, but similar numbers of children (just under 2, on average) by the time they reached 40 (Figure 6). Each successive cohort born since 1985 has had even fewer kids in their 20s.
Recent cohorts have had fewer children in their 20s
Average number of children by birth cohort and age
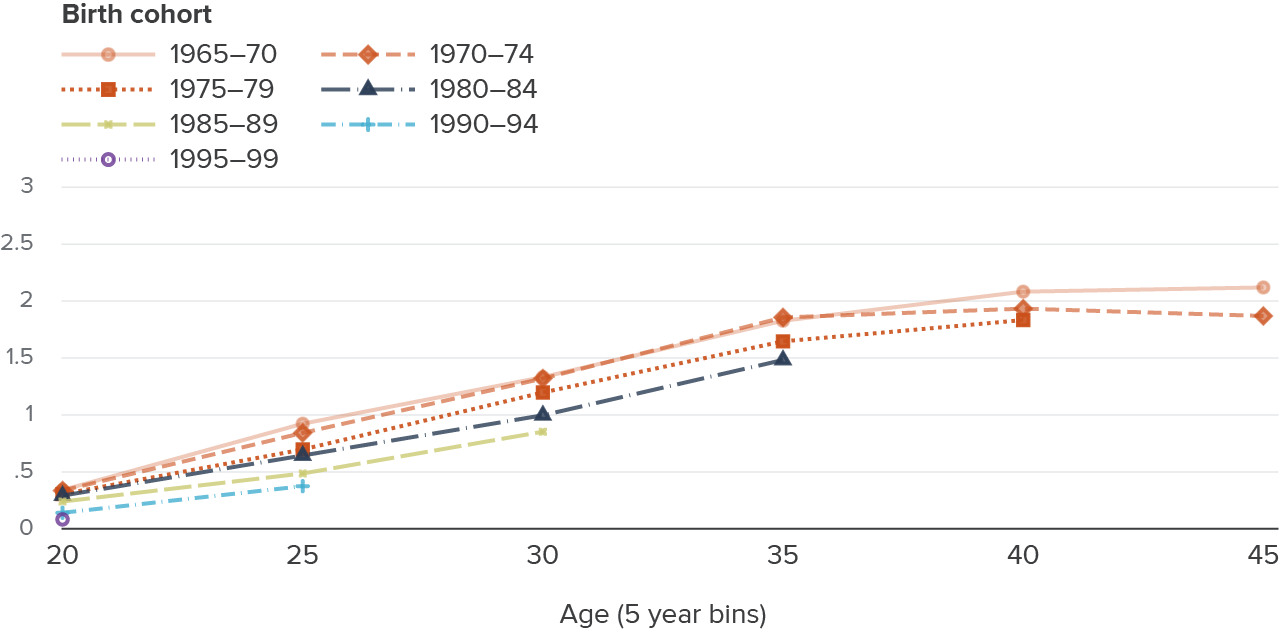
SOURCE: Current Population Survey, June Fertility Supplement.
NOTE: Average number of children ever born to women, by age and birth cohort. Ages grouped into five year bins, with listed age as midpoint (i.e., age bin 20 covers ages 18–22). California-specific subsample. Data through 2024.
The pattern is similar when we look at the share of women who had any children by certain ages (Figure 7). By age 25, roughly 50 percent of women born in the late 1960s and 1970s ever had children; the share dropped to under 30 percent of those born in the late 1980s and 1990s. At the same time, the 1980s cohort caught up by their late 30s and late 40s: a similar share had children but did not have a similar number of children as the earlier cohorts. Whether—and the extent to which—this pattern of delayed childbearing occurs with recent cohorts will influence overall birth rates in the coming years.
Recent cohorts are less likely to have had any children in their 20s and early 30s, though gaps with older cohorts close slightly in their 30s
Percent with any child by birth cohort and age
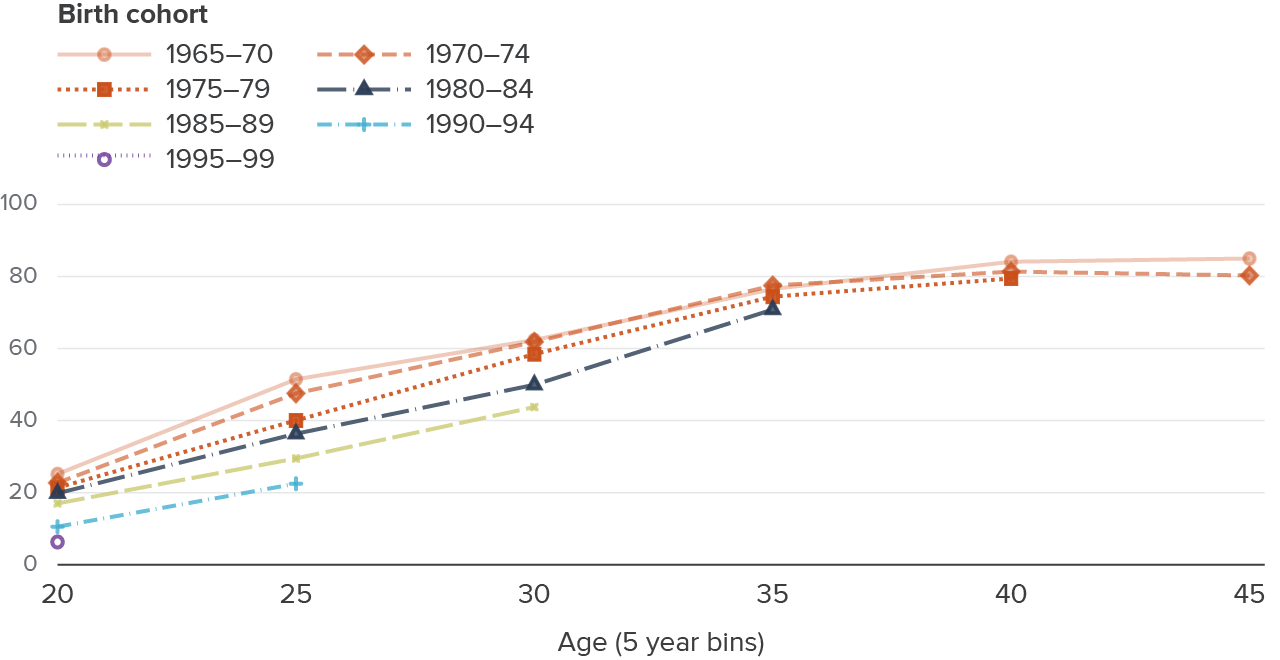
SOURCE: Current Population Survey, June Fertility Supplement.
NOTE: Share of women with any child born to them, by age and birth cohort. Ages grouped into five year bins, with listed age as midpoint (i.e., age bin 20 covers ages 18–22). California-specific subsample. Data through 2024.
Why Are Birth Rates Declining?
The decision to have children, and how many children to have, is a personal one and reflects the preferences of individuals and couples. Even so, those decisions are made within a larger economic and societal context that influences individual choices. Public health policies, including access to birth control and abortion, also play a role.
A key consideration is the status of women, their increasing opportunities for education and employment, and access to effective means of family planning. The costs of having children, including child care, schooling, and lost work opportunities have long been identified as important determinants of family size.
For example, the baby boom that started in the late 1940s occurred as women faced widespread workplace discrimination and had fewer educational opportunities than men. A booming economy and low opportunity costs to motherhood for women (who faced discriminatory barriers to labor force participation) led to high birth rates.
The subsequent baby bust of the 1970s occurred as cultural and political movements led to greater opportunities for women. Women’s educational and economic opportunities were growing, and more effective birth control (as well as the nationwide legalization of abortion) allowed women to pursue opportunities outside the home and have more control over their reproductive lives.
The most recent decline in fertility began with the Great Recession in 2008, initially consistent with past empirical evidence that economic uncertainty and downturns lead to reduced childbearing (Sobotka et al. 2011). However, continued declines, even after the recovery from the recession, point to other non-economic factors playing important roles.
Economic, Social, and Cultural Shifts Likely Contribute to Changes
For the most part, research has pointed to household economics and social norms as the main factors behind broad changes in fertility from the baby boom to the baby bust (Kearney et al. 2022; Doepke at al. 2023; Thomson and Goldman 1987; Becker 1981; Becker and Barro 1988). Biological constraints can be an important factor also, especially as decisions to have children get pushed into older reproductive ages. But understanding changes in birth rates is not always straightforward because the factors that lead to having children (or not) are complex and intersecting.
Recent fertility declines in developed countries, including the United States, are not fully explained by conventional economic and social factors (Kearney et al. 2022; Doepke at al. 2022). In their analysis of recent fertility declines in the United States, Kearney et al. conclude that “we do not have solid evidence of US-specific policies or economic factors that can explain the depth of that decline and the way it extended through the entire business cycle up through the arrival of the pandemic recession in 2020.”
They further state that they suspect the decline “reflects broad societal changes that are hard to measure or quantify” and that possibilities include “broader career options (and other aspirations) for women, and shifts in the nature of parenting.” Notably, attitudes about desired family size do not seem to account for the change (see text box).
Other societal factors have been offered to explain declining fertility—and have some empirical support, including attitudes related to climate change (Dillarstone, Brown, and Flores 2023) as well as declining social cohesiveness and mental health (Platt and Sterling 2024). To that final point, the former US surgeon general issued an advisory on the mental health and well-being of parents, noting that the “modern practice of time-intensive parenting and contemporary expectations around childhood achievement may contribute further to the stressors faced by parents.” The former surgeon general further identified an “urgent need to better support parents, caregivers, and families.” (Office of the US Surgeon General 2024)
Finally, access to health care—including abortion, birth control, and ART (assisted reproductive technology)—also plays a role. Notably, the Affordable Care Act required health insurance plans to provide contraception with no out-of-pocket cost starting in 2012. Access to free contraception included long-acting reversible (LARC) contraceptives, which are highly effective but can be expensive. Use of LARC methods has skyrocketed in recent years and is highest among women 20–29 years of age.
Technology has also allowed more women to have children. Nationwide in 2022, over 98,000 infants were born through the use of assisted reproductive technology (primarily in vitro fertilization (IVF)). That accounts for 2.7 percent of all births in 2022 (total births: 3.7 million).
Births are also affected by abortion policies. States that have adopted complete or six-week abortion bans have seen a 1.7 percent increase above expected births (Bell et al. 2025).
Californians Are Getting Married at Later Ages
One fact that is well established: childbearing and marriage are strongly connected. In California, 72 percent of births were to married women in 2022, the same level as in 2008. Women who are married have much higher birth rates than other women (Figure 8). Of course, people often jointly decide on marriage and childbearing. Marriage does not necessarily cause higher birth rates as much as it reflects that people who want to have children often choose to get married. That is, wanting to have children can lead to marriage as much or more than getting married can lead to wanting to have children.
Birth rates are much higher for married women
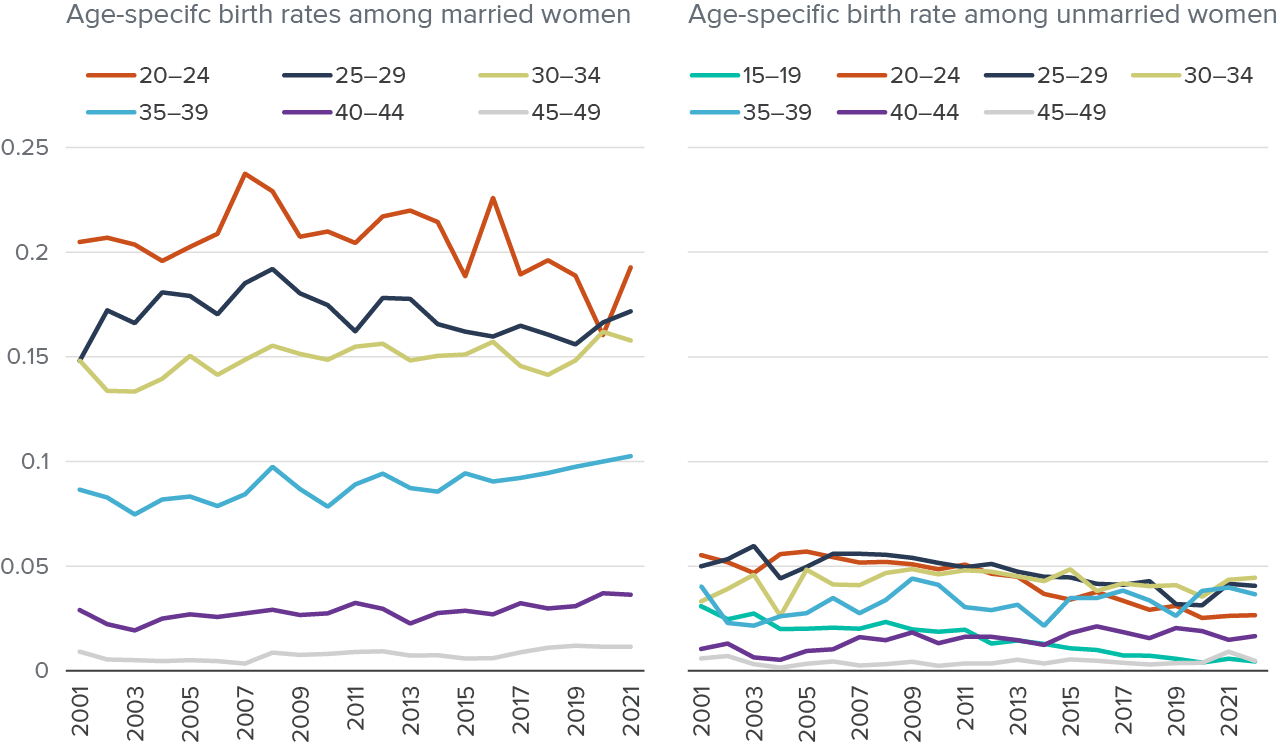
SOURCE: Authors’ calculations based on IPUMS American Community Survey data (Ruggles et al. 2025).
NOTES: The vast majority of “ever married” women are currently married. Chart shows proportion of women in each age group who gave birth in the last year.
Since 1960, age at first marriage has climbed for California women, from 19 years old to 31 years old in 2020 (see Figure 9). Especially pertinent to our analysis of recent trends in birth rates, age at first marriage has risen faster in the past 20 years—from 25 to 31—than at any other time since 1900. Today, the majority of women in their 20s are not married, and only about half of women in their early 30s are married—ages at which birth rates have historically been highest. Over half of California’s fertility decline since 2008 can be attributed to later age at marriage.
The trend of delaying marriage to an older age is even more pronounced among Latina women in California, the group that has the highest birth rates as well as the sharpest decline in birth rates. In 2022, the median age for US-born Latina women to first marry was 33; for foreign-born Latina women, the age rose from 23 in 2006 to 30 by 2022. Median ages at first marriage among men have also increased.
Median age at first marriage has increased dramatically
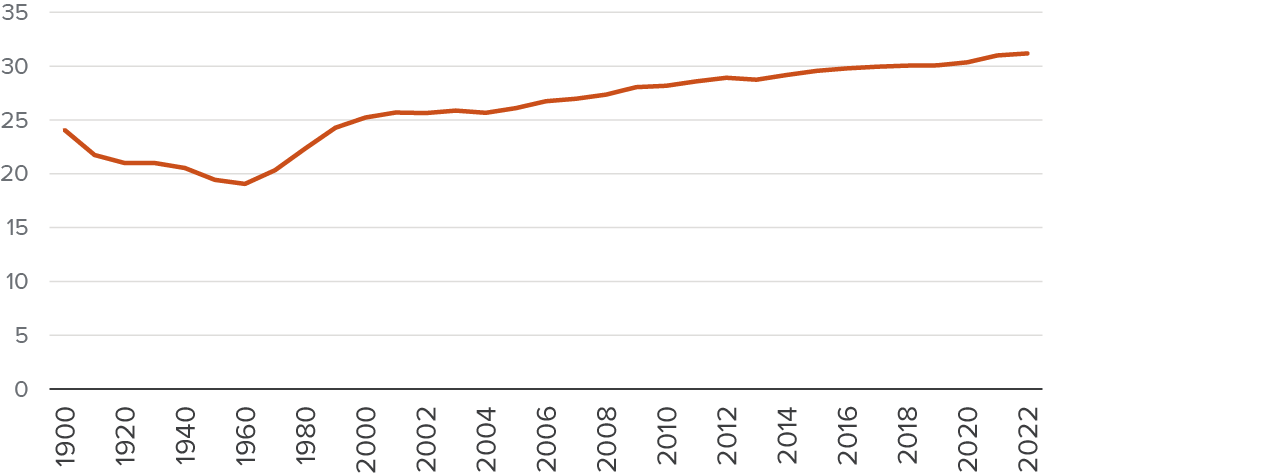
SOURCE: PPIC-based decennial censuses and the American Community Survey from IPUMS (Ruggles et al. 2025).
NOTE: Chart shows age at which half of women are ever-married. The pattern is similar for men, but with a slightly higher median age.
More Women Than Men Now Go to College
This delay in marriage and family formation reflects broader societal changes. The pursuit of higher education, the importance of careers for women and men, changing social norms, and economic factors all contribute to this trend. Moreover, educational attainment has reversed its patterns by gender: women once trailed well behind men but are increasingly outpacing men with respect to enrolling in and completing college (Figure 10).
Educational attainment has increased for California women ages 25–44
Share with a college degree (%)
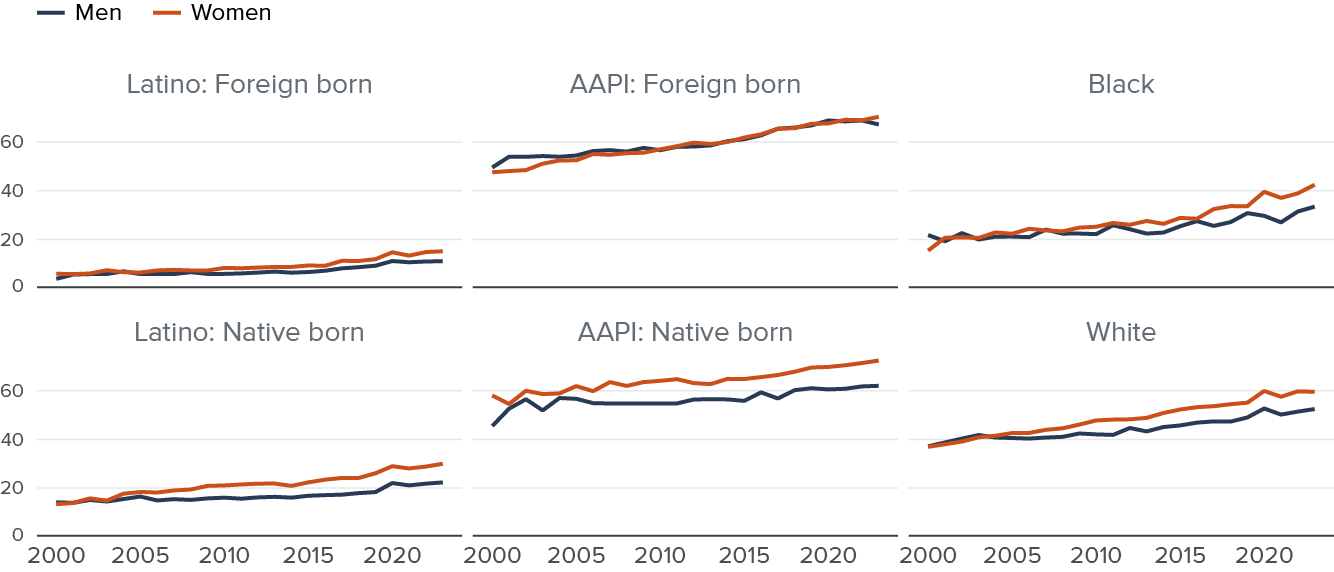
SOURCE: IPUMS Census and American Community Survey data (Ruggles et al. 2025).
NOTE: College degree includes bachelor’s and graduate degrees. Limited to ages 25 to 44 not living in group quarters.
One anomaly stands out in the trends: fertility rates are lower for more educated women, but the decline is steeper for less-educated women. Women with a BA or higher born in the 1960s–80s have consistently averaged 1.2 children by age 35 (see Technical Appendix Figure B5). Women without a BA born in the 1960s and 70s averaged 2.1 children by age 35—the average has dropped closer to 1.7 for those born in the 1980s (Technical Appendix Figure B6). In other words, the rising number of women who now earn a degree may partly explain why fertility has declined, but the decline is also due to women without degrees having fewer children (and a smaller gap in fertility between those with and without higher education).
Implications and Policy Considerations
Looking ahead, these trends raise important questions about California’s demographic future. On the one hand, if current patterns persist, the state may face challenges related to fewer children, an aging population, potential labor shortages, and changes in the consumer economy. On the other hand, slower population growth could provide more funding per student if the state’s overall budget continues to grow; reduce demand for and on the state’s infrastructure, including housing; and make long-term environmental goals easier to achieve.
Lower birth rates will likely continue, according to recent population projections from the California Department of Finance, ushering in an era of exceedingly slow growth rates. Total fertility rates fell to 1.48 in 2023, with forecasts that rates will remain mostly unchanged to 2050 (slowly declining to 1.44 by 2050). Natural increase— the main source of population growth since 1990—will lose influence, and California will reverse to “natural decrease” by 2038, as deaths exceed births. In turn, if California’s population grows more slowly than the rest of the country, the state will likely lose a seat (or more) in the House of Representatives at the time of the 2030 census reapportionment.
However, it is crucial to approach projections with caution. The baby bust of the 1970s did not last, with birth rates rising steadily in the 1980s and reaching above replacement-level fertility until just 16 years ago. Even so, that increase was fueled by a large influx of young immigrants, as well as peak birth years for the young adult Baby Boomers, a pattern that seems unlikely to repeat. More broadly, lower birth rates could still coincide with a growing California population, depending on changes in international immigration and domestic migration.
Declining School Enrollment Is the Most Immediate Consequence of Lower Birth Rates
The broader economic and fiscal implications of lower birth rates may not materialize for decades. Yet more immediate are the implications for public schools: demographic projections suggest that California’s school enrollment will fall by roughly 630,000 students (11%). By 2038, projected enrollment will be below 5 million, a level last seen in 1990, and far below the peak of 6.2 million students in the early 2010s.
These projected declines are largely driven by smaller cohorts of students born in California. While births have fallen in the past decade, the impact on public school cohorts operates at a lag: the age 5 cohort has only recently started shrinking, while the age 15 cohort projects to be similar in size through 2030 before any declines occur.
Based on actual or projected data on births in earlier years, we see substantial declines in cohort size for TK–12 (see Technical Appendix Figures B8 and B9). If projections hold, the 2038 cohort will include fewer than 6 million students who were born in California, compared to over 7.2 million today.
What does this mean for schools? Most notably, a smaller system means schools must downsize, as funding is determined per student. Falling enrollment can also lead to school closures, depending on whether facilities fall below occupancy levels that make fiscal sense for a school district to operate.
There is a silver lining, however: California’s Proposition 98 means that schools are funded out of a roughly constant share (about 40%) of the state budget. If the state’s economy continues to grow—and with it, the state budget—fewer students will mean higher per student funding (Lafortune, Ugo, and Guinan, 2025). More broadly, fewer children per capita in California could mean that the state can invest more per child, across education, safety net, and other public services.
A Smaller and Older California Brings Economic and Policy Challenges
Another clear implication will be the size of the state’s workforce in the face of an aging population. A sustained decline in birth rates translates to a smaller working-age population in the future. This demographic shift could lead to labor shortages, potentially impacting economic growth, innovation, and the state’s competitive edge in various industries. However, this depends on productivity growth; advances in productivity could outweigh population declines and an aging population to bring continued economic growth.
One hypothesis is that AI adoption may improve productivity and bolster economic growth even absent population growth. Another suggests that investing more in youth—for training and/or postsecondary education—could overcome the challenge of having a smaller share of workers relative to the overall population (e.g., Myers 2013). Importantly, these hypotheses presume today’s immigration patterns hold. Increased future immigration could easily offset birth rate declines and support a stable or growing workforce.
A smaller working-age population also raises questions about the sustainability of health systems and social programs, for several reasons. First, a smaller workforce relative to the population size means that fewer workers support the existing state safety net system. Without higher productivity and earnings, this could require raising taxes, reducing benefits, or cutting other public programs. Second, health care needs become more expensive with age—an aging population may demand extra funding to support. Third, California’s care sector is labor intensive, but its workforce is also aging, with nearly 40 percent over 55 years old (McConville, Payares-Montoya, and Bohn 2024).
What Can—and Should—California Policymakers Do?
Whether and to what extent public policies, and state policy in particular, can meaningfully influence birth rates is unclear. Childbearing reflects deeply personal choices among women and their families, choices that also are influenced by economic opportunities (or constraints), broader economic forces, and multifaceted social and cultural dynamics. Indeed, some of the recent declines appear to be associated with greater opportunities and empowerment among women to make their own choices about childbearing, careers, and families.
Family-friendly policies may help. The high cost of living in California and the difficulty of balancing career needs and aspirations with child care influence childbearing decisions. For example, Scandinavian countries have among the most generous social welfare policies for parents, including extended time off with pay for both newborns and school-age children and state-funded, high-quality child care. In these countries, gender equality is greater than in most developed countries. But while fertility rates are higher in Scandinavia than in most of Europe, levels are still below replacement and have been falling. While these policies have the potential to influence fertility rates, their fundamental impact is to improve family well-being.
To the extent the trends in California reflect delayed fertility but not declines in desired family size, public health policies could have an impact. Wider availability of fertility treatments like in-vitro fertilization could make it possible for women to start families later in life. Evidence from Sweden finds that health insurance coverage for IVF increases take-up and births, with larger effects for lower-income women (Bogl et al. 2024).
Yet in the absence of strong evidence for actionable state policies, California policymakers need to plan for adjustments in a future with lower birth rates and slow or negative population growth. Rather than viewing these changes through a simplistic lens of “good” or “bad,” it’s crucial to recognize them as part of a broader societal transition. For example, adopting policies that delay retirement, increase immigration, and improve the productivity of young workers (e.g., focused increases in education and training) could help manage the challenges of a growing dependency ratio.
By embracing a nuanced understanding of demographic change, California can chart a course towards a future that honors individual choices, supports family well-being, and ensures the continued vitality and innovation that have long been the state’s hallmarks.
Topics
Health & Safety Net Immigrants in California K–12 Education Population