

- California’s voter registration rate has remained fairly consistent over time.
According to the Secretary of State, 17.8 million of the 24.3 million eligible California adults were registered to vote just before the 2014 general election. The share of eligible adults who are registered—currently 73%—has not varied much in recent years. PPIC Statewide Surveys find that younger, low-income, and Latino eligible adults have lower registration rates. - Low trust in government is the top reason for not registering.
When we ask eligible Californians who are not registered to vote to tell us why, 30% cite a lack of confidence in elections and politics; fewer mention lack of interest (24%) or time or schedule constraints (17%). Men and those without any college education are the most likely to cite a lack of confidence in elections as a reason for not registering to vote; younger Californians are more likely to cite lack of interest.
Voter registration
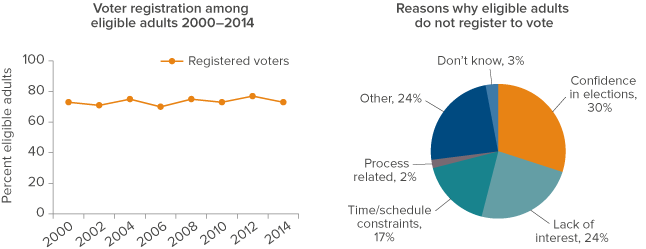
SOURCES: California Secretary of State, Historical Voter Registration and Participation in Statewide General Elections 1910–2014, and Historical Voter Registration and Participation in Statewide Primary Elections 1914–2014. PPIC Statewide Surveys from March and May 2015 including 3,412 California adults.
- Record-low shares of California’s registered voters turned out in 2014.
Turnout in both the June primary (25%) and the November general election (42%) was at a record low. Continuing a recent trend, primary election participation declined 8 percentage points from the June 2010 gubernatorial primary. General election turnout fell 13 percentage points from the November 2010 gubernatorial election—and it was low even for an off-year election. Since the 2008 presidential election—the recent high-water mark—primary turnout has declined 33 points and general election turnout has declined 37 points. - Lack of interest and time constraints are the top reasons for not always voting.
Among registered voters who say they do not always vote, 36% cite a lack of interest in politics, elections, or candidates, and 32% mention time or schedule constraints. Fewer cite a lack of confidence in elections (10%) or process-related reasons (9%). Latinos are more likely than whites to mention time constraints, while whites are more likely than Latinos to cite a lack of interest. Older people are less likely than younger adults to name time constraints. Registered voters in Orange and San Diego Counties who do not always vote most often cite lack of interest, while those in the Central Valley name time constraints.
Voter turnout

SOURCES: California Secretary of State, Historical Voter Registration and Participation in Statewide General Elections 1910–2014, and Historical Voter Registration and Participation in Statewide Primary Elections 1914–2014. PPIC Statewide Surveys from March and May 2015 including 3,412 California adults.
- Californians see low voter participation as a problem.
Most Californians (84%) say it is a problem that many people who are eligible to vote in elections don’t always do so. At least half across parties, regions, and demographic groups say it is a big problem, with blacks (82%), Democrats (66%), those 55 and older (65%), and the more affluent (65%) among the most likely to hold this view. - Solid majorities support automatic voter registration.
Secretary of State Alex Padilla—who set a goal of boosting voter participation by one million in his first term—has sponsored AB 1461, which would automatically register every eligible citizen who visits a DMV office to obtain or renew a driver’s license. Seven in 10 Californians (69%) and two in three likely voters (67%) favor this proposal. Support for this proposal is widespread, with more than six in 10 across regions and demographic groups in favor. Strong majorities of Democrats (79%) and independents (66%) support the idea, while Republicans are divided (49% favor, 48% oppose). - Californians also favor sending vote-by-mail ballots to all voters.
Secretary Padilla has also sponsored SB 450, which would mail every voter a ballot, expand early voting, and enable voters to cast a ballot at any voting center in their county. When asked about the idea of sending a vote-by-mail ballot to every registered voter, seven in 10 Californians (70%) and two in three likely voters (66%) are in favor. Democrats (76%) are the most likely to favor this proposal, followed by independents (67%) and Republicans (58%). More than six in 10 across regions and demographic groups are supportive.
Measures to boost voter participation
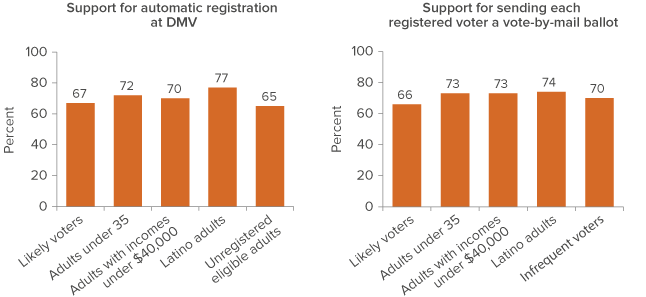
SOURCE: PPIC Statewide Surveys from March and May 2015 including 3,412 California adults.
Related Content
California Voter and Party Profiles
California’s Likely Voters
California’s Independent Voters
Millennial Voters and California Politics
Race and Voting in California
Topics
Political Landscape Statewide Survey