

Despite several reforms and new education investments in the last decade, California’s education leaders continue to grapple with fundamental questions about how the state’s school children are faring and how best to deploy education funding. Student outcomes fall far short of expectations and longstanding achievement gaps have persisted, widened further by the pandemic and elevated rates of chronic absenteeism. State investments in instruction and support are promising but have distance to close before all students leave high school ready for what’s next. And ongoing enrollment declines and economic uncertainty add additional pressures around resource allocation.
The Fundamentals
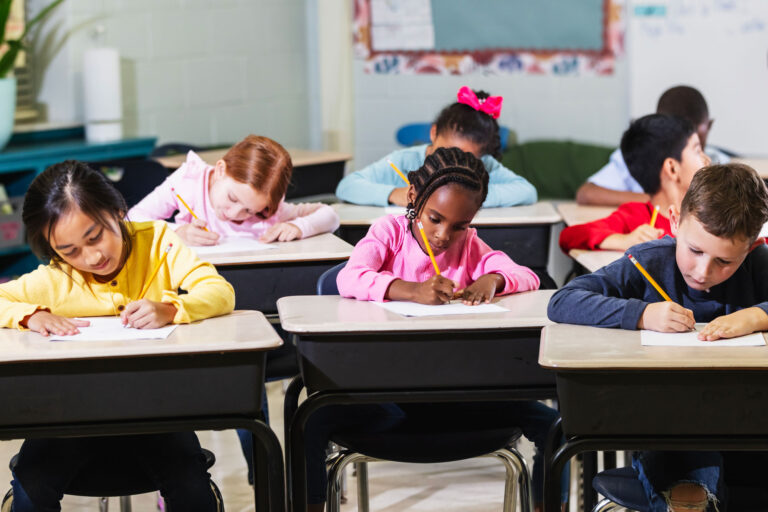
California public schools serve a diverse population of nearly 6 million children (close to 60% Latino, 20% white, 10% Asian, and 5% Black). More than a third are multilingual learners and 64% are socioeconomically disadvantaged. Most students attend traditional public schools across the state’s approximately 1,000 school districts; 13% attend charter schools. California is a local control state, meaning that districts have some flexibility to determine spending priorities. About half of school funding comes to districts based on a weighted student formula that allocates additional funding for students who are low income, English Learner, or foster youth.
Key Issues
Test scores paint a bleak picture of student learning. Test scores are just one way to measure student outcomes, but an important one. Performance on state assessments had been improving before the pandemic, but average scores have yet to recover from the pandemic dip. Currently, fewer than half of 4th graders meet the state standards in English language arts, and just 37% do so in math.
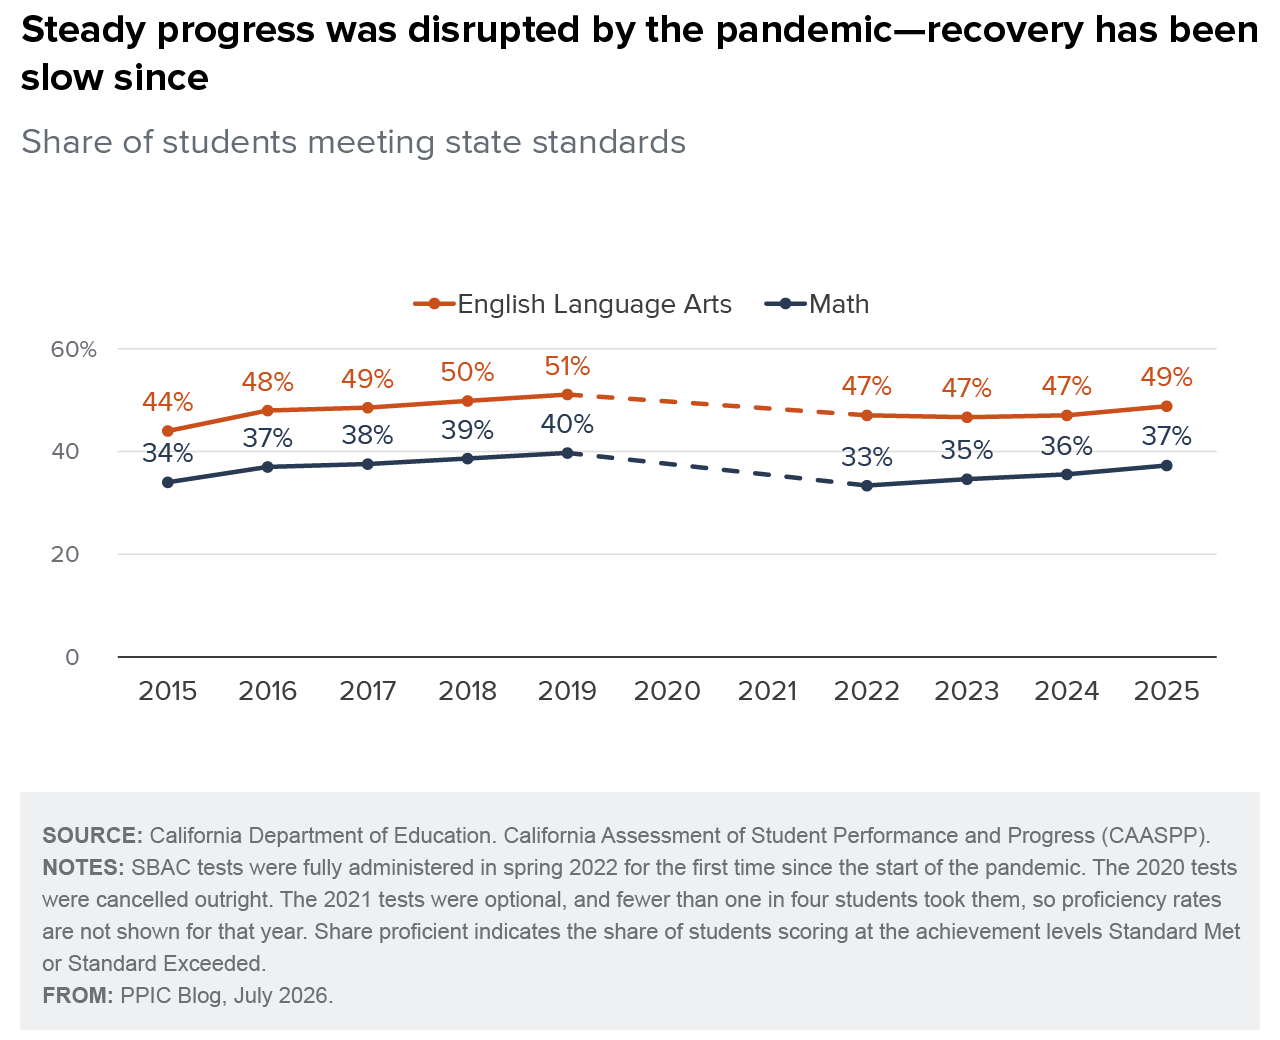
Gaps between race/ethnic groups, by socioeconomic status, and between top and bottom scoring students are widening. Gaps in other outcomes—such as college preparation, high school graduation, and college enrollment—are also large. Relative to the rest of the country, California has been making progress, but more recent improvements have been mostly because of worsening outcomes in other states.
The state has made tremendous investments in PK–12 education over the last decade. Current per pupil spending increased by 75% from 2012–13 to 2023–24 (after accounting for inflation), and recent state budgets suggest that increase will continue. These investments have helped California move from below the national average to 16th out of the 50 states and DC in current spending, although we rank 31st when labor costs are considered. California’s weighted student formula determines how most state dollars are distributed to school districts, but the state provides funding for a few specialized programs such as school facilities, the extended learning opportunities program (ELO-P), special education, and community schools. Federal dollars account for roughly 6% of all school funding in most years.
Declining enrollment will continue to challenge most districts. Falling birthrates, a trend since the early 1990s and projected to continue, are likely to drive additional enrollment declines. Lower rates of net migration also contribute to enrollment decline, while contributions from private and homeschooling explain only a small share. Ongoing enrollment declines may compel districts to consider school consolidation; research finds school closures are more likely to impact the most disadvantaged students. There is one bright spot: due to state constitutional minimum spending on PK-12 education, falling enrollment will mean even higher spending per student, so long as the state budget grows or remains stable.
Locals decide, state provides. The state’s role in education is currently hotly debated. The state’s funding formula, along with several other programs, provide additional dollars for students with greater needs—but these funds flow to districts, not directly to students or schools. Not all districts target these extra funds based on need, and how they distribute funds to school sites and student programs matters for student outcomes. Requiring districts to target student need may boost equity but is in tension with the principle of local control.
Most decisions about school organization and curriculum are also determined at the local level. This means that a number of programmatic decisions are only evaluated at a local level, if at all. And it means that for some programs, such as English Learner instruction, student eligibility varies by district, likely slowing the progress of many. In some cases the state is more prescriptive, as with the recently adopted early literacy policy.
Looking ahead
What can the next governor do to improve outcomes and close gaps among schoolchildren in California? Despite steady investments and evidence of improvement, academic progress over the last decade has not led to large increases in the share of students meeting state standards. For older students, who have fewer years left in K–12 schools, continued progress may still leave earlier losses only partly addressed. Many current investments would likely be improved by evaluation and refinements, such as the weighted student formula, transitional kindergarten, the Expanded Learning Opportunities Program, and the Golden State Literacy Plan.
The next governor’s key challenge? To steer a course toward quicker, broader, and more durable improvements in student outcomes. Recent reforms to the role of the state superintendent and new investments in the state’s Cradle to Career data system should help make implementation and evaluation more coherent and comprehensive.
Topics
absenteeism English Learners enrollment K–12 Education Local Control Funding Formula major issues for next governor per pupil spending Population Poverty & Inequality public schools school districts school funding state budget test scoresLearn More

Enrollment Is Falling across California’s School Districts

College Readiness in California

California’s K–12 Test Scores

Chronic Absenteeism in California

California’s K–12 Students
