

Table of Contents
Key Takeaways
Access to high-quality early care and education matters for both parents’ employment and children’s later life success. Focusing on children up to age five, we examine the shifting landscape of publicly supported child care in California with twin goals of understanding costs for families and sustainability for providers. This assessment is timely, as the state is taking important steps to implement its 2020 Master Plan for Early Learning and Care, including expanding transitional kindergarten (TK), adding subsidized child care slots, and reforming the approach to setting reimbursement rates for subsidized care.
- Child care is expensive. Full-time preschool care in a family home or center ranges from 6 percent to 18 percent of median household incomes across California counties, and costs are even higher for infant care. Although state and federal support to help families afford child care has nearly tripled over the past decade, many programs serve far fewer children than are eligible. →
- Perceptions about affordability vary, according to focus groups and surveys with families, providers, and child care professionals. Most professionals who match families with providers note the affordability of subsidized care has improved recently. But access varies. Over 75 percent say families can find affordable care for preschoolers but that it is harder to find for infants. In focus groups, providers indicate that families needing care for non-traditional hours and children with special needs face challenges. →
- The overall number of early care and education seats is now 6 percent higher than before the pandemic. This increase is due to modest growth in the supply of home-based child care (starting in 2023) and greater growth in TK enrollment (starting in 2022). Supply varies geographically, with the lowest-income regions seeing the lowest licensed child care supply relative to their populations. Despite increases in subsidized rates that outpace inflation, subsidized providers report that the reimbursements they receive have not kept pace with rising costs. →
- Closely monitoring these trends in the child care system will be critical. The pandemic hit child care programs hard, but federal and state funds helped to support providers and reduce costs for families during the crisis. Since then, TK expansion has created a free preschool option for all four-year-olds, which is a potential benefit for families but has led to disruptions for many providers. Meanwhile, a declining child population is reducing the overall disparity between child care needs and supply, though the availability of care may remain a challenge for some families. →
Introduction
Policy interventions to increase participation in high-quality early care and education (ECE) among low-income children can lead to immediate and longer-term benefits for children and parents (Currie and Rossin-Slater 2015; Herbst 2023). Perhaps because of child care’s importance—and cost—three-quarters of Californians say they favor increasing government funding so that child care programs are available for more lower-income working parents (Baldassare et al. 2024).
California is in the final stages of three major initiatives that reflect significant investments in publicly funded child care and should improve affordability for families and sustainability for providers. First, transitional kindergarten (TK)—a full year of preschool delivered through the K–12 public schools at no cost to families—will be available to all four-year-olds starting in the 2025–26 school year. Second, in 2021, the state committed to adding over 200,000 new subsidized child care spaces over several years to its roster of approximately 270,000 spaces. As of 2024–25, the state has added nearly 130,000 spaces (LAO 2021; LAO 2025b). Finally, the state is preparing to restructure its method of determining reimbursement rates for subsidized child care spaces across several funding streams. This new approach is intended to more accurately reflect the cost of providing high-quality care.
It is important to note that California’s child care market is broad and comprises licensed family child care homes and centers, license-exempt providers (also known as family, friend, and neighbor caregivers), and transitional kindergarten provided at school sites. Home-based providers tend to offer more flexible and affordable care for a small number of children; centers serve larger groups of children and tend to cost more for families (Stephens, Crosby, and Smith 2024). Both types of care can be publicly subsidized; these subsidies are available to some families who meet income and other eligibility requirements.
Our analysis examines the shifting landscape of child care for children up to age five, with a focus on publicly supported care for low- and moderate-income families. We use a variety of data sources to examine this issue from the perspectives of both families and providers between 2015 and 2024. We rely on administrative program data, focus groups with families and providers, and—in an effort to cover the state more broadly—a survey of the professionals (whom we term “navigators”) who help connect families with child care providers offering subsidized care and help connect providers with the state subsidy system. In our survey and focus groups conducted in 2024, we asked how affordability has changed for families and how well providers have been able to stay in business.
This report begins by describing the landscape of publicly supported child care in California. The next section explores affordability for families. Then, we investigate various dimensions of financial sustainability for providers. Because the expansion of TK affects both demand for, and supply of, child care in potentially far-reaching ways, we discuss this expansion in detail. We conclude with recommendations for policymakers and next steps, including previewing our future work in this area.
Many Public Programs Help Families Afford Child Care
In California, early learning and care is a mixed-delivery system that encompasses subsidized child care, the California State Preschool Program, transitional kindergarten, Head Start, early learning services for students with disabilities, and extended learning options to support full-day early education services (California Health and Human Services Agency 2020). The system aims to provide early learning opportunities for low- and moderate-income children, but several programs also address parents’ need for affordable child care to support their education, training, and employment.
Oversight of publicly supported care options is complex. First, several child care programs are a shared state and federal responsibility—a common feature of social safety net programs in general. In addition, both the California Department of Education (CDE) and the California Department of Social Services (CDSS) oversee the major state and federal programs, and both work with local entities—including school districts, county social services, nonprofits, legislatively created councils and navigators, and First Fives (funded by Proposition 10 in 1998)—to connect families and providers to programs. The CDE manages state preschool and TK, while the CDSS oversees a portfolio of both voucher and contract (or slot-based) programs, including General Child Care, the Alternative Payment Program, and CalWORKs child care. Finally, federal Head Start funds go directly to local grantees.
In this section, we provide an overview of child care costs and funding, including trends over time and the number of providers that access public funding.
Child Care Is Expensive
The state offers child care subsidies for some low- and moderate-income families through several programs that use a mix of state and federal funds. These programs take the form of both vouchers that families can use at a provider of their choice and spaces reserved for eligible families at child care centers. Historically, the state has used biennial Regional Market Rate (RMR) surveys of child care providers to estimate the price of child care and inform the process of setting rates for subsidized programs.
Without subsidies, child care is expensive for many families. According to the most recent RMR survey, the median annual cost of full-time child care for a preschool-age child (ages two to four) ranges between $9,000 and $24,000 across counties. For an infant (under two), it ranges between $11,000 and $29,000 (Figure 1). In comparison, median household cash incomes for families with children span from $60,000 to $239,000 across counties. Put in other terms, the full-time cost of preschool care is 6 percent to 18 percent—and infant care is 8 percent to 28 percent—of median incomes. Research has found that expanding subsidized care to all income- and work-eligible families of preschoolers could lower child poverty by 12 percent (Danielson and Thorman 2019).
Unsubsidized, market-rate child care costs for children ages 0–5 vary widely by county
Annual full-time cost
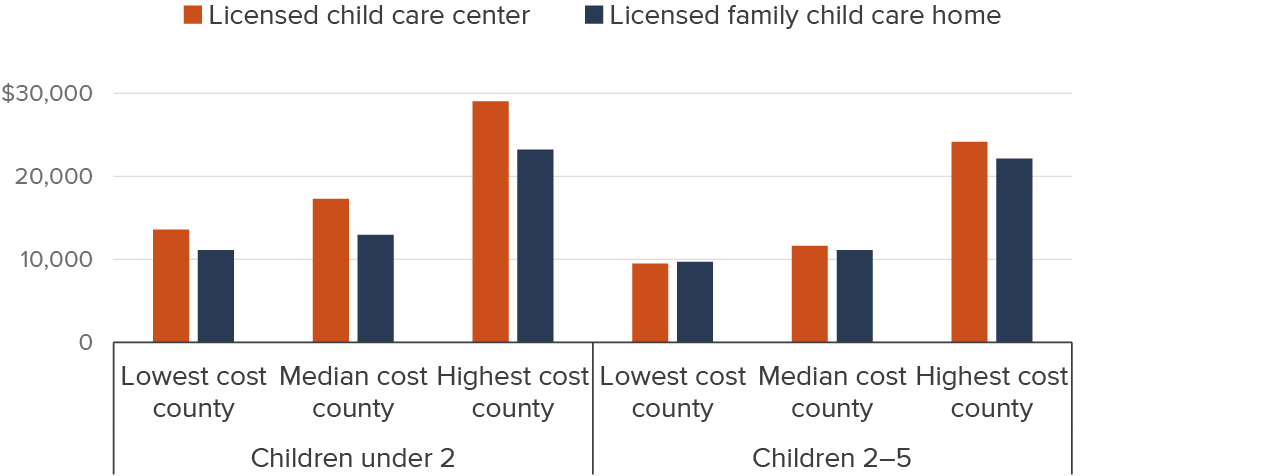
SOURCE: Authors’ calculations from the California Department of Social Services 2021 Regional Market Rate Survey, which is the most recent available survey.
NOTES: Authors use the 50th percentile (median) of the monthly full-time county market rate to represent provider costs. Figure shows counties with the lowest, median, and highest reported costs multiplied by 12. Amounts inflation-adjusted to July 2024. See Technical Appendix C for additional discussion.
Costs have also been increasing. After accounting for inflation, the median growth in cost across counties from 2016 and 2021 ranged between 6 percent and 20 percent, depending on provider type and child age. At the same time, the state has increased its support of programs that help families afford care.
Figure 2 indicates that federal funds for child care have nearly doubled, while state funds have tripled in the last decade. Big increases occurred during the COVID-19 pandemic in 2020–21 and 2021–22, and since then, state funds are thus far making up for the expiration of pandemic-era federal funds. State funds to support full implementation of TK have grown $2.8 billion, while state funds for other ECE programs have grown to $6.7 billion.
State and federal funds supporting ECE have nearly tripled over the past decade
Billions of dollars
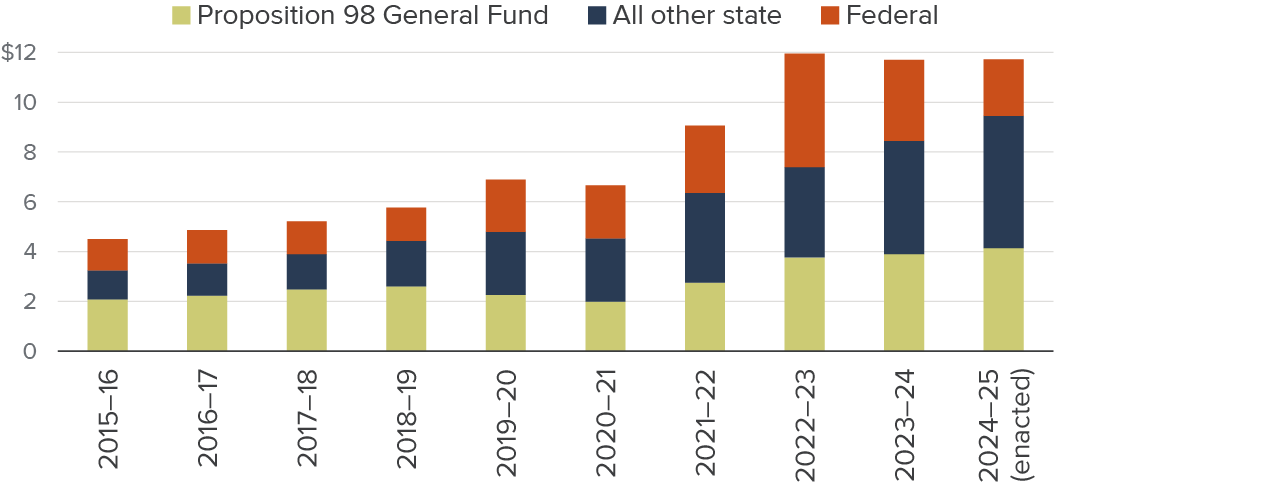
SOURCE: Legislative Analyst’s Office, California Spending Plans: Child Care and State Preschool (various fiscal years).
NOTES: Amounts are inflation-adjusted to July 2024. With the exception of the most recent year, revised estimates are shown. Includes TK, California state preschool (CSPP), CalWORKs child care, CCDF-funded programs, and support programs; excludes federally funded Head Start. Local funds for ECE are not included. Proposition 98 funds are mainly devoted to TK and state preschool.
Several Programs Help Families Afford Child Care
To help families afford the cost of care and provide sufficient flexibility to meet their needs, five main state and federally funded programs provide vouchers or spaces at centers or school sites for young children (Figure 3). Forty percent of public funding ($4.8 billion) is directed to CDSS-supervised, Child Care Development Fund (CCDF)-funded programs. CDE-supervised state preschool receives over a fifth of all public dollars ($2.5 billion), while TK receives another 19 percent ($2.3 billion). Fourteen percent of funds ($1.7 billion) go to local Head Start grantees, and TANF child care (known as CalWORKs Stage 1 in California) receives the remaining 5 percent of funds ($600 million).
Except for TK, these programs serve families that meet income requirements—often having income under 85 percent of state median income (SMI)—and many programs also focus on parents who have a work- or education-related reason to need child care. Both TK and Head Start are universally free for participating families. State preschool (CSPP) and CCDF-funded programs may charge an income-based family fee, but this is uncommon and is capped at 1 percent of family income. Providers receiving CCDF funds are allowed to charge a copayment to close any gap between the subsidy amount and their market rate, but there is limited information available about how often this happens.
Forty percent of public funds for child care go to CCDF programs
State and federal spending (%)

SOURCES: Legislative Analyst’s Office FY (financial year) 2024–25 Spending Plan, Legislative Analyst’s Office FY 2025–26 Budget, and Head Start Head Start Investments by State FY 2023–24.
NOTES: Funded programs may offer full- or part-time care slots. One child may participate in more than one program. Programs in light and dark orange are administered by CDSS, those in light and navy blue are administered by CDE, and those in green are federal grants given directly to local agencies. “Other” includes Migrant Child Care, Emergency Child Care Bridge, and Child Care for Children with Severe Disabilities programs. All data are for FY 2024–25, with the exception of Head Start funding, which is for FY 2023–24.
Youngest Children Have the Highest Unmet Care Needs
Existing subsidized programs lack adequate capacity to serve all eligible families, and priority is given to children with special needs, foster youth, those experiencing homelessness, and families with extremely low incomes (CDSS 2024a; Congressional Research Service 2024). In 2023, an estimated 19 percent of eligible children ages 0–5 were enrolled in publicly funded care administered by CDSS, which resembles national estimates (Pryor and Schumacher 2025). However, with the increase in slots since 2021, this percentage is growing.
Drilling down by age, recent estimates suggest that approximately 50 percent of the state’s four-year-olds are served in state preschool, TK, or Head Start, with recent growth entirely attributable to TK. An additional 5 percent of four-year-olds participate in other forms of publicly supported care, and a quarter of four-year-olds participate in private child care settings, although these children may also participate in publicly supported care for part of the day or year (Melnick and Garcia 2024). Estimates also suggest 19 percent of three-year-olds were in state preschool or Head Start in 2024 (Friedman-Krauss et al. 2025). Unmet need is higher for younger children, although research on this topic is dated. Families who cannot access a subsidy pay out of pocket, cut back on employment to care for children, or rely on informal caregiving.
Many Providers Access State or Federal Funding
Subsidized child care is only available to families if enough providers are willing and able to navigate the subsidy system. Navigating the system is complex, especially because providers must often combine funding from multiple programs to best support full-day, year-round care (Administration for Children and Families Office of Child Care 2019; Gonzalez and Caronongan 2021). Neither CDE, CDSS, nor the Office of Head Start tracks dual enrollment in subsidy programs, which leads to difficulties assessing the total number of providers that accept at least one subsidy. Providers may use multiple funding sources to pay for separate slots in one classroom during one time period, to support the same children across multiple classrooms and time periods (for example, a morning class and an afternoon class), and/or to provide supplemental services, equipment, or supplies in a single classroom. If funds are being combined, providers must meet the quality requirements of the strictest subsidy program and must carefully track how different funds are being used to meet each program’s reporting criteria (Santa Clara County Office of Education 2023).
Figure 4 shows the total number of sites—defined as unique addresses providing any child care—of each provider type and the total number of those sites that received public funding from various funding streams in 2023–24. We find that most publicly funded providers are home-based (family homes and license-exempt providers who care for relatives or children of just one other family). Over 16,000 licensed family homes (about 59%) and more than 31,000 license-exempt providers accept public funding. Unfortunately, we lack reliable information about the number of private-pay, license-exempt providers.
A large proportion of child care centers receive at least some public funding through sources that include CCDF, TANF, CSPP, or Head Start—though obtaining a fully unduplicated count is challenging—but there are centers that do not accept any subsidies. All TK is fully funded through the K–12 system and is free to families. About 14 percent of these school sites also receive CSPP or Head Start funding that may be used to offer additional preschool classes on site to eligible children under four years old, or to extend hours of care for four-year-olds. These estimates are broadly consistent with the existing literature. A recent survey found that 25 percent of local education agencies providing TK also have CSPP (and 12% that do not currently have it plan to expand; Wang et al. 2024). Interviews with school districts suggest families may be enrolled in both CSPP and TK to piece together sufficient hours (Hill and Lawton 2025).
The largest number of providers accepting public funds are home-based
Total and publicly funded child care sites by provider type in 2023
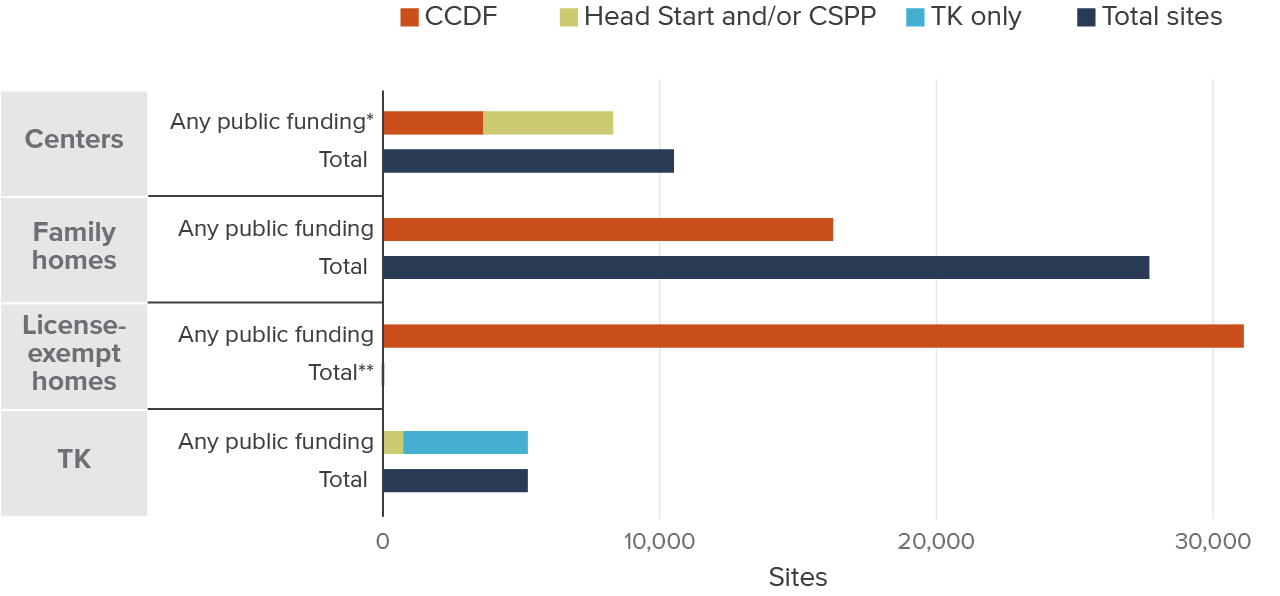
SOURCES: Authors’ calculations from CDE Census Day Enrollment Data 2023; CDSS Community Care Licensing Data, October 2023; Head Start Center Locator as of 12/24; CSAC CSPP List 2023–24; CDMIS – CDD-801A Monthly Child Care Population Report, November 2023.
NOTES: Sites are identified by unique addresses and deduplicated. “Family Homes” includes both large (up to 14 children) and small (up to 8 children) family homes. “Centers” exclude school-age centers and pending or inactive licenses. Sites accepting public funding may also care for non-subsidized children. “Any Public Funding” includes CCDF, Head Start, CSPP, and TK and excludes certain CDSS-run subsidized programs like CalWORKs Stage 1, the Bridge program, and Migrant child care. “*” denotes Head Start and CSPP as a category is deduplicated; however, the stacked publicly funded bar for centers includes duplicates where either a Head Start or CSPP center receives CCDF funding. “**” denotes the total number of license-exempt providers is unknown. Publicly funded centers, family homes, and license-exempt providers receive subsidies through contracts or vouchers to serve eligible children. TK is directly funded for four-year-olds through the public school funding formula.
While the total number of home-based sites (licensed family homes and license-exempt providers) that accept subsidies is larger than the corresponding number of center-based sites, home-based providers serve far fewer children. Most license-exempt providers take care of one child at a time, while small and large family homes are typically capped at 8 and 14 children, respectively. Center capacity averages 53 children.
Many See Improvements in Affordability
Given state efforts to make child care more affordable, we examine whether these investments have had a positive impact on those seeking child care. In this section, we turn to the voices of navigators, families, and providers to hear their perceptions of affordability.
Most Navigators Say Affordability Has Increased
Our survey asked child care navigators about subsidized care for children ages 0–5 and whether families could find affordable care. There were marked differences in responses depending on the age of the child. Only 31 percent of respondents said that families were able to find affordable care for infants, but 56 percent said they were able to locate it for toddlers; this number rose to 77 percent for preschoolers (likely reflecting the state’s investments in preschool).
We also asked navigators if they felt that the affordability of subsidized care had changed in recent years. Over half (54%) said it had increased, just over a third said it had decreased, and 11 percent said it had not changed (Figure 5).
Most navigators say that affordability has increased in recent years
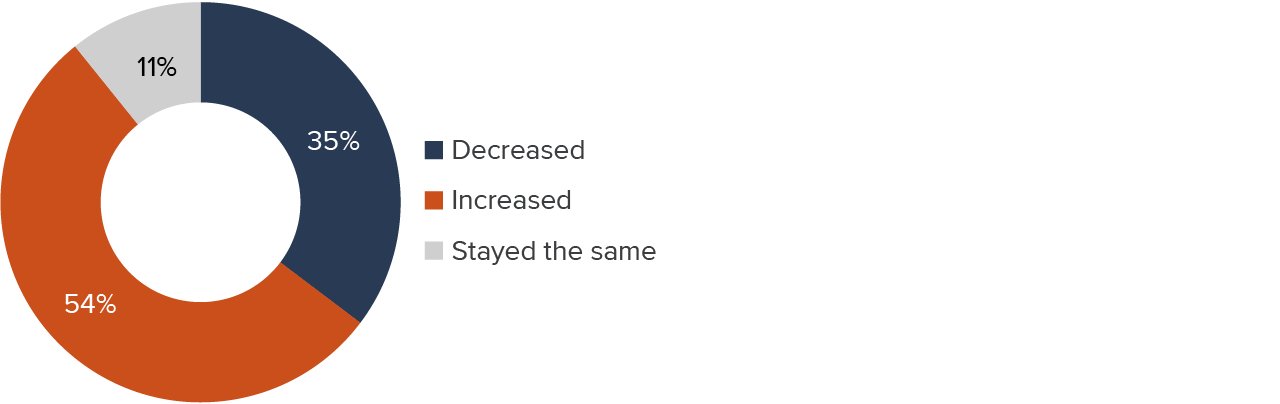
SOURCE: Authors’ survey of California child care navigators, 2024.
Depending on whether the respondent indicated a perceived increase or decrease in affordability, they were then asked the reason for their response. Among those respondents who said affordability had increased, family fee waivers emerged as the most common reason, and were cited by 39 (71%) of those 55 respondents (Figure 6). Sixty-nine percent of these respondents mentioned changes in eligibility as a reason for increased affordability (the survey permitted multiple answers to this question). While it is hard to say for sure, the changes in eligibility that navigators referred to could be related to the increased number of preschool slots in TK and the addition of slots to CDSS programs serving a wider age range of children starting in 2021.
Navigators most often cited family fee waivers and eligibility changes as having improved affordability

SOURCE: Authors’ survey of California child care navigators, 2024.
NOTE: Orange bars reflect percentages of respondents who said that affordability had increased; blue bars show percentages of those who said it had decreased. Respondents could cite any number of reasons.
Navigators citing family fee waivers as a reason behind affordability increases recalled the changes starting between 2020 and 2023. These respondents most often identified increased affordability as starting in 2023, when Assembly Bill 116 directed that families below 75 percent of the state median income (SMI) would pay no family fee, while fees for families over 75 percent of SMI would be capped at 1 percent of family income.
Navigators who brought up changes in eligibility as a reason for increased affordability recalled those changes beginning mostly in 2022 and 2023. On July 1, 2022, the implementation of a new income schedule changed families’ eligibility for CSPP, but perhaps of more consequence was Senate Bill 1047, which extended categorical eligibility to families enrolled in other benefit programs such as CalFresh, Medi-Cal, WIC, and Head Start, beginning January 1, 2023.
Of the 36 respondents who said that affordability had declined, nearly all (83%) cited changes related to the economy and half said it had to do with “copayments” (also referred to as balance payments). Those respondents who cited changes related to the economy as playing a role in reducing affordability said that those changes began to appear in 2020, with the onset of the pandemic. Those citing copayments said that the changes mostly began in 2022 or 2023. Copayments represent the difference between what providers earn through subsidies/family fees and their rates for private-pay families. All else equal, families asked to pay these copayments would find care less affordable. Below we discuss perceptions of how often providers charge copayments and which type of providers are most likely to do so.
Another measure of affordability is access. When asked if the effort to find child care was reasonable, about a quarter of respondents said it was “never” or “rarely” reasonable. Just over half said “sometimes,” and another quarter said “very often.” These results were very similar whether we asked about voucher-based care or subsidized programs.
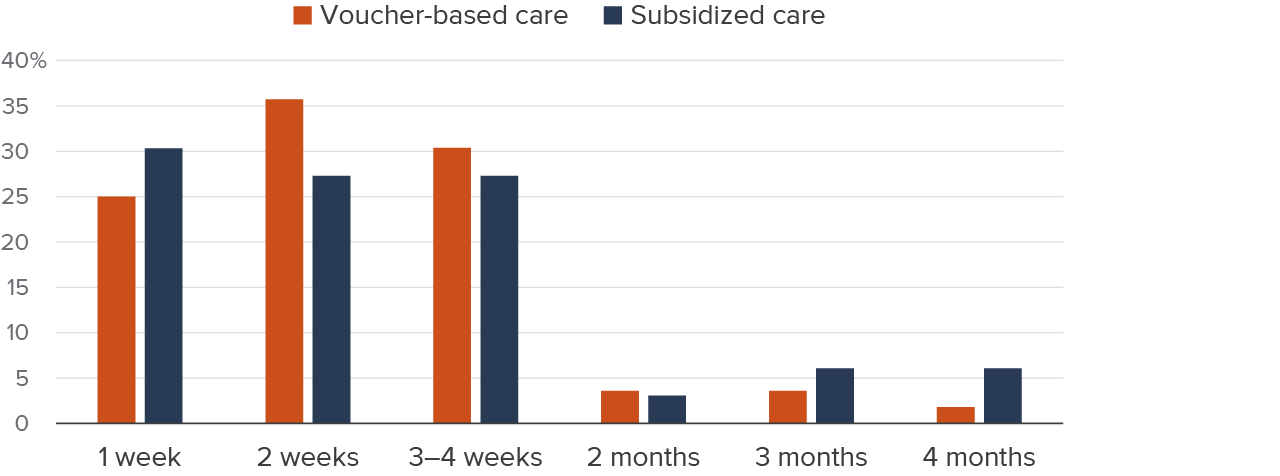
More specifically, navigators estimated the amount of time that families typically spend to find suitable care for their children. In the case of each type of care, at least a quarter responded that it took one week on average. Slightly more said two weeks for each kind of care, and another 27 percent to 30 percent said three to four weeks. A handful replied that it took two months or more to find each kind of care (Figure 7). Navigators’ estimates of how long it typically takes to find appropriate care tracked well with their responses to the question of how much effort it takes (Technical Appendix Figures D2 and D3).
According to navigators, families typically spend one to four weeks finding suitable child care
SOURCE: Authors’ survey of California child care navigators, 2024.
We also asked navigators about providers’ behavior regarding family fees and copayments. When asked “Do some providers opt not to collect the family fees they are supposed to charge?” most respondents (64%) replied that they didn’t know. Of the 30 respondents reporting that some or all providers chose not to collect family fees, 22 said providers did so “to make care more affordable for families,” and 8 said it was “because paperwork is too burdensome.” Not collecting family fees likely does help families afford care but may strain providers.
Some families receiving subsidized care may be asked to pay providers “copayments.” We asked navigators if they were aware of families being asked to pay these additional payments to providers. Fifty-nine percent said yes, 7 percent said no, and 33 percent said they didn’t know. Of those who said yes, respondents most often identified licensed family child care homes (51%) and licensed centers (49%) as the types of providers charging copayments. Only 8 percent said that license-exempt family, friend, or neighbor providers charged these payments (the responses were not mutually exclusive). Unfortunately, we do not have a sense of how many families are asked to provide copayments or the approximate amount of those copayments.
Families Say Subsidies Help Improve Affordability
In our focus groups, families said that subsidies make care more affordable. While families reported issues understanding eligibility rules and the application process, once families received subsidized care, they expressed that they could comfortably afford it. Most of the parents in the focus groups, and all the parents from Kern County, reported they currently did not have to pay family fees. This was a welcome change for a few parents who indicated that they had to pay family fees prior to COVID-19 and that those payments were not reinstated after being waived for the public health emergency. Parents who previously paid family fees universally agreed that waiving the fees was a relief. Parents who had never paid family fees indicated that doing so would hurt their families financially. (Note that when families refer to “copayments” below, they are actually referring to what the state calls family fees.)
“I think adding copayments [would] impact me a lot just because with how much everything is right now. Adding a copayment would be a negative for me.” – Humbolt County parent
“When they stopped the copayments [during COVID-19], it made a big difference. I could save that money for other things we needed.” – San Mateo County parent
Some families reported being caught in the middle, making too much for subsidized care and too little to pay for care on their own. One mother reported that losing her job helped her qualify for care and that she was then able to find work at a payrate that allowed access to subsidized care.
“I used to pay a lot out-of-pocket before I got into the program, and it was really hard. I couldn’t afford it.” – Los Angeles County parent
Parents expressed that subsidized care allowed them to return to work without worrying about the high cost of child care. This resulted in greater financial stability, as they could keep more of their income for other essential expenses. One parent from Kern County noted that before receiving subsidized care, almost their entire paycheck went to the babysitter, but the program now allowed them to save money.
“Subsidized child care has made a huge difference. I can work full time without worrying about paying for care, and that has allowed me to keep my job.” – Los Angeles County parent
Providers Say Access Can Be Difficult in Some Cases
Providers echoed parents’ sentiments, stating that subsidized care enabled families to participate in the workforce, pursue education, and improve their household income.
“Subsidized care takes a huge burden off families, allowing parents to go back to work or school and contribute to their household income.” – San Mateo County provider
Some providers reported needing to charge parents more if they required non-traditional hours or have a child with special needs, which they acknowledged made care unaffordable for some families, even when subsidized. These providers indicated that they would like to eliminate copayments, but do not feel they can. Providers suggested that extra financial incentives or resources could encourage more providers to offer care during non-traditional hours and to families with children who have special needs.
“If [the state] offered more pay for evening or weekend shifts, it would help those parents who work odd hours. Without that, it’s hard to find care for those times.” – Humboldt County provider
Providers Report Challenges
Although market-rate child care is often expensive for families, it also tends to be low-paid employment. Child care providers aim to make care affordable for families but also need to pay competitive wages to their employees—and theirs is a human-capital-intensive business. In this section, we first explore how much providers charge for care and trends in the supply of care over time. We also report subsidized providers’ and navigators’ views on changes in capacity and the tensions involved in balancing affordability for families while remaining a sustainable business.
Child Care Prices and Subsidies Have Grown
Child care workers earn relatively low wages compared to other care professions. In the first quarter of 2023, child care workers earned about $18 and preschool teachers earned $19.50 per hour on average, and about half of families with a child care worker participated in one or more safety net programs (McConville et al. 2024). Low wages can make it difficult for providers to attract and retain qualified staff (Adejumo and Powell 2024; McConville et al. 2024).
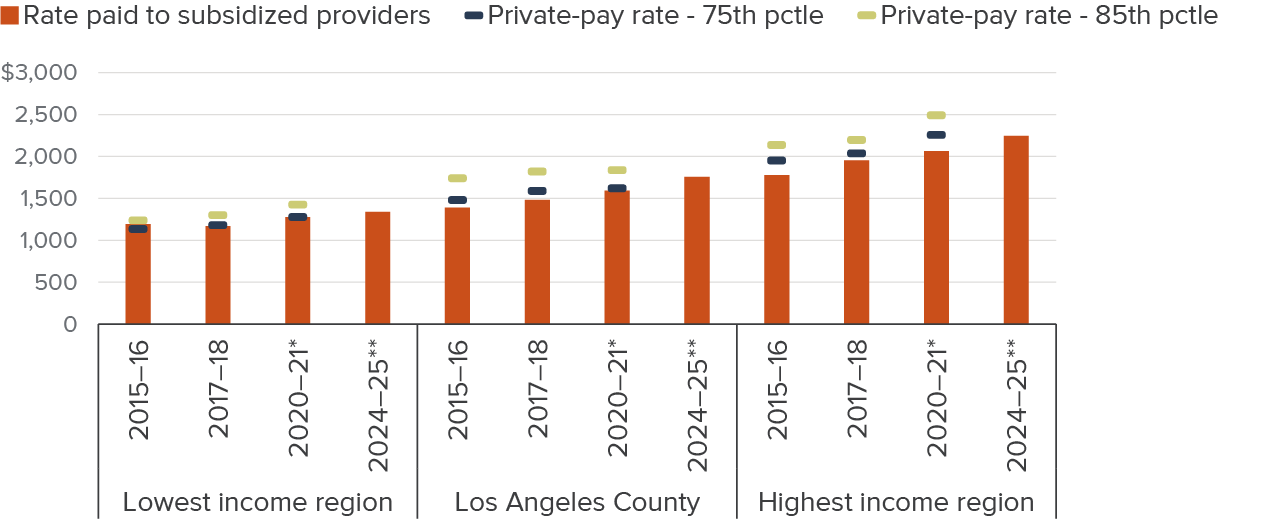
Calculating full-time child care prices across provider types and child ages, costs have varied across regions over the past decade. Figure 8 shows unsubsidized market rates at the 75th and 85th percentiles since these are commonly used as a reference point to set subsidy amounts in child care programs. (The 75th percentile rate implies three-quarters of providers in the area charge less and a quarter charge more). After adjusting for inflation, prices increased 5-6 percent statewide from 2016 to 2018 and 4 percent from 2018 to 2021 (Figure 8 and Technical Appendix Table C2). Regionally, prices rose between 3 and 7 percent from 2016 to 2018, and changed between -1 percent and 13 percent from 2018 to 2021.
Subsidized rates set through legislation for many publicly supported programs rose across the board from 2016 to 2021, and often by at least as much as private rates did. Further, between 2021 and 2025, inflation-adjusted, subsidized rates increased an additional 8 percent statewide (ranging from 5% to 10% regionally). As a response to the pandemic, several rounds of supplemental rate payments and stipends went out to subsidized providers. Since January 2024, monthly payments known as cost of care plus rate (CCPR) payments have been supplementing RMR-based payments for subsidized licensed/license-exempt providers. The state is using this hybrid rate structure as a bridge to a new approach to setting rates that are projected to be implemented in January 2027. Overall, statewide inflation-adjusted subsidized rates have increased 22 percent over the past decade and now average $1,700 per month.
While private-market prices have grown over the past decade, subsidized rates have often increased more
Inflation-adjusted $ per month
SOURCES: Authors’ calculations from California Department of Social Services 2005–2021 RMR Surveys. IPUMS National Historical Geographic Information System (NHGIS) tables 2012–2023.
NOTES: No RMR survey has been conducted since 2021. Dollar amounts are adjusted for inflation to July 2024. The estimates are weighted by the county’s child population (ages 0–4), so estimates reflect a regional per child average across provider types and child age. “*” denotes one-time stipends per child disbursed were included in the subsidized rates. “**” denotes monthly cost of care plus rates were included in the subsidized rates. “Lowest income region” is single rate structure region 1, Los Angeles County is single rate structure region 3, and “Highest income region” is single rate structure region 5 (see text box and Technical Appendix Table A2). See Technical Appendix Table C2 for costs for all single rate structure regions. Technical Appendix Table A2 lists the counties within each region.

High Living Costs Are a Challenge for Providers
Subsidized providers reported numerous financial issues that threaten their business and livelihoods. In their view, the rising cost of living was not being matched by the reimbursement rate, thus disrupting their ability to pay staff sufficiently and sometimes inducing them to collect copayments. Providers felt that pandemic-era family fee waivers helped to increase demand from families, but these waivers have expired. A final challenge is the implementation of universal TK (discussed below).
Providers, like families, reported feeling the pressure of rising costs (e.g., rent, food, and utilities). They noted the need for higher reimbursement rates to match the rising cost of living and the financial demands of operating child care programs. High living costs were particularly challenging for employee recruitment and retention, especially for providers in Imperial and San Mateo Counties.
“The cost of living is just too high in areas like Los Angeles and the Bay Area. We need to be able to pay staff more, but the reimbursement rates don’t match the actual cost of care.” – San Mateo County provider
“The cost of care isn’t keeping up with the cost of living. We have fixed rates from the state, but rent, utilities, and supplies all keep going up.” – Imperial County provider
Providers noted that higher reimbursement rates have made it possible to increase staff hours and/or wages.
“The [COVID-19] relief funds definitely helped with keeping staff on board. I didn’t have to cut as many hours or reduce staff as I thought I would.” – Imperial County provider
“During COVID, I was able to keep more of my staff because of the reimbursement rate increase. Without that, I would’ve had to let go of a lot of people.” – Humbolt County provider
Further, one provider indicated that waiving the family fees helped their bottom line since more families requested care as a result.
Providers reported that when they felt reimbursement rates did not keep pace with rising costs, they experienced greater pressure to charge families copayments. Providers indicated they needed to be more profitable but felt that their clients could not afford to pay them more.
“In areas like ours, families can’t afford much, and we can’t charge them more because the cost of living is so high for everyone, even us.” – San Mateo County provider
Some providers reported collecting copayments from families even though they did not wish to do so. This was particularly true for families requiring care during non-traditional hours or for children with special needs.
Capacity Has Increased while the Child Population Has Declined
Analyzing trends in the supply of child care can provide insights into both access for families and sustainability for providers. Figure 9 presents the number of regulated child care spaces by provider type and the total number of children under age five; we find the gap between the number of children 0–4 and child care slots available has decreased.
Before 2020, the total supply of child care spaces increased by less than 1 percent annually, with TK and center-based spaces growing and home-based capacity shrinking. In 2020, spaces declined by 2 percent across all provider types. Child care centers have not recovered from this pandemic drop and saw further declines in 2023, resulting in about 4,340 (1%) fewer center spaces in 2023 than 2019. Meanwhile, family child care homes have surpassed their pre-pandemic levels by about 5,400 spaces (1.8%). Enrollment in TK more than doubled from fall 2021 to fall 2023 (expansion began in fall 2022). Thus, the overall increase in the supply of child care spaces since 2020 has been driven by TK expansion.
TK expansion has led to a rise in child care spaces, but the bigger shift is the decline in the child population
Child population (thousands) ages 0–4 and center, family, and TK child care spaces as of October

SOURCES: Authors’ calculations from CDE Transitional Kindergarten Program Participation Enrollment Data 2013–2022 & Census Day Enrollment Data 2023; CDSS Community Care Licensing Data 2015–2023; IPUMS USA, American Community Survey 1-Year Estimates.
NOTES: Capacity is total licensed capacity and may not equal enrollment. Center and family home data is as of the month of October of each year, TK data is as of one day in October, population data is a single year estimate. Center licensed capacity excludes school-age centers but children older than four may still receive care from these providers. “Family Home” includes small and large family homes. Inactive and pending center and family care licenses are excluded. License-exempt care is excluded from the figure.
While the number of child care spaces has risen, the total number of children in the state has been on the decline for more than a decade. Birth rates are at record lows and rates of migration into the state have dropped (Johnson 2023; Lafortune and Prunty 2023). On net, the share of regulated child care spaces relative to the number of children ages 0–4 increased from 41 percent in October 2015 to 53 percent in October 2023, with the declining birth rate accounting for more than the increase in supply (Technical Appendix Figure B1).
We also examined variation in trends across the five regions used to set reimbursements (single rate structure regions; see earlier text box). All five regions saw both declines in their child populations and increases in TK enrollment after the pandemic (Technical Appendix Figures B4–B6). The two lowest-income regions saw little to no losses in child care spaces across all provider types. Regions 3 and 4 saw losses in center capacity and only the highest-income region (Region 5) saw home-based capacity loss.
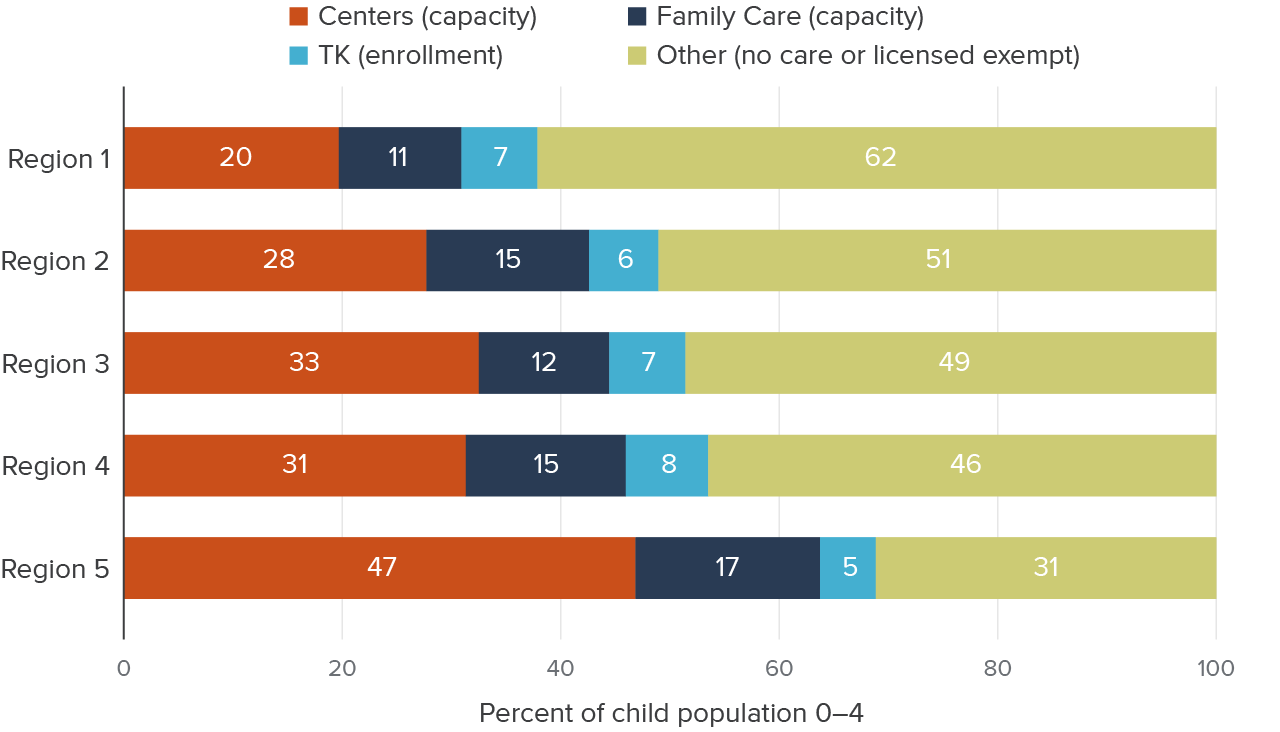
While the trends overall align across regions, the supply of regulated child care spaces relative to the young child population as of 2023 varies. Child care availability for children 0–4 is most limited in the lowest-income region where there are spaces for a little over a third of children, compared to spaces for about half of children in the middle-income regions and more than two-thirds of children in the highest-income region (Figure 10). The share of spaces in TK and family-based care is similar across regions, but the availability of licensed centers is much more varied. Centers have capacity for nearly half of the young child population in the highest-income region, but only 20 percent in the lowest-income region.
Counties with the lowest cost of living have the lowest licensed child care supply relative to their populations
Single rate structure regions
SOURCES: Authors’ calculations from CDE Transitional Kindergarten – Census Day Enrollment Data 2023; CDSS Community Care Licensing Data 2023; IPUMS NHGIS, American Community Survey 5-Year Estimates.
NOTES: Capacity is total licensed capacity and may not equal enrollment. Center and family home data is as of the month of October of each year, TK data is as of one day in October, population data is a 5-year estimate labeled as the final year of each period. Center licensed capacity excludes school-aged centers but children older than four may still receive care from these providers. “Family Care” includes small and large family homes. Inactive and pending Center and Family care home licenses are excluded. We combine “no care” and “license-exempt” care into “Other” since we do not have counts of license-exempt capacity. Recall license-exempt care is care for one’s own children, care for relatives, or care for children of just one other family. Technical Appendix Table A2 lists the counties within each region; Region 1 is the lowest cost-of-living region, Region 5 is the highest.
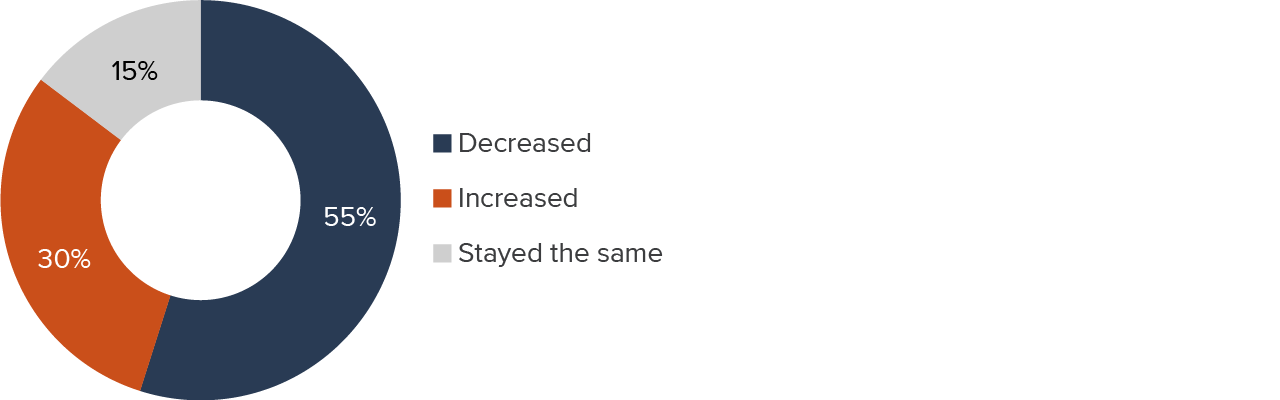
Despite Increases in Measured Capacity, Most Navigators Say the Supply of Child Care Has Decreased
We asked navigators whether, in their opinion, the supply of care for children ages 0–5 had changed in recent years, and if so, why and when (Figure 11). Although our analysis of administrative data above found capacity increases (Figure 9), at least half of navigators responded that the supply of care had decreased, and this response was consistent across different types of navigators (Technical Appendix Table D2). Thirty percent suggested that the supply had increased, and 15 percent felt it had stayed the same. These perceptions could be attributable to several factors. Given navigators’ role, it’s reasonable to think that navigators were focusing on centers and family homes rather than factoring in the increase in TK availability (although they were aware of this expansion, as we explore below). Excluding TK enrollment, licensed capacity increased, but by less than 1 percent from 2020 to 2023. Regionally, the capacity of licensed providers did decline in Los Angeles County (Region 3) and in the highest-income region (Technical Appendix Figure B4). Survey respondents could also have been thinking about the number of providers rather than total provider capacity: the number of center-based providers declined every year from 2020 through 2023, and for family child care homes declines only reversed in 2023 (Technical Appendix Figure B2).
Most respondents felt the supply of subsidized child care has declined
SOURCE: Authors’ survey of California child care navigators, 2024.
Of those who said the supply had decreased, the majority cited the related (and likely overlapping) reasons of staff turnover (82%) and ability to hire new staff (73%), while several others mentioned licensing requirements (32%; Figure 12). Not surprisingly, respondents often identified 2020, when the onset of the pandemic dramatically changed workplace conditions and confined many workers to their own homes, as the time when many of these challenges started.
Among those saying supply has decreased, respondents cited staff turnover and hiring challenges
SOURCE: Authors’ survey of California child care navigators, 2024.
NOTES: Orange bars reflect percentages of respondents who said that supply had increased; blue bars show percentages of those who said it had decreased. Respondents could cite any number of reasons.
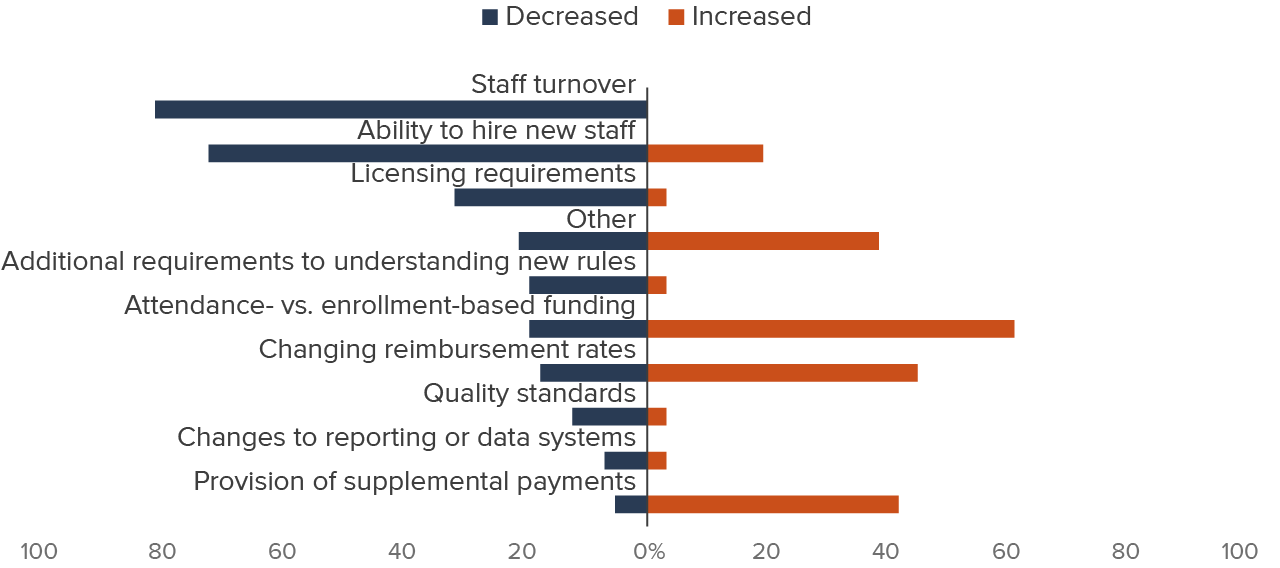
The significant minority of respondents saying that supply had increased gave a more varied set of reasons. Sixty-one percent cited the switch from attendance-based to enrollment-based funding, 45 percent brought up changing reimbursement rates, and 42 percent mentioned the provision of supplemental rate payments.
Those identifying enrollment-based funding as the reason behind the supply increase most often cited 2020 as the start of the change. In March of that year, the federal CARES Act allowed and encouraged reimbursement to providers based on enrollment rather than attendance (see Technical Appendix Figure D4). Subsequent state-level legislation (Assembly Bill 131 in 2021 and Assembly Bill 210 in 2022) provided further guidance regarding enrollment-based reimbursement, and several navigators also cited those years as the start of an increase in supply.
Most of the respondents crediting changes in reimbursement rates for an increase in supply said the change began in 2021, 2022, or 2023. Each of those years saw increases in reimbursement rates—most notably the switch to the use of the 75th percentile of the 2018 regional market rate (RMR) survey in 2022, and the extension of the RMR rate (if higher than the existing rate) to all non-RMR subsidized programs beginning in 2021–22. Respondents most frequently identified 2023 as the start of the supplemental rate payment’s effect upon increasing the supply of child care; that year, various bills authorized a slew of one-time payments to eligible providers (Technical Appendix Figure A1). It is worth noting that many of those payments were issued based on enrollment, not attendance, data, a fact that reinforces the connection among the various reasons that respondents gave for supply changes.
Openings and Closures Are Higher for Home-Based Care
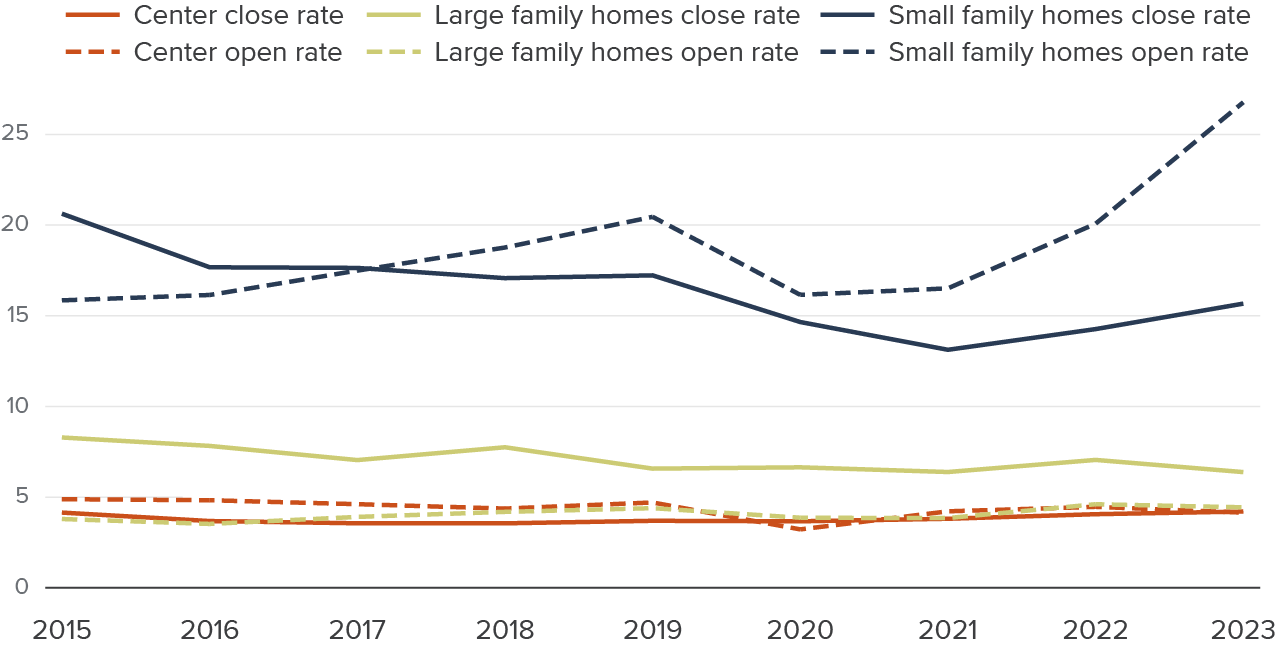
Regardless of overall supply trends, if individual providers are closing and opening their doors at higher rates this would suggest both increased difficulty staying in business and a decreased ability for families to find stable care. We evaluate provider turnover by looking both at rates of providers opening their first license or permanently closing. Generally, we find closing rates that are stable or trending downwards and more variability in opening rates over time. Importantly, this portion of our analysis does not consider providers that became temporarily inactive or staff turnover within a center or home-based setting.
Rates of openings and closure are three times higher in small family homes than in centers
Annual rate
SOURCE: Authors’ calculations from CDSS Community Care Licensing Data 2015–2023.
NOTES: Closure rate is calculated as the number of providers of each type (centers, large family homes, and small family homes) that closed in the year divided by the number of active providers of that type at the beginning of the year. Opening rate is calculated as the number of providers of each type that opened in the year divided by the number of active providers of that type at the beginning of the year. Providers that open and close in the same year are excluded. A provider is considered open at the start date of their earliest CDSS-administered license and considered closed when all licenses for the provider have a close date. Small family homes that transition to large family homes will not be captured in these opening or closure rates. The provider designation and capacity will change, but they are not issued a new license. Only CDSS-licensed providers are represented in this figure. TK schools are not included. Inactive licenses are excluded.
Center-based providers have had the most stability over the last decade, followed by large family homes. Small family homes have seen a much higher level of turnover. For example, the opening rate among small family homes reached 25 percent by 2023. In comparison, opening and closure rates for centers have hovered between 4 and 5 percent over the entire decade (Figure 13). As suggested by these low turnover rates, years of experience among center providers have increased steadily over the last decade, with the median center-based provider having 16 years of experience in 2023 (Technical Appendix Figure B10). The median large family home had been open for nine years in 2023—down from ten years in 2019. Meanwhile, the median small family home provider had been open for four years in 2023, less than half the experience of the median large family home provider and a quarter that of the median center.
Open rates dipped in 2020 for centers and small family homes but returned to roughly their 2019 levels by 2022—large family homes maintained stable opening rates. Closing rates did not change much at the start of the pandemic for centers or large family homes, while small family homes saw a decrease in closures. By 2023, the small family home closing rate was still lower and their opening rate was at its highest level in a decade.
The higher opening and closure rates among small family homes may be driven by structural differences across provider types. Unlike centers, which typically have multiple staff members and administrative support, small family homes are often run by a single provider or a small team. This makes them more vulnerable to disruptions from burnout, financial strain, or personal circumstances (Bromer et al. 2021). Additionally, small family home providers may have fewer resources to navigate regulatory changes, fluctuating enrollment, or economic downturns, contributing to greater volatility. Large family homes, while still experiencing more closures than centers, may benefit from having slightly more staff and capacity, making them somewhat more stable than other home-based providers. An additional reason the opening rate for large family home providers is so low may be that these providers often start with a small family home license and then transition to larger licensed capacity, thus understating the true opening rate of large family homes.
Recent gains in center and family home capacity have been driven by home-based providers, a reversal of historical trends
Annual change in capacity

SOURCE: Authors’ calculations from CDSS Community Care Licensing Data 2014–2023.
NOTES: Change in capacity represents the difference between the active licensed capacity of the listed year and the active licensed capacity of the previous year by provider type. Capacity can be lost through permanent closures, providers transitioning from active to inactive status, capacity decreases (e.g., if a center closes one of its licenses but the provider remains open), and provider transitions (e.g., a small family home transitioning to a large family home will show as a decrease in the small family home capacity). Capacity can be gained through new licensed providers opening, providers transitioning from inactive to active status, capacity expansion (e.g., if an existing center opens a new license), and provider transitions (e.g., a small family home transitioning to a large family home will show as an increase in total large family home capacity). Only CDSS-licensed providers are represented in this figure. TK schools are not included.
Permanent openings and closures have important implications for the availability of care and provider sustainability, but as providers may also transition in and out of temporary inactive status, we also look at changes in the capacity of active providers. Despite the sharp increase in small family home openings from 2021 to 2023 shown in Figure 13, these providers represent only the second-largest source of capacity gain in 2023 and showed modest capacity loss in 2022 (Figure 14). Small family home providers are far more likely to face temporary closures than other providers—from 6 percent to 11 percent of small family homes are listed as inactive, compared to 1 to 3 percent of centers and large family homes (Technical Appendix Figure B11). Additionally, small family homes have the lowest licensed capacity—the capacity gained by two of these providers opening is only slightly larger than the increase in capacity from one new large family home. Centers have much larger licensed capacity than either type of home-based provider, so the opening or closure of a small number of these providers can substantially affect the availability of child care spaces for families.
Overall, our analysis shows some losses in capacity for small family homes and centers in the wake of the pandemic, with no increase in permanent provider closures. However, we reiterate that our analysis looks only at licensed capacity changes, permanent closure rates, and provider opening rates (as defined by licenses). It does not measure any turnover of employees nor changes in child enrollment.
Navigators’ Views of Provider Turnover Were Mixed
We also attempt to understand turnover in our survey by asking navigators, “Has subsidized child care provider turnover changed recently?” While the previous section indicates relative provider stability based on licensing data, our survey question yielded responses from navigators that potentially considered both the tenure of existing licensed providers as well as staff turnover.
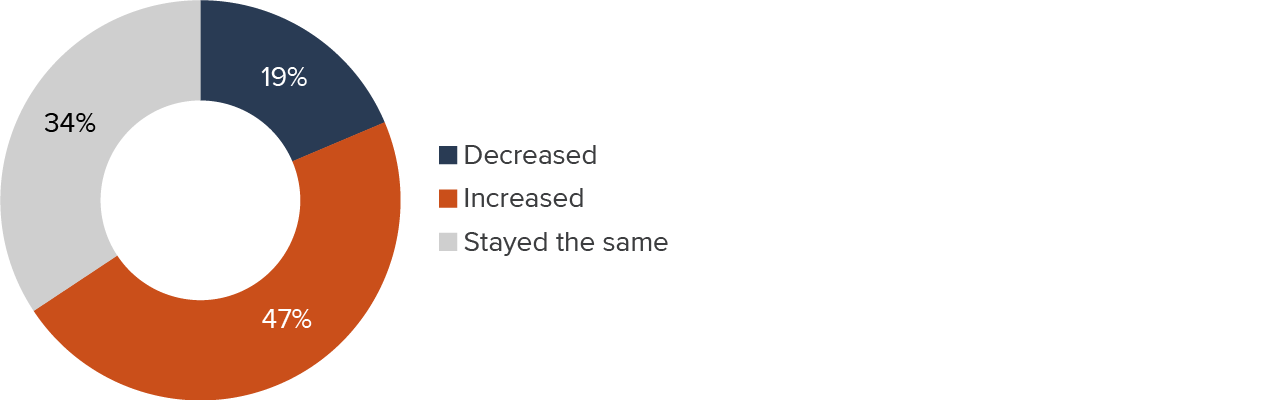
We find that nearly half (47%) of navigators said turnover had increased; about a third (34%) said it had stayed the same, and 19 percent said it had decreased (Figure 15). These responses varied notably by provider type and by region. For example, 70 percent of Region 2 navigators reported increases in turnover while only 41 percent of those in Regions 1 or 4 did so (recall that Region 1 comprises the lowest cost of living counties and Region 5 includes the highest cost of living counties; Technical Appendix Figure D5).
Almost half of navigators said that provider turnover has increased
SOURCE: Authors’ survey of California child care navigators, 2024.
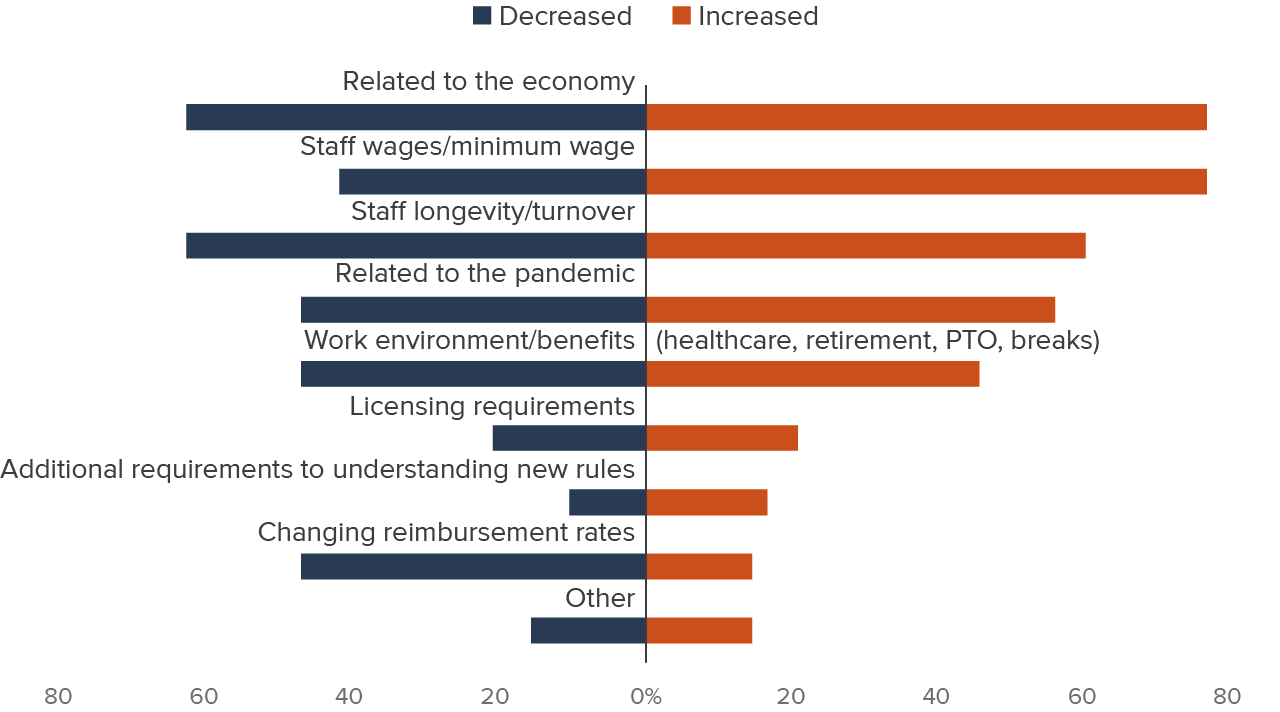
Navigators who told us that turnover had increased cited factors related to the economy and, specifically, staff wages/minimum wage requirements as key reasons (77% of those respondents each). Large numbers of navigators also cited the related reason of staff longevity/turnover (60%) and the work environment (including benefits, retirement, and time off; 46%). Of those 19 respondents who said that turnover had decreased in recent years, they cited factors related to the economy and staff longevity/turnover (63% each), changing reimbursement rates, work environment/benefits, and elements related to the pandemic (47% each; Figure 16).
Navigators cited similar reasons for perceived increases and decreases in provider turnover
SOURCE: Authors’ survey of California child care navigators, 2024.
NOTES: Orange bars reflect percentages of respondents who said that turnover had increased; blue bars show percentages of those who said it had decreased. Respondents could cite any number of reasons.
Respondents who reported a positive or negative change in child care turnover overwhelmingly cited 2020 as the year when the change began. This observation appears to be directly related to the effects of the pandemic itself, rather than to any subsequent policies.
TK Expansion Is Affecting the Child Care Landscape
In 2021, California established the goal of providing free, high-quality, inclusive transitional kindergarten for all four-year-olds using developmentally appropriate curriculum, instruction, and facilities. Below, we provide background about the expansion of traditional kindergarten and present views of navigators, parents, and providers on how this expansion has affected other child care programs.
Enrollment in TK Has Grown in Recent Years
California has expanded access to TK over the course of four school years, beginning in 2022–23, with full implementation slated for 2025–26. All local education agencies (LEAs) operating kindergarten are required to provide TK to eligible children. For public schools funded by the Local Control Funding Formula (LCFF), the program is funded through average daily attendance (ADA), just as other grade levels are funded.
Research regarding enrollment in TK prior to the pandemic (and prior to TK expansion) found that by 2019–20, many districts were not providing a TK option, although all districts offering kindergarten were required to do so, and that some key student populations appeared to enroll at lower rates. Specifically, Black, Pacific Islander, and Native American children were less likely to participate in TK compared to their peers. Dual Language Learners (DLLs) and Latino children were participating at relatively high rates (Hill and Prunty 2022). More recently, the same racial/ethnic groups were still less likely to participate (Black, Pacific Islander, and Native American) and Latino participation rates had fallen to match state averages, but more school districts and schools are now offering TK (Hill and Lawton 2025). It remains unclear whether families are not enrolling because access is difficult (e.g., their school or district does not offer it) or because the program does not match their education goals and preferences for care. For a variety of reasons, families of unenrolled children may prefer their current care options (subsidized or unsubsidized) or may wish to care for their children at home.
Early studies of TK suggested many districts’ implementation may have been lacking key features desired by families, such as full-day care, separate TK classrooms, TK curriculum that is distinct from kindergarten curriculum, and after-school care. However, recent research suggests TK implementation is improving. According to a survey of California LEAs, more districts are moving closer to the ideals of the TK program outlined in the Master Plan (Wang et al. 2025). Highlights include:
- An increasing share (84%) are offering full-day TK (four to six hours)
- Among LEAs offering TK, an increasing share of districts are offering TK at multiple or all their district elementary schools (85%)
- Fewer LEAs are combining TK/K classrooms, and more are providing TK-only classrooms
- Student-to-staff ratios have decreased
- The vast majority of LEAs (88%) report they will have adequate classroom space for projected TK enrollment by 2025–26
Even though most districts reported adequate classroom space and staffing levels (when it comes to issues such as hiring and retention), they also expressed a great deal of concern about age-appropriate facilities and finding staff with proper qualifications. These findings were echoed in interviews with district staff implementing TK (Hill and Lawton 2025).
Despite these challenges, TK enrollment has increased since expansion started in 2022–23 (Technical Appendix Figure B1). Current estimates suggest between 60 and 70 percent of eligible four-year-olds are participating. While TK enrollment has grown over the years, enrollment levels are lower than originally projected due to falling take-up rates and declines in the eligible population relative to expectations (Melnick et al. 2022). Although TK may be less popular with families than anticipated, TK is likely still drawing children away from other types of care. Because the state does not track how children may be exiting one set of care options and entering another, we turn to navigators, parents, and providers to understand the extent which they feel TK is affecting child care in the state.
Most Navigators Say TK Has Affected Other Child Care Programs
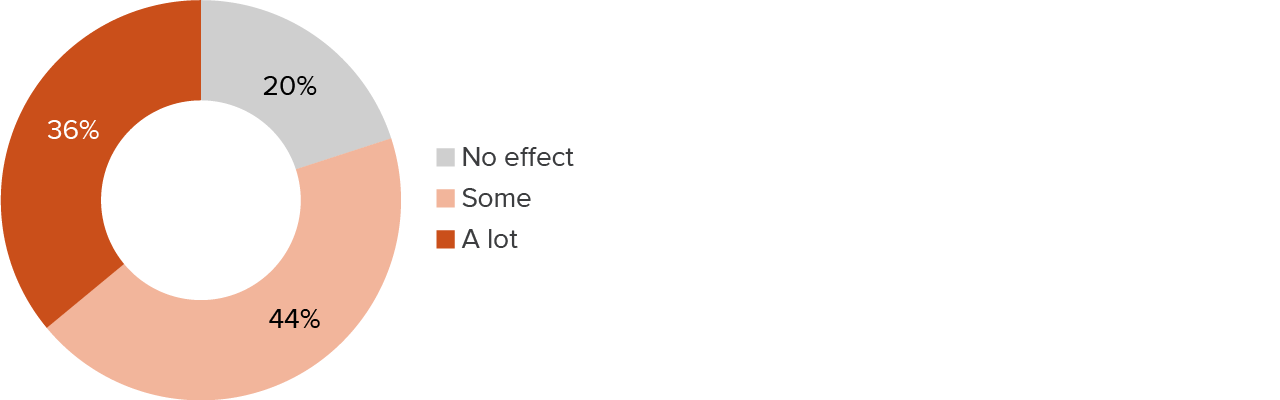
We asked navigators several questions about their perceptions of the effect of TK’s expansion upon subsidized child care providers. First, we asked whether the ability to staff programs has changed, and if so, how. Only 20 percent of navigators said that TK has had no effect; 44 percent reported “some” change, and 36 percent said it has resulted in “a lot” of change (Figure 17). These results were fairly consistent across respondent type and region.
Most navigators say TK has had an impact on the ability to staff subsidized care
SOURCE: Authors’ survey of California child care navigators, 2024.
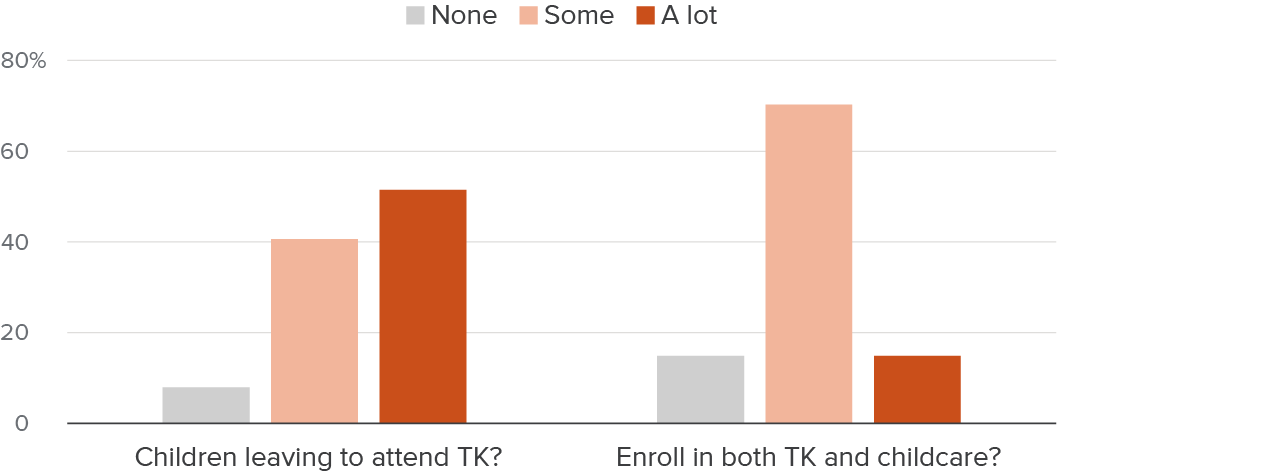
Asked if children were leaving to go to TK programs, nearly all navigators believed this to be the case; 41 percent said “some” and 51 percent said “a lot” of children were doing so. There was significant agreement among respondent types. But respondents also told us overwhelmingly that some children enrolled in both TK and subsidized care: 70 percent said “some” and 15 percent said “a lot” of children were enrolled in both types of programs (Figure 18).
Most navigators believe that TK is changing the child care landscape
SOURCE: Authors’ survey of California child care navigators, 2024.
More than half (55%) of navigators said that exits to TK were changing the ages of the children that they were being asked to place. Of those, 71 percent cited fewer four-year-olds, and 46 percent said more three-year-olds. But the effect appears to extend beyond the ages most directly affected by the recent move to universal TK—52 percent of these respondents cited an increase in toddlers, and 27 percent noted an increase in the number of infants that they were being asked to place. It may not be easy for providers to respond to these increases in demand for care of children under four, as staffing ratios and other licensing requirements are different for younger children. Further, some providers may have greater expertise, training, and/or preferences in caring for preschool-age children rather than infants and toddlers.
Parents Express Concerns and a Lack of Information
In our focus groups, parents expressed significant worry about participating in TK. For example, a parent in Kern County said, “I think I would like to stay in child care because I still feel like they are too young for kindergarten.” This sentiment was echoed by parents in San Mateo and Humbolt Counties. Another parent expressed concern about the quality of care in TK, saying:
“I’m concerned about the quality of the care in public schools for TK… It’s a bigger class size, and I’m not sure my child will get the attention they need.” – Los Angeles County parent
Another recent survey of California parents with children under six find that a few (5%) do not really know what TK is, and 24 percent think TK is only for low-income four-year-olds. Latino families (14%) are the most likely of all racial/ethnic groups to say they “don’t know much about TK” (Powell and Adejumo 2024).
Safety was another concern for parents. Some highlighted issues such as large class sizes, limited supervision, and drop-off policies that required young children to navigate school grounds independently. These concerns have led some parents to hesitate in transitioning their children from private child care to public TK, opting instead for environments they perceive as safer and more nurturing.
“Out here with the schools in my county, you’re not even allowed to drop your kids off at the classroom. You just send them through the gate, and they have to go out on their own—and they’re preschoolers, kindergarteners. That doesn’t make me feel safe.” – Humboldt County parent
Other parents indicated they would like to use TK but couldn’t because the hours were not long enough to meet their needs. For example, a parent in Los Angeles County said, “It will be cheaper to move my child to TK when it’s full day. Right now, it’s too short…” The statement reflects both parents’ need for more hours of care and potential misperceptions about the program. Overall, no parents indicated they were currently using TK, and only a handful said they had plans to do so once it was available.
The number of hours of care provided is one critical factor for families selecting a preschool program. Even full-day TK, which ranges from four to six hours, does not provide care for a full day of work for parents. Starting in 2022–23, all school districts with high concentrations of Dual Language Learners and students from low-income families must offer nine hours of care daily through the Expanded Learning Opportunities Program, including for children enrolled in part-day programs (Fensterwald 2021; CDE 2024). The Expanded Learning Opportunities Program has had annual funding of $4 billion since 2022–23 (LAO 2025a), and districts are offering this care now, but there are capacity constraints. Districts report that families still may not be able to find TK that offers sufficient afterschool care options (Hill and Lawton 2025).
Providers Worry about TK Affecting Their Enrollment
Despite a lukewarm reception for TK among the parents we spoke to in the focus groups, providers indicated that TK was hurting enrollment and affecting their bottom lines. Providers in San Mateo, Humboldt, and Imperial Counties indicated that enrollment among four-year-olds has dropped.
“TK is really crushing us. Families are moving their four-year-olds to TK, and it’s taking away a lot of our preschool enrollment.” – San Mateo County provider
These providers could not immediately shift their focus to younger children due to licensing regulations. In other words, they could not simply trade a four-year-old slot for an infant due to differing staffing and training requirements for each population (CDSS 2019a; 2019b). Plus, even if providers were able to expand their infant programs, there would be a cost associated with doing so. A provider in Humboldt County said, “We might need to take on more infants and toddlers because so many kids are going to TK now, but it’s harder work and more expensive to offer infant care.”
Despite these concerns, some providers indicated that they thought TK was a positive step. A provider from Los Angeles County said, “TK helps provide more educational access to families who wouldn’t otherwise be able to afford it. That’s good for the community.”
In sum, while TK is expanding rapidly compared to other sources of care, parents are not always familiar with TK as an option, nor is it always preferred. It certainly makes care more affordable for families, presuming they can get all the before- and after-school hours they need. Providers in our focus groups were feeling the negative impacts of TK on their enrollment, and this was echoed by the navigators in our survey. Understanding parents’ preferences and the ongoing effects on providers once TK becomes universal will be important to fully assess how the state’s mixed-delivery system of care works for children, families, and providers.
Conclusions
California’s child care landscape has experienced significant changes in recent years, leading to both improvements and disruptions. The pandemic hit child care programs hard, but federal and state funds helped to support providers and reduce costs for families during the crisis. At the same time, the state has expanded access to care and education for the youngest children through more subsidized child care slots and the provision of transitional kindergarten to all four-year-olds as recommended in the 2020 Master Plan for Early Learning and Care. In addition, the method by which the state calculates child care costs that inform reimbursement rates is on the cusp of a dramatic shift, with the goal of improving stability and accessibility. Amid these changes, we examined California’s child care environment with an eye toward understanding the key issues of whether care is affordable for families and sustainable for providers.
Although child care remains expensive, most professionals who match families to child care say that affordability has improved. The state increased the amounts paid to providers for subsidized care during and after the pandemic, and these rate increases were paired with a reduction in family fees and the expansion of free TK for four-year-olds. Combined, these changes point toward improved bottom lines for providers and greater affordability for families. However, providers in our focus groups say that reimbursement rates for subsidized care are not keeping up with costs (despite a statewide increase of 8% above inflation from 2021 to 2025) and that finding affordable care is difficult for families seeking non-traditional hours and those who have children with special needs.
Overall, due to both a decline in the number of children and an increase in the number of child care spaces, there has been growth in the number of slots per child across licensed child care and TK over the past decade. In addition, the capacity of licensed care facilities has stabilized in recent years and small family homes are becoming a larger part of the mix. For large family homes and child care centers, opening and closure rates are low and stable. For small family homes, these rates are much higher, suggesting these facilities are subject to greater instability. Altogether, the evidence points to progress in supply, although we were not able to determine whether the increase has outpaced family demand. Nevertheless, there are some regional differences, as well as a perception among many navigators that the supply has decreased.
The expansion of TK has driven the overall increase in the supply of regulated child care. Navigators agree that TK is drawing four-year-olds away from other forms of child care. This has created difficulties for some providers as their enrollment has skewed toward younger children, changing providers’ training and staffing needs. Meanwhile, families express some wariness about TK as an option due to lack of information about the program and other factors, such as its limited number of hours.
Policymakers can take heart that the supply of child care has surpassed pre-pandemic levels and appears to be responding to the investments the state has made. Family and navigator responses indicate that affordability has increased, and that the time parents spend seeking care is often manageable. Nonetheless, the tensions exhibited in provider and navigator responses suggest that there are unresolved issues regarding care availability, particularly for the youngest children (under age four), and the effects of TK on enrollment in child care programs.
As the state implements the Master Plan on Early Learning and Care, the entire system is adjusting. Continuing to monitor both families’ and providers’ needs can help the system expand successfully, reaching more families who desire care and ensuring that providers of all types are fairly compensated and incentivized to offer high-quality care. Moving forward, it will be important for policymakers and stakeholders to have accurate information to better understand key dimensions of the shifting system, including:
- Whether rate reform improves access for families and sustainability for providers;
- How increased TK access for families is affecting child care providers;
- Whether there is sufficient care, including trends in availability of care for infants and toddlers, variability across the state, and availability of specialized care—for example, during weekends and evening hours and for children with disabilities.
To answer these questions and support the realization of the Master Plan, we urge the state to continue to explore ways to integrate administrative data systems across the state and local agencies that participate in California’s mixed-delivery system of child care. In future research, we will be analyzing data about children receiving subsidies to learn more about dimensions of access beyond cost—including continuity of care, support for children’s development, and support for parents’ employment or training. We will also aim to understand factors behind why some eligible families do not participate in subsidized care.
Topics
Health & Safety NetLearn More

How Expensive Is Child Care in California?

Experts Talk Costs and Supply in California’s Child Care

Testimony: The Economic Toll of Child Care for Californians

California’s Current Child Care Landscape

California’s Care Workforce
