Table of Contents
- Key Findings
- 2024 Election
- State of the State and Approval Ratings
- Economic Conditions
- Homelessness
- Housing Affordability and Accessibility
- The Nation’s Role in International Conflicts
- Federal Approval Ratings
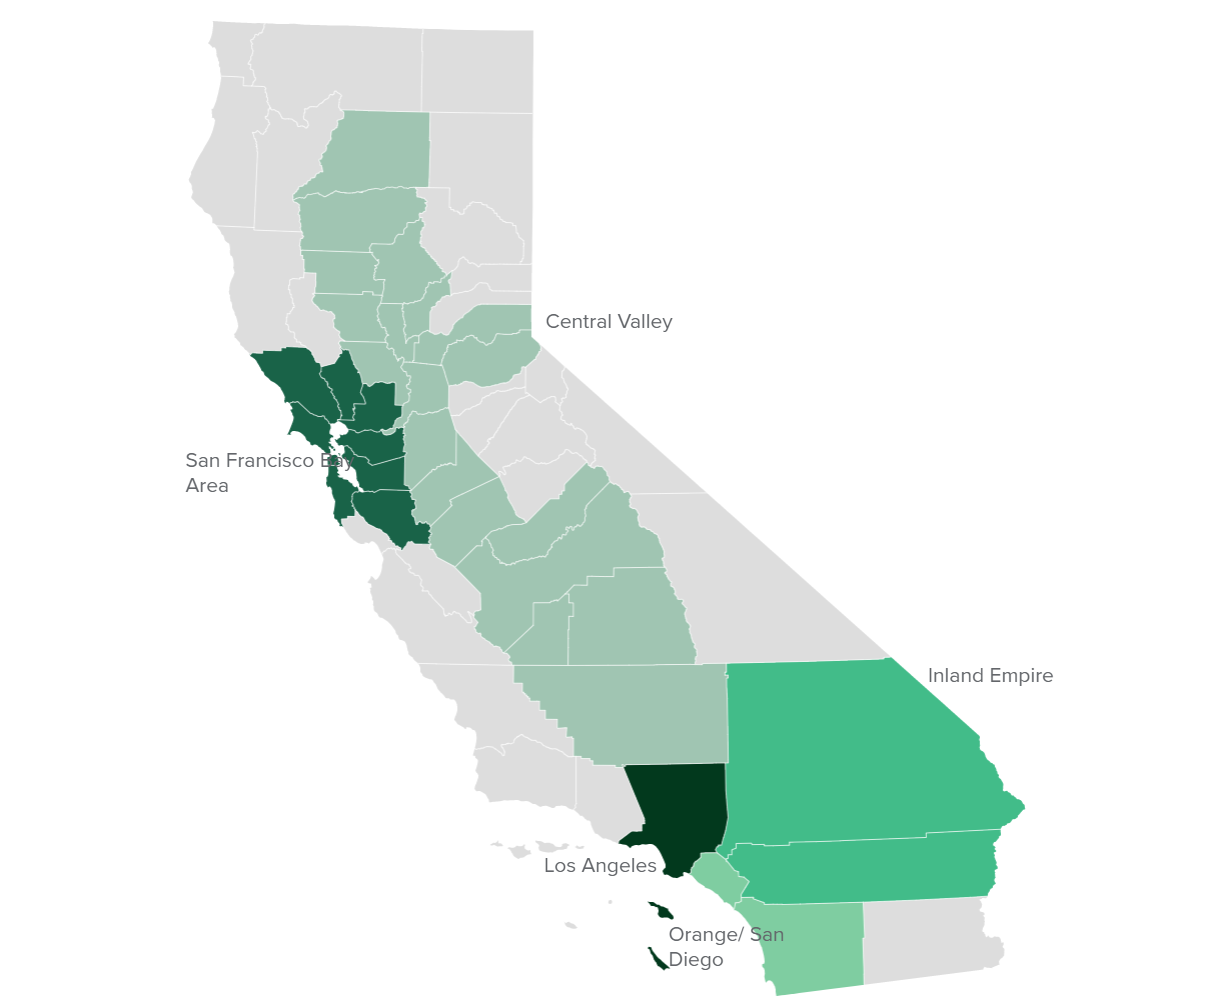
- Regional Map
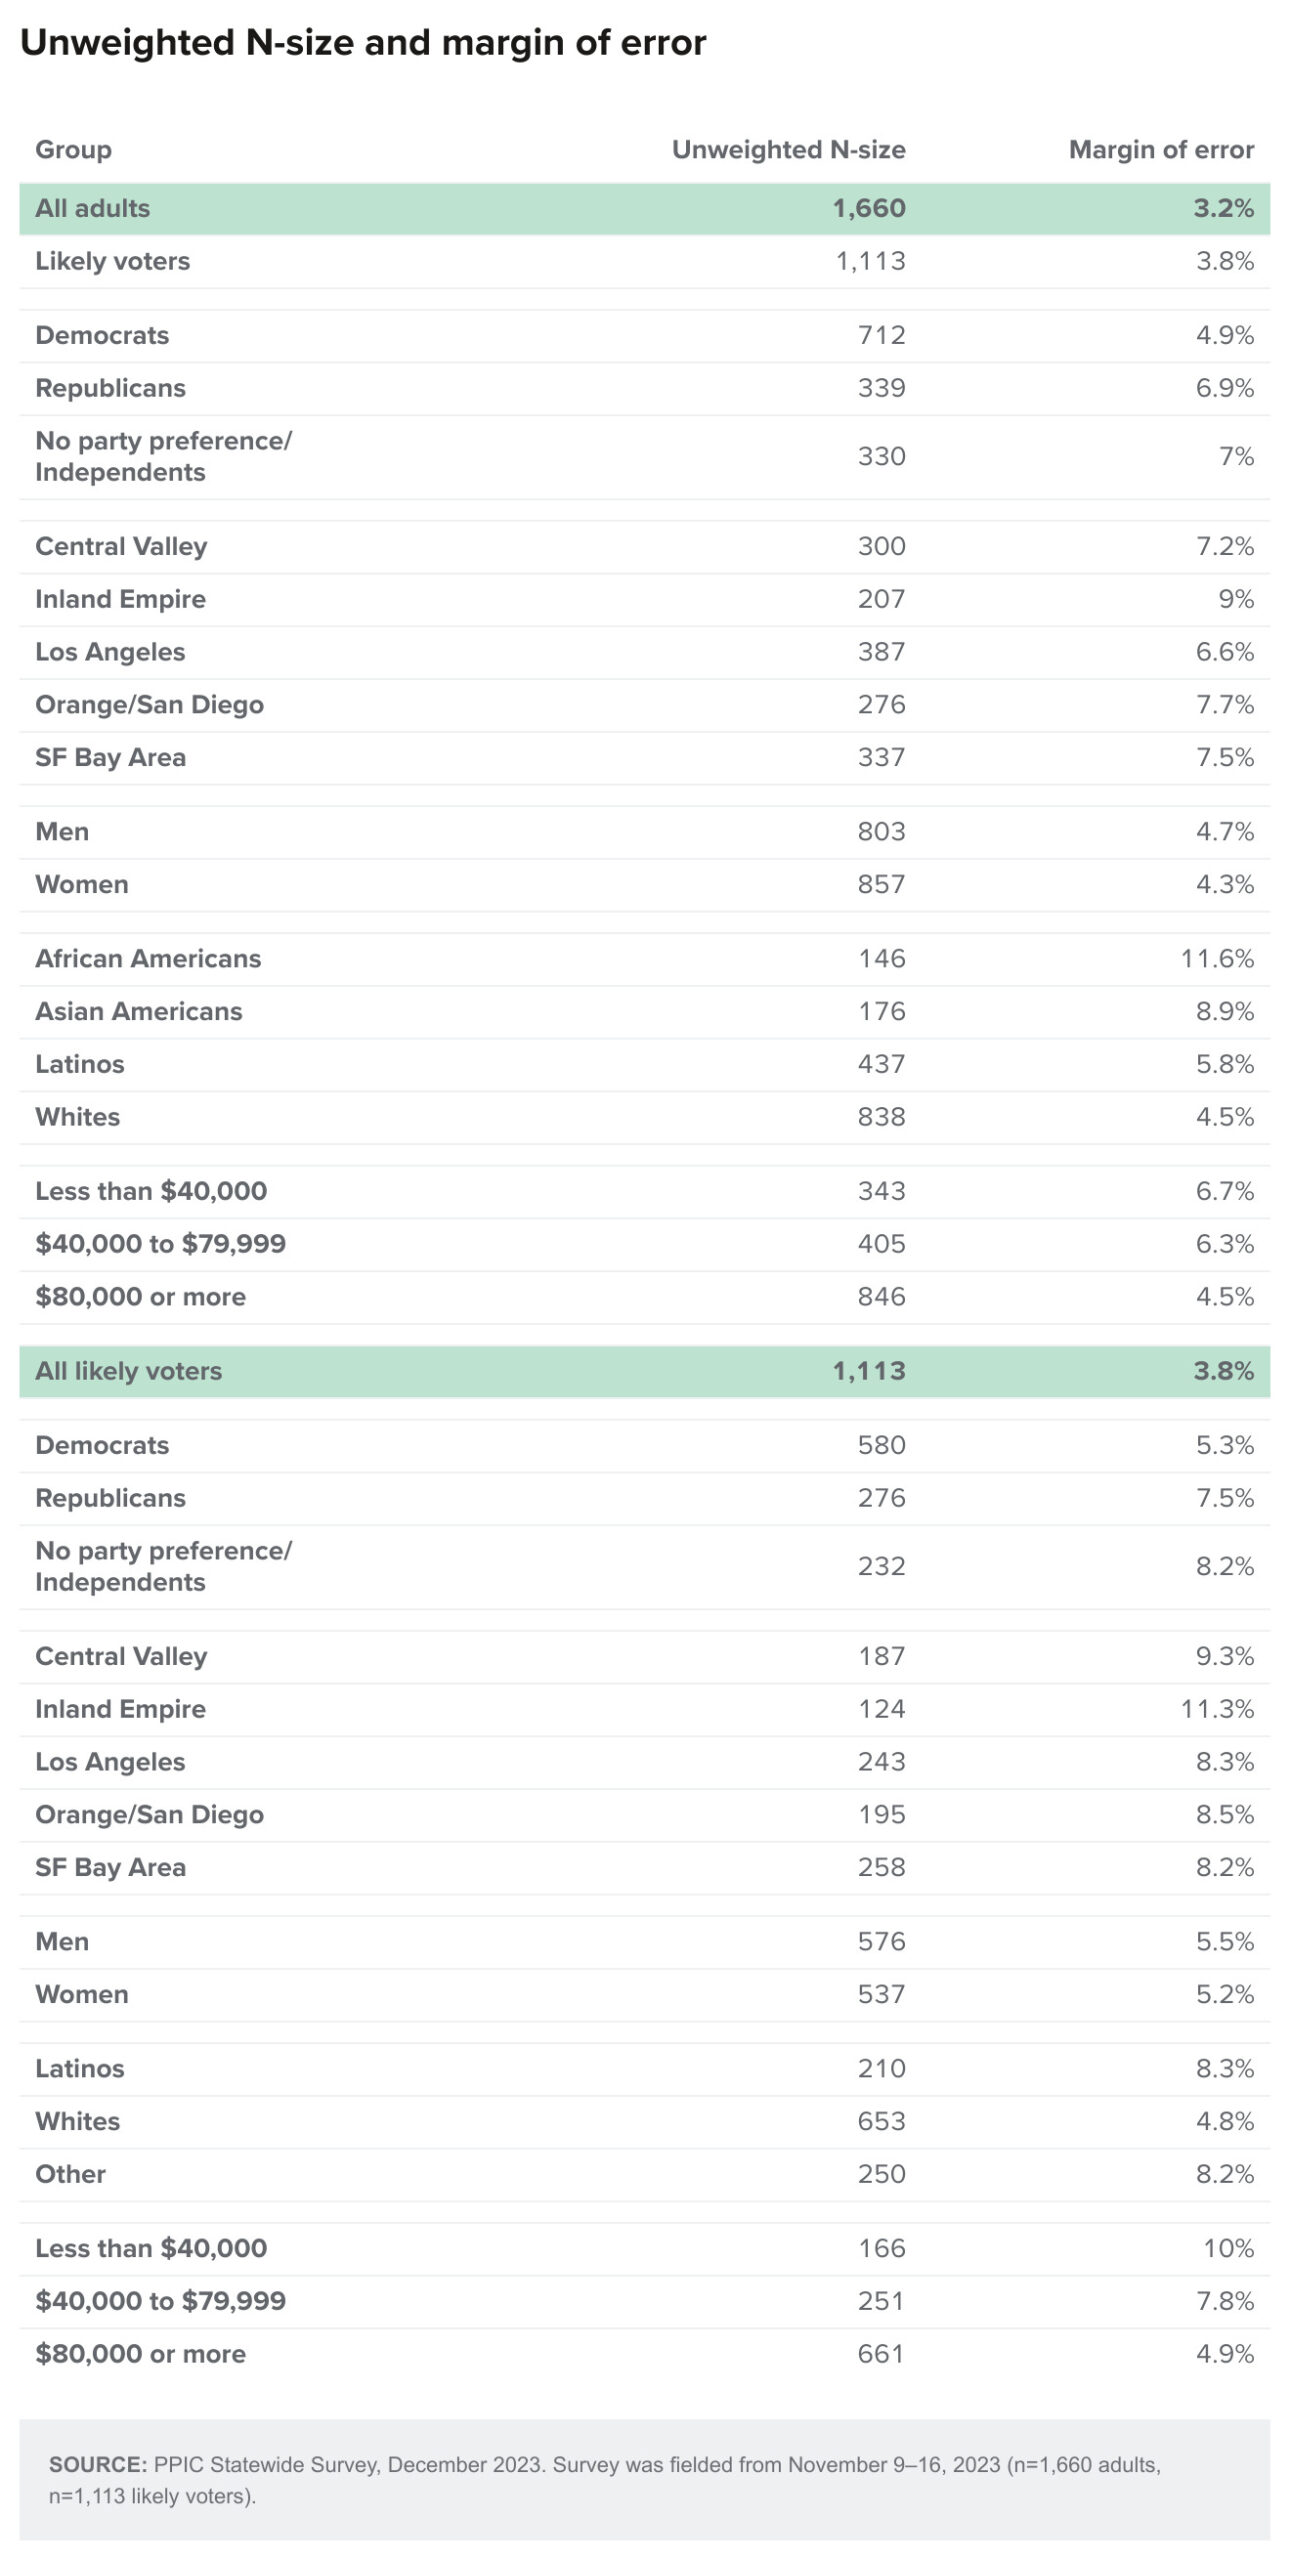
- Methodology
- Questions and Responses
- Authors and Acknowledgments
- PPIC Statewide Advisory Committee
- PPIC Board of Directors
- Copyright
Key Findings
The US economy has been showing signs of a “soft landing” in recent months, with inflation slowing amid employment growth. A closely divided House elected a new Speaker and passed a budget for federal government spending through early 2024. The Israel–Hamas war is weighing heavily on many Californians’ hearts and minds. California’s role in global affairs was front and center when Governor Newsom participated in high-level meetings on climate policy in China and world leaders gathered in San Francisco for the Asia-Pacific Economic Cooperation summit. The March 5 primary gained further clarity when Senator Dianne Feinstein’s replacement—Laphonza Butler—decided not to enter the primary, and four legislative measures were moved to the November ballot, making Proposition 1 the only measure on the March ballot.
This is the 25th year of the PPIC Statewide Survey. These are the key findings of the Californians and Their Government survey on state and national issues conducted from November 9 to 16, 2023:
 Two in three likely voters would vote yes on Proposition 1, which includes the Behavioral Health Bond and Services Act. Democratic congressmembers Adam Schiff and Katie Porter continue to lead in the top-two US Senate primary race. More than half of Republican likely voters say they will vote for former President Donald Trump in the presidential primary. President Joe Biden leads Donald Trump by 24 points in a potential November rematch; overall Democratic House candidates are favored over Republicans by a similarly large margin. About half of likely voters say they are “less enthusiastic” than usual about voting in the November election.→
- Six in ten Californians name economic conditions, homelessness, and housing as the three most important issues facing the people of California today. Partisans agree that economic conditions are the most important state issue. Majorities of adults and likely voters continue to approve of Governor Gavin Newsom, while fewer than half approve of the state legislature. A majority think the state is going in the wrong direction. Partisans are divided on the state’s direction and approval of state elected leaders. →
- Nearly two in three Californians believe the state will have bad times financially during the next 12 months, including majorities across the state’s major regions. However, 46 percent expect the economy in their local area—and 54 percent expect their personal finances—will be about the same six months from now. Strong majorities say they are less comfortable making a major purchase and making other household purchases compared to six months ago. →
- A solid majority continues to view homelessness as a big problem in their part of California. Most are concerned about the presence of homeless people in their local community and see someone who is experiencing homelessness on a frequent basis. About two in ten say they have frequently interacted with homeless people or that they or someone in their close family has experienced homelessness or housing insecurity. Overwhelming majorities say that substance abuse (78%) and lack of affordable housing (70%) are major factors in homelessness in their local community. Majorities across parties favor policies to help people experiencing homelessness. →
 Overwhelming majorities across the state’s major regions view housing affordability as a big problem in their part of California. About half say the cost of housing is a financial strain, and about half of lower-income adults and renters report that the cost of housing causes “a lot” of financial strain. Majorities of Californians across partisan and demographic groups and regions say the state needs more policies geared toward making both homebuying and rental housing more accessible. →
- Ninety-one percent of Californians have heard news about Israeli-Palestinian violence. Thirty-seven percent of adults and 48 percent of likely voters think that the US has a responsibility to “do something” about the fighting between Israel and Hamas. Twenty-eight percent of adults say the US should take Israel’s side and 9 percent say the US should take the Palestinians’ side, while 61 percent say that the US should not take either side. Twenty-nine percent think the US is providing “too much” support to Ukraine—up from 13 percent in May 2022. Forty-six percent of adults and 58 percent of likely voters think that Congress should authorize additional funding to support Ukraine in its war with Russia. →
- About half of adults and a majority of likely voters approve of President Joe Biden. About two in ten approve of Congress, with partisans in agreement. About half of adults and a majority of likely voters approve of Senator Alex Padilla. Forty-four percent of adults and half of likely voters have a favorable view of Senator Laphonza Butler. About three in ten adults and likely voters have a favorable opinion of Mike Johnson, the new Speaker of the House, including 15 percent of Democrats, 66 percent of independents, and 28 percent of Republicans. →
 Overwhelming majorities across the state’s major regions view housing affordability as a big problem in their part of California. About half say the cost of housing is a financial strain, and about half of lower-income adults and renters report that the cost of housing causes “a lot” of financial strain. Majorities of Californians across partisan and demographic groups and regions say the state needs more policies geared toward making both homebuying and rental housing more accessible.
 2024 Election
California’s March 5 primary sets the stage for the November 5 general election, which includes the presidential race, a US Senate race, and House district races that will help determine which party controls the 119th Congress. Proposition 1, a legislative measure that includes the Behavioral Health Bond and Services Act, is also on the March ballot. Many experts are describing the 2024 elections as the most consequential in our lifetime. However, when asked about next November’s presidential election, 52 percent of likely voters say they are “less enthusiastic” about voting than usual. An identical share are “less enthusiastic” about voting in the November congressional elections. Today, only 20 percent are “very closely” following the news about the 2024 presidential candidates.
Here are the latest readings on the key races and Proposition 1 on the March 2024 ballot:
March Senate primary. Newly appointed US Senator Laphonza Butler recently announced that she would not be a candidate in the March Senate primary, and Republican Steve Garvey recently announced his late entry in the Senate race. Democratic congressmembers Adam Schiff (21%) and Katie Porter (16%) continue to lead in the top-two primary race, which will determine who will be on the November ballot. Steve Garvey (10%) and Congressmember Barbara Lee (8%) are in third and fourth place, while less than 5 percent support any other candidate and 14 percent are undecided (1% would vote for someone else not listed, 2% would not vote in the US senator race). Schiff and Porter were also frontrunners in the July, September, and November PPIC Statewide Surveys. Today, Schiff leads all other candidates in most demographic groups and in every region except for Orange/San Diego (17% Schiff, 22% Porter). Notably, Porter leads Schiff among those under the age of 45 (23% to 11%), while Schiff leads Porter for those 45 and older (26% to 12%). Fifty-nine percent of likely voters and majorities across regions and demographic groups are satisfied with the choice of candidates, though there is a partisan divide (76% Democrats, 37% Republicans, 48% independents).
Democratic candidates Adam Schiff and Katie Porter lead in the top-two US Senate primary race

SOURCE: PPIC Statewide Survey, December 2023. Survey was fielded from November 9–16, 2023 (n=1,660 adults, n=1,113 likely voters).
NOTES: *Other candidates includes the “someone else (specify)” response option and any candidates below the top four. Among likely voters only.
Republican presidential primary. The majority of Republican primary likely voters say they would vote for former president Donald Trump (56%) in the presidential primary. Trump’s support had been at around 50 percent earlier this year (50% June, 50% July, 48% September, 53% November). Today, the closest competitors are former South Carolina governor Nikki Haley, at 13 percent, and Florida governor Ron DeSantis, at 12 percent. Support for other candidates—including Chris Christie (5%)—is under 10 percent, and just 1 percent say they don’t know who they will vote for (3% someone else, 1% would not vote in Republican primary). Trump’s support is at 61 percent among conservatives. While fewer than half of college graduates support Trump (43%), he also leads DeSantis (19%), Haley (28%), and Christie (6%) among this group.
A majority of Republican likely voters would vote for Donald Trump if the Republican presidential primary were held today
Top 4 candidates

SOURCE: PPIC Statewide Survey, December 2023. Survey was fielded from November 9–16, 2023 (n=1,660 adults, n=1,113 likely voters).
NOTES:*Other candidates includes the “someone else (specify)” response option and any candidates below the top four. Among Republican likely voters only.
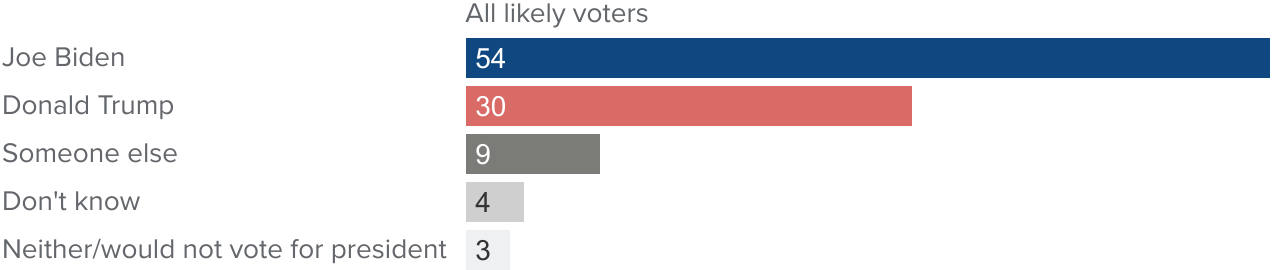
Presidential election. Given a November 2024 presidential election between Joe Biden and Donald Trump, California likely voters would choose Biden by a wide margin (54% to 30%). The large margin of support is similar to the PPIC Surveys in June (58% Biden, 25% Trump), July (57% Biden, 31% Trump), September (57% Biden, 26% Trump), and November (60% Biden, 29% Trump). These findings are consistent with Biden’s margin of victory in the 2020 California election (63.5% Biden, 34.3% Trump). Today, there is a wide partisan divide: 85 percent of Democrats would vote for Biden, 80 percent of Republicans support Trump, and independents would vote for Biden by almost a two-to-one margin (42% Biden, 23% Trump). Majorities of likely voters across age, gender, and income groups say they would vote for Biden, while support for Biden varies across regions (63% San Francisco Bay Area, 60% Los Angeles, 50% Central Valley, 46% Orange/San Diego, 40% Inland Empire). Biden has strong support among college graduates (63% Biden, 22% Trump) and those with some college education (51% Biden, 31% Trump), while those with high school or less education are divided (41% Biden, 43% Trump). As there was in surveys earlier this year, there is some interest in a third choice. Today, 9 percent say they would vote for “someone else” for president; shares with this view vary widely among partisans (4% Democrats, 6% Republicans, 22% independents), while shares are similar across demographic groups and across regions.
Joe Biden continues to lead over Donald Trump by a wide margin
SOURCE: PPIC Statewide Survey, December 2023. Survey was fielded from November 9–16, 2023 (n=1,660 adults, n=1,113 likely voters).
NOTES: Among likely voters only.
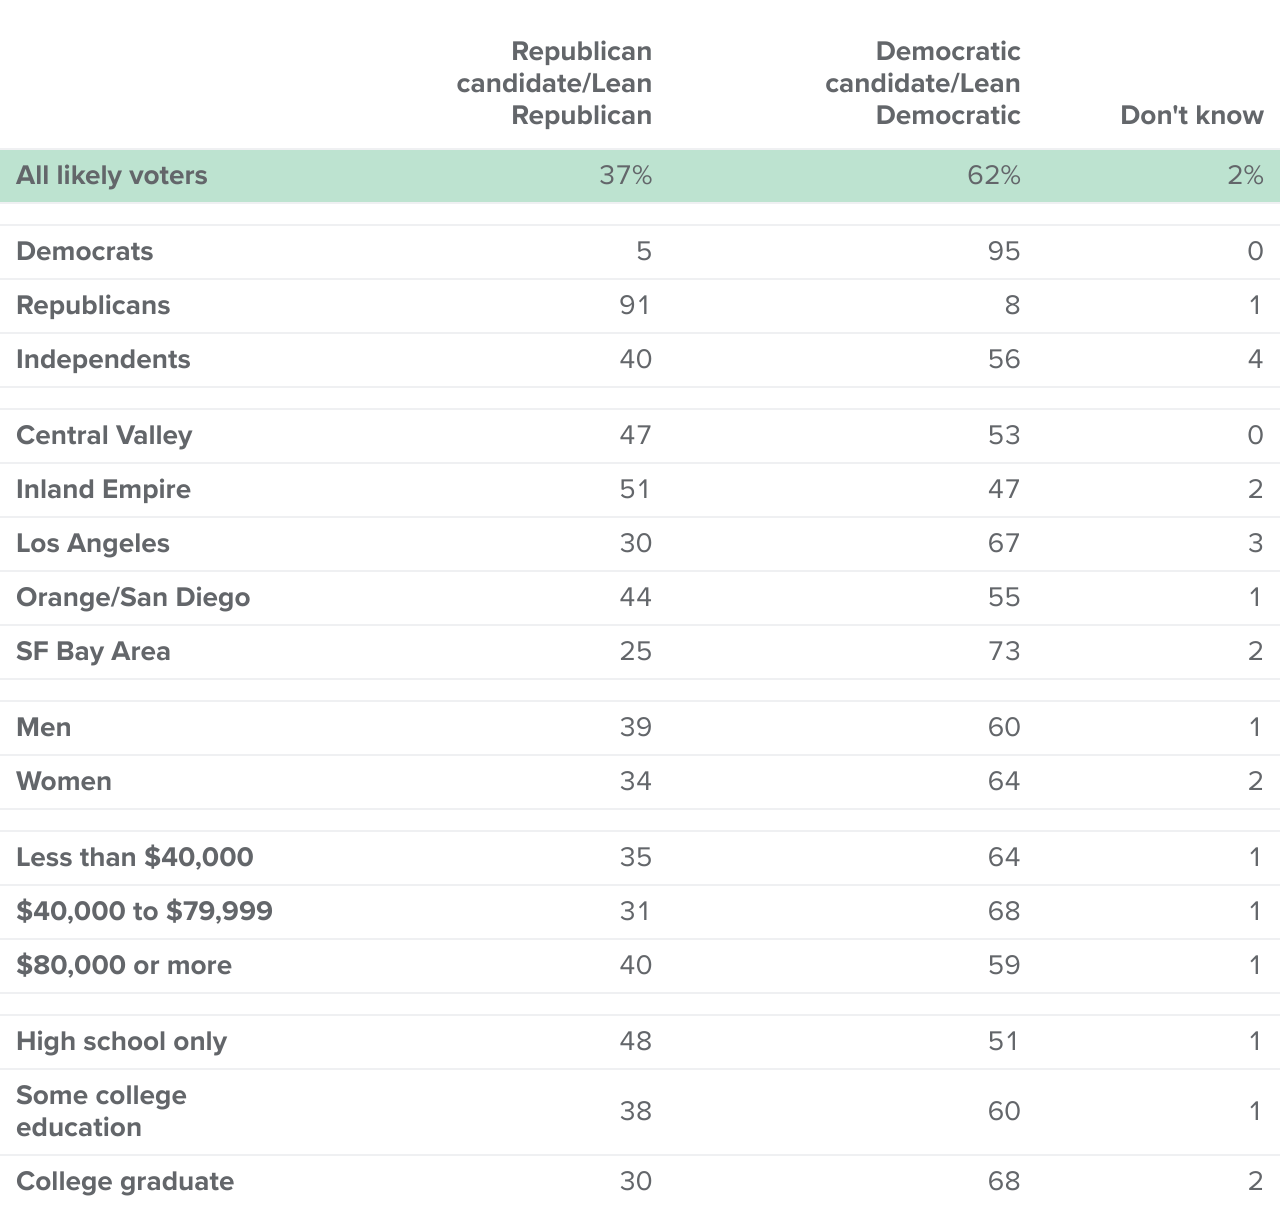
House district races. Will the lopsided top-of-the-ticket presidential race and the likelihood of two Democrats appearing on the Senate ballot in November help Democratic candidates win House seats? And will the intra-party conflict and dysfunction in the House this year have a negative impact on support for Republican candidates? If the 2024 election for the US House of Representatives were held today, 62 percent of likely voters say they would vote for or lean toward the Democratic candidate, while 37 percent would vote for or lean toward the Republican candidate. Majorities across most of the state’s major regions and across demographic groups would vote for the Democratic candidate. Residents in the Inland Empire are move divided, about half (51%) would vote for the Republican candidate. Importantly, 91 percent of Republicans and 95 percent of Democrats would vote for their party’s House candidate, while independents lean toward the Democrat by a 16-point margin (56% to 40%).
Proposition 1. Sixty-eight percent of likely voters say they would vote yes and 30 percent would vote no after reading a brief description of Proposition 1, which includes the legislature’s Behavioral Health Bond and Services Act (the ballot label and title were not made public in time for this survey). Majorities across demographic groups and across regions say they would vote yes, while partisans are divided (85% Democrats, 40% Republicans, 66% independents). We asked two follow-up questions on the Behavioral Health Bond and Services Act. Fifty-one percent of likely voters say it is a “good time” (46% “bad time”) to issue $6.38 billion in bonds to fund housing for homeless individuals and veterans with mental health or substance abuse disorders. Shares viewing this as a “good time” vary across political groups (68% Democrats, 24% Republicans, 47% independents) and across income levels (64% less than $40,000; 54% $40,000 to $79,999; 46% $80,000 or more). When asked about the Mental Health Services Act—enacted by voters in 2004 to fund county mental health services with revenue from a 1 percent tax of income above $1 million—64 percent say that changes are needed (30% major, 34% minor). Majorities across partisan and demographic groups and across regions think that changes are needed. Thirty-three percent believe that the Mental Health Services Act is “fine the way it is.”
A solid majority of California likely voters would vote for the Democratic candidate if the 2024 election for the House of Representatives were held today
Among likely voters
SOURCE: PPIC Statewide Survey, December 2023. Survey was fielded from November 9–16, 2023 (n=1,660 adults, n=1,113 likely voters).
NOTES: Among likely voters only.
State of the State and Approval Ratings
When asked to name the most important issue facing the people of California today, Californians most often say jobs, the economy, and inflation (31%). Fewer mention housing costs and affordability (15%), homelessness (14%), crime (8%), and environmental issues (6%). Notably, the economy has been the top issue mentioned by Californians dating back to May 2022.
About four in ten Californians think things in the state are going in the right direction, while nearly six in ten say things are headed in the wrong direction. A majority have said things are going in the wrong direction since June. Today, nine in ten Republicans (90%) and about two in three independents (68%) say things are going in the wrong direction, compared to just one in three Democrats (32%). Half or more across regions are pessimistic; negative views are most prevalent in the Inland Empire (68%), followed by the Central Valley (62%), Orange/San Diego (58%), Los Angeles (54%), and the San Francisco Bay Area (50%). Across racial/ethnic groups, six in ten Latinos and whites (60% each) say things are going in the wrong direction, while fewer than half of African Americans and Asian Americans (46% each) hold this view. Majorities across age and income groups think things are going in the wrong direction.
A majority of Californians continue to think things in the state are going in the wrong direction
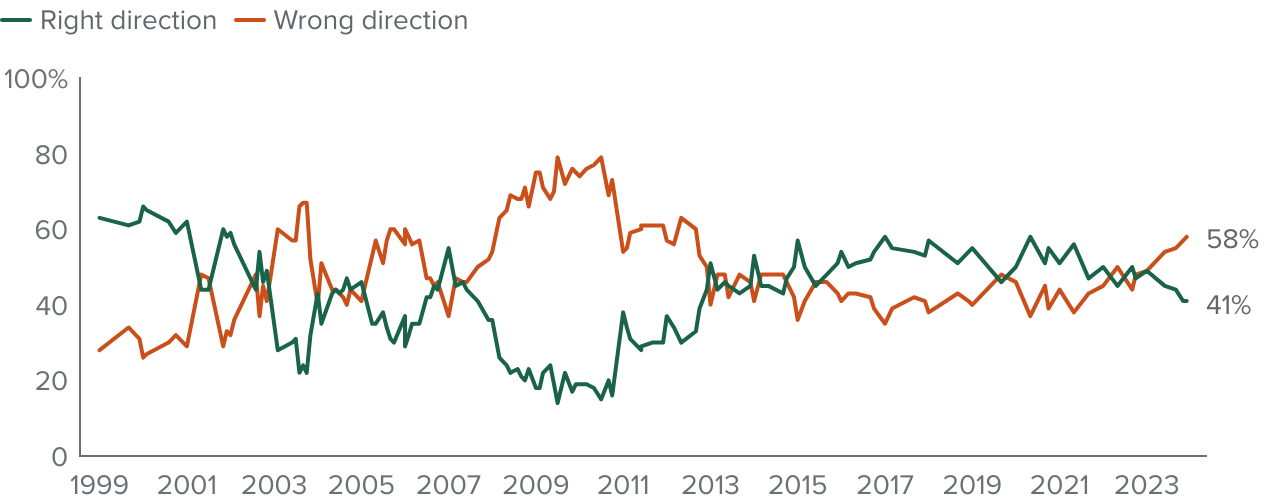
SOURCE: PPIC Statewide Surveys, 1999–2023.
A majority of Californians (52%) continue to approve of the job that Gavin Newsom is doing as governor. Approval was similar last October (54%), and a majority has approved of Governor Newsom since January 2020. Fewer than half of Californians (45%) approve of the job that the California Legislature is doing. Approval was similar last October (49%); it has ranged from 45 percent to 56 percent since January 2020.
A majority approve of Governor Newsom, while less than half approve of the state legislature
% approve

SOURCE: PPIC Statewide Surveys, 1999–2023.
While a majority across most demographic groups approve of the job Governor Newsom is doing, there are partisan and regional divides. More than three in four Democrats approve, while nearly nine in ten Republicans disapprove. Independents are more likely to disapprove than approve. Across regions, majorities approve in the San Francisco Bay Area and Los Angeles, compared to fewer than half elsewhere. African Americans are much more likely than other racial/ethnic groups to approve of the governor’s job performance, and approval is stronger among those with a college degree compared to those with less education.
Fewer than half of Californians approve of the way that the California Legislature is handling its job. Democrats, San Francisco Bay Area residents, African Americans, and college graduates are the only groups in which there is majority approval.
Approval of state elected leaders varies demographically and regionally
% approval
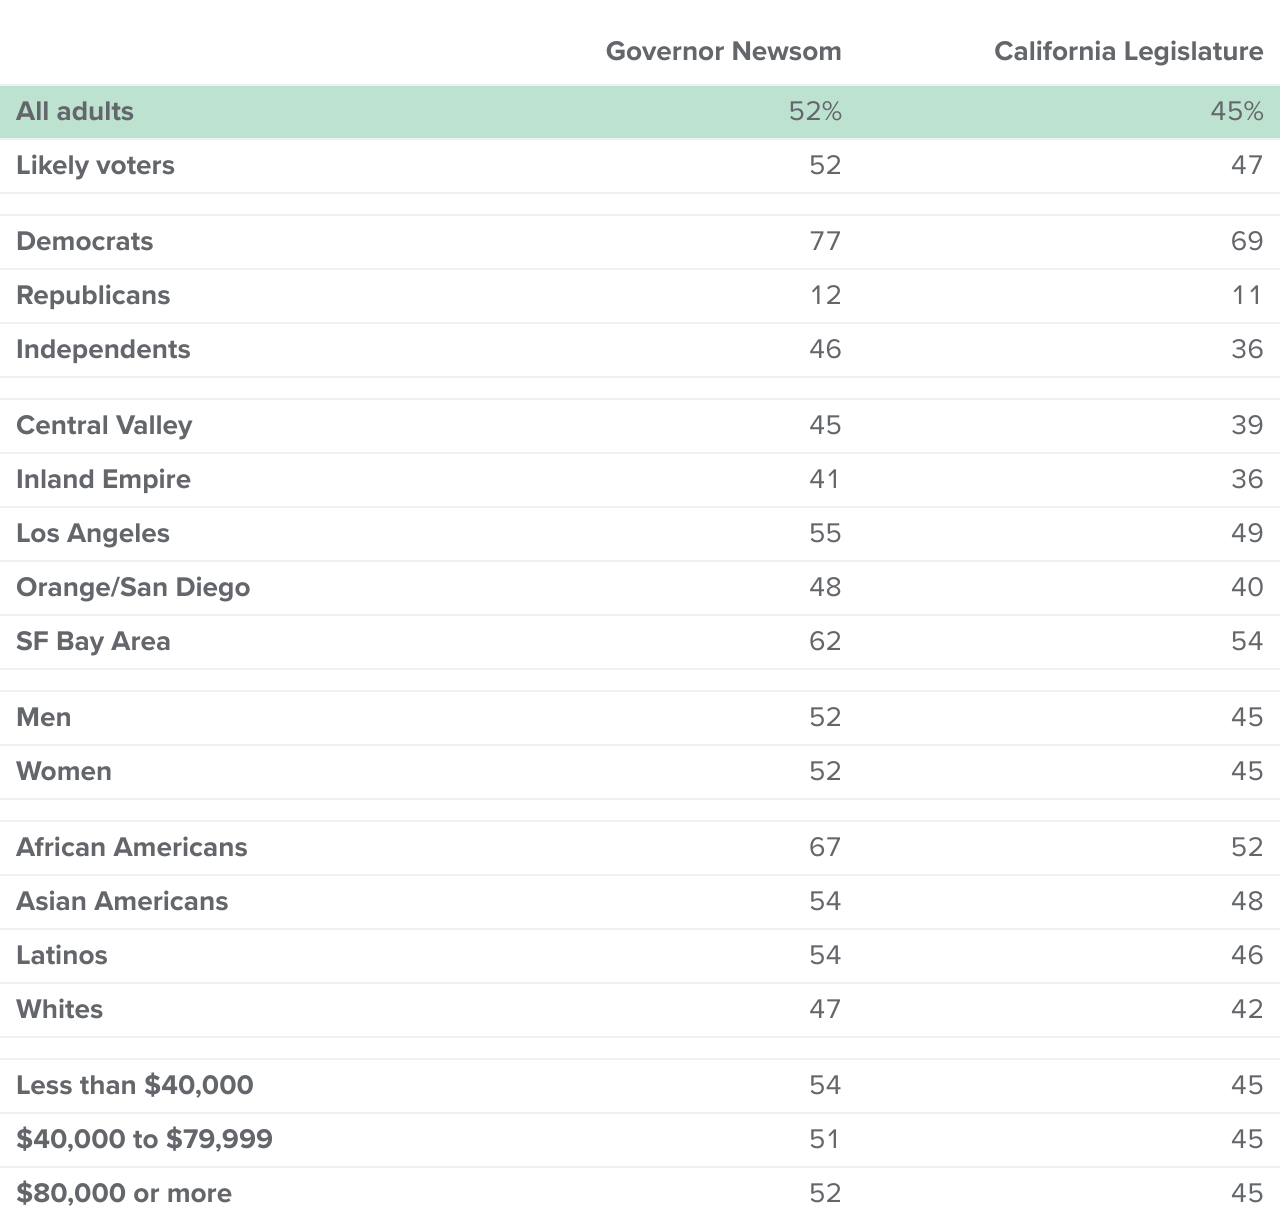
SOURCE: PPIC Statewide Survey, December 2023. Survey was fielded from November 9–16, 2023 (n=1,660 adults, n=1,113 likely voters).
Economic Conditions
About two in three Californians say they expect bad economic times in the next year, while just one in three expects good times. About two in three or more have expected bad times since July 2022. The share expecting bad times is lower among Democrats (47%) compared to independents (71%) and Republicans (87%). Pessimistic views are widespread across regions; they are most prevalent in the Inland Empire (78%) and least prevalent in Los Angeles (59%). The share expecting bad times is slightly lower among those 55 and older (61%), college graduates (60%), and those with incomes over $80,000 (61%).
Most Californians expect bad economic times in the next year
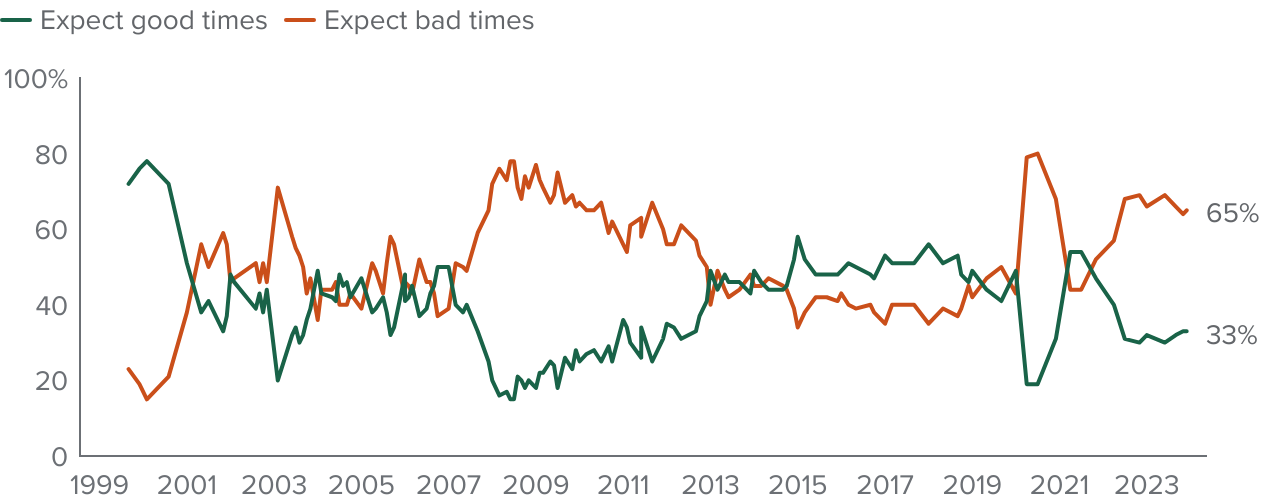
SOURCE: PPIC Statewide Surveys, 1999–2023.
A plurality of Californians expect the economy in their local area to be about the same six months from now, while four in ten expect it to be weaker and about one in ten say it will be stronger. Views were nearly identical in September—the first time we asked this question. Pessimism about the local economy is slightly higher in the Inland Empire and Central Valley than elsewhere in the state. While differences across demographic groups are minimal, there is a wide partisan divide: six in ten Republicans (60%) are pessimistic, compared to nearly half of independents (47%) and one in four Democrats (24%).
Close to half of Californians think their local economy will be about the same six months from now
SOURCE: PPIC Statewide Survey, December 2023. Survey was fielded from November 9–16, 2023 (n=1,660 adults, n=1,113 likely voters).
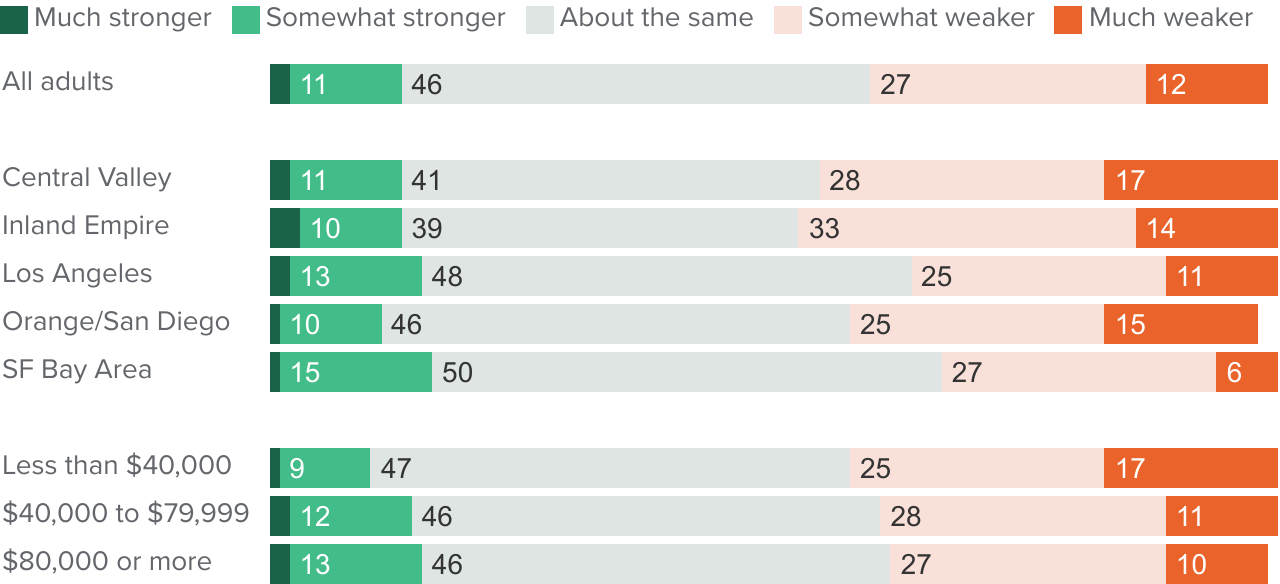
Californians have rosier views of their personal financial situations. A majority say they think their financial state will be about the same (54%) in six months, while one in four say it will be weaker (18% somewhat weaker, 7% much weaker), and one in five say their finances will be stronger (4% much stronger, 16% somewhat stronger). Perceptions were nearly identical in September. The share expecting their personal financial situation to be weaker is nearly twice as high among Republicans (35%) than Democrats (18%), while three in ten independents (31%) hold this view. San Francisco Bay Area residents (11% somewhat weaker, 6% much weaker) are less likely to be pessimistic than those in Los Angeles (18% somewhat weaker, 7% much weaker), the Inland Empire (16% somewhat weaker, 11% much weaker), the Central Valley (20% somewhat weaker, 8% much weaker), and Orange/San Diego (22% somewhat weaker, 7% much weaker). Financial pessimism declines with rising income and educational attainment.
When asked how they feel about making purchases today compared to six months ago, most Californians say they are less comfortable. About three in four Californians (74%) say they are less comfortable making a major purchase, like a home or car, while roughly two in three (66%) say they are less comfortable about making other household purchases. In September, views were nearly identical: 75 percent were less comfortable making major purchases while 65 percent were less comfortable about other household purchases.
While solid majorities across parties are less comfortable about making a major purchase, Republicans and independents are much more likely than Democrats to hold this view. Across regions, residents in the Inland Empire (82%) are the most likely to say they feel less comfortable, while those in Orange/San Diego (65%) are the least likely to feel this way. The share saying they are less comfortable is mostly similar across racial/ethnic, age, and gender groups, although college graduates and those making $80,000 or more are slightly less likely than others to hold this view.
Similar patterns emerge when it comes to making other household purchases. Democrats are less likely than independents and Republicans to say they are less comfortable. Residents in the Inland Empire are most likely—and those in Orange/San Diego are least likely—to hold this view. Latinos and African Americans are somewhat more likely than Asian Americans and whites to say they are less comfortable making other household purchases. The share expressing this view declines sharply with rising educational attainment and is more common among those with incomes of less than $40,000 compared to others.
A majority expect their personal financial situation to be the same in six months; most are less comfortable making purchases compared to six months ago

SOURCE: PPIC Statewide Survey, December 2023. Survey was fielded from November 9–16, 2023 (n=1,660 adults, n=1,113 likely voters).
Homelessness
Nearly all Californians say homelessness is at least somewhat of a problem in their part of the state; 64 percent say it is a big problem (32% somewhat of a problem, 4% not a problem). The share saying this is a big problem is somewhat similar to February (70%), and at least six in ten have said this since May 2019, the first time PPIC asked this question. Today, majorities across partisan, demographic, and regional groups hold this view.
Eighty-six percent of California adults say that they are very (45%) or somewhat (41%) concerned about the presence of homeless people in their local communities. A similar share said they were very concerned last March (46%), though this share has been declining since November 2019 (58%). Today, four in ten or more among partisan, racial/ethnic, gender, age, income, and educational groups say they are very concerned. Across regions, Los Angeles residents (50%) are most likely to say they are very concerned, while Orange/San Diego residents (37%) are least likely to say this.
When asked about potential factors contributing to homelessness in their communities, about eight in ten adults and likely voters say that substance abuse is a major factor, about seven in ten say the lack of affordable housing is a major factor, and six in ten or more say the lack of mental health services or loss or reduced income is a major factor. Majorities of Republicans, Democrats, and independents agree that substance abuse and the lack of affordable housing are major factors. However, when it comes to a lack of mental health services and loss of income, about half of Republicans say this compared to majorities of Democrats and independents. Majorities across demographic groups and regions say these are all major factors.
Most Californians say that a number of major factors are contributing to homelessness in their local communities
% saying major factor
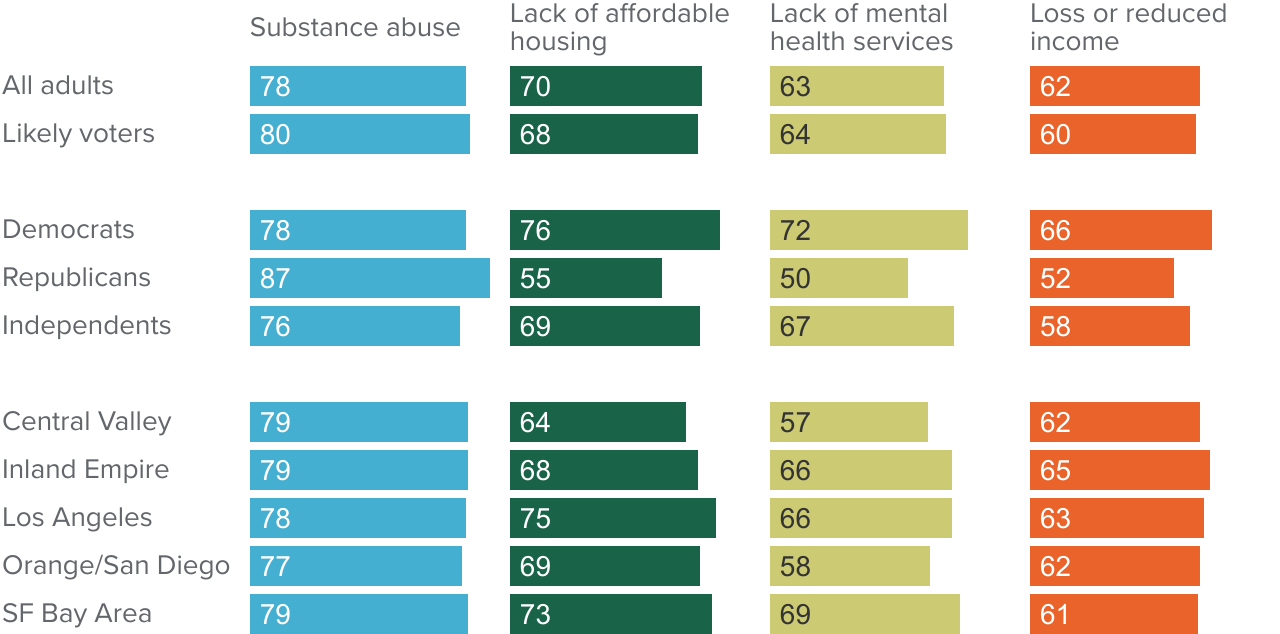
SOURCE: PPIC Statewide Survey, December 2023. Survey was fielded from November 9–16, 2023 (n=1,660 adults, n=1,113 likely voters).
Asked about policy ideas to help homeless people in California, 78 percent of adults and likely voters each support providing short-term financial support for homeless families (oppose: 21% adults and likely voters each), with the support of solid majorities among Democrats, Republicans, and independents. Overwhelming majorities across race/ethnicity, gender, age, education, income, and regions say they support this.
Overwhelming majorities of adults and likely voters (77% each) also support converting empty office spaces in cities into affordable housing (oppose: 22% each adults and likely voters). Majorities of Republicans, Democrats, and independents support this policy as well, and more than seven in ten across demographic and regional groups say this.
More than three in four adults (77%) and likely voters (76%) say they support building developments of tiny or small homes across the state (oppose: 22% adults, 24% likely voters); majorities across parties and overwhelming majorities across demographic groups and regions express support.
Majorities across parties favor policies to help people experiencing homelessness in California
% support
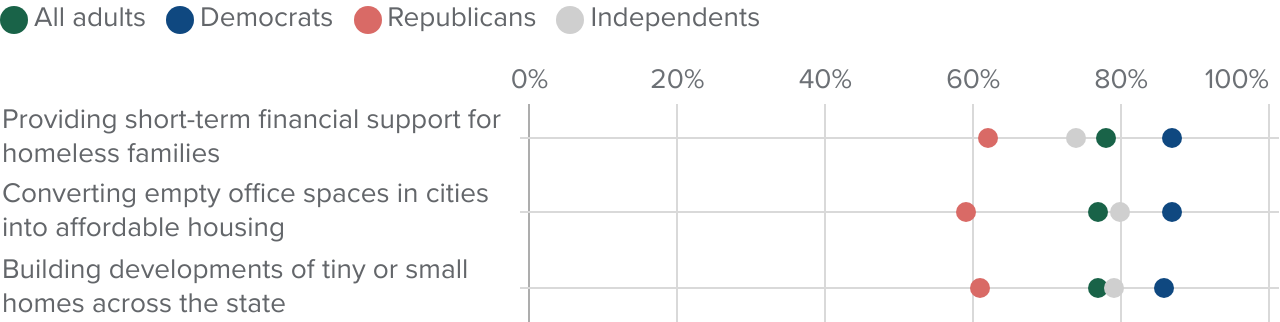
SOURCE: PPIC Statewide Survey, December 2023. Survey was fielded from November 9–16, 2023 (n=1,660 adults, n=1,113 likely voters).
About two in ten Californians (21%) say they or someone in their close family has experienced housing insecurity or homelessness, including 10 percent who say they themselves experienced this (11% say another person in their family had this experience). About eight in ten (79%) say this has not happened to them or a family member. African Americans are about twice as likely or more than any other racial/ethnic group to say they or a family member have had this experience—also, African Americans (26%) are far more likely than any other racial/ethnic group to say they personally have had this experience (11% Latinos, 9% whites, 2% Asian Americans). Across regions, Central Valley residents are the most likely to say they or a family member have experienced homelessness, and residents in the San Francisco Bay Area are the least likely to say this. The shares saying this decline as income and education rises. Women are somewhat more likely than men, and renters are about twice as likely as homeowners to say this.
More than seven in ten Californians say they see someone experiencing homelessness daily (53%) or every few days (19%), while one in seven (or fewer) say they see a homeless person weekly (14%) or rarely (11%), and 3 percent say they have never had this experience. About half or more across parties say they see a person experiencing homelessness daily. Across racial/ethnic groups, majorities of African Americans, Latinos, and whites say this, compared to 32 percent of Asian Americans. The shares who say they see a homeless person daily decline as education and income increase. Majorities of residents in Los Angeles, the Central Valley, and the Inland Empire say this, compared to fewer in other regions.
Far fewer say they have interacted with someone experiencing homelessness. Two in ten residents say they have interacted with someone who is homeless on a daily basis (9%) or every few days (10%); one in ten say they have interactions weekly, while 45 percent say they seldom have interactions, and 26 percent say they never do. African Americans, those without a college degree, and those with incomes under $40,000 are the most likely demographic groups to say they interact with a homeless person daily. Across regions, about one in ten residents in Los Angeles, the Central Valley, and Orange/San Diego say this, compared to somewhat fewer elsewhere.
Californians report varying levels of experience with homelessness

SOURCE: PPIC Statewide Survey, December 2023. Survey was fielded from November 9–16, 2023 (n=1,660 adults, n=1,113 likely voters).
Housing Affordability and Accessibility
Nearly all Californians say that housing affordability is at least somewhat of a problem in their part of the state, and more than three in four say it is a big problem (77%; 20% somewhat of a problem). The share saying it is a big problem was somewhat similar in February (70%) and has been increasing since March 2021 (61%). Today, three in four or more among partisan groups say housing affordability is a big problem. Overwhelming majorities across regions and across most demographic groups say this. Renters (83%) are more likely than homeowners (72%) to see affordability as a big problem.
Nearly all adults say housing affordability is a problem in California
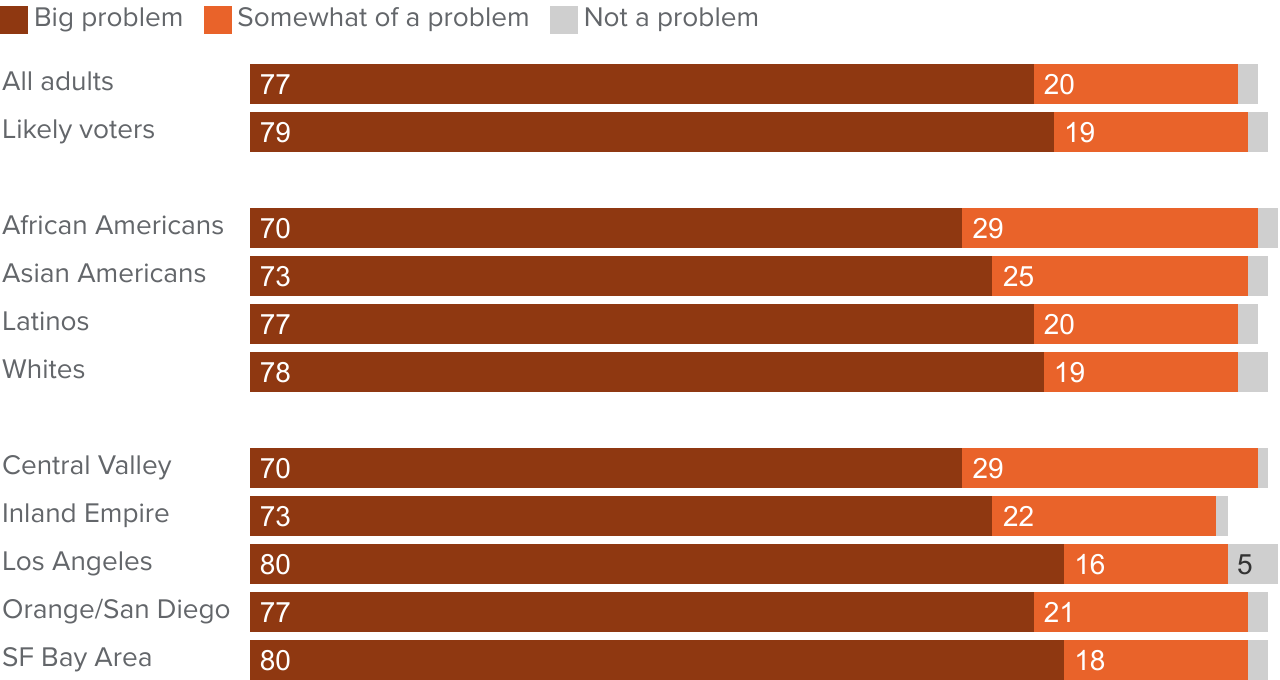
SOURCE: PPIC Statewide Survey, December 2023. Survey was fielded from November 9–16, 2023 (n=1,660 adults, n=1,113 likely voters).
About half of Californians say that the cost of housing is a financial strain for them and their families, including one in three who say it places a lot of strain on them (34%; 17% yes, a little). The share saying the cost of housing places a lot of financial strain on them has increased somewhat since the last time PPIC asked this question via telephone survey in May 2017, (27% yes, a lot; 18% yes, a little, 2% not sure how much). Today, independents (36%) and Republicans (33%) are more likely than Democrats (23%) to say housing places a lot of financial strain on them. Across racial/ethnic groups, Latinos and African Americans are most likely to hold this view, compared to fewer Asian Americans and whites. Residents in the Inland Empire are more likely than residents elsewhere to say that the cost of housing places a lot of financial strain on them. Adults with a high school education or less are far more likely than those with more education, and those earning less than $40,000 are far more likely than those earning more to say this. Fifty-one percent of renters in the state say housing costs place a lot of financial strain on them, compared to far fewer homeowners (19%).
Half of Californians say the cost of housing places financial strain on them and their families
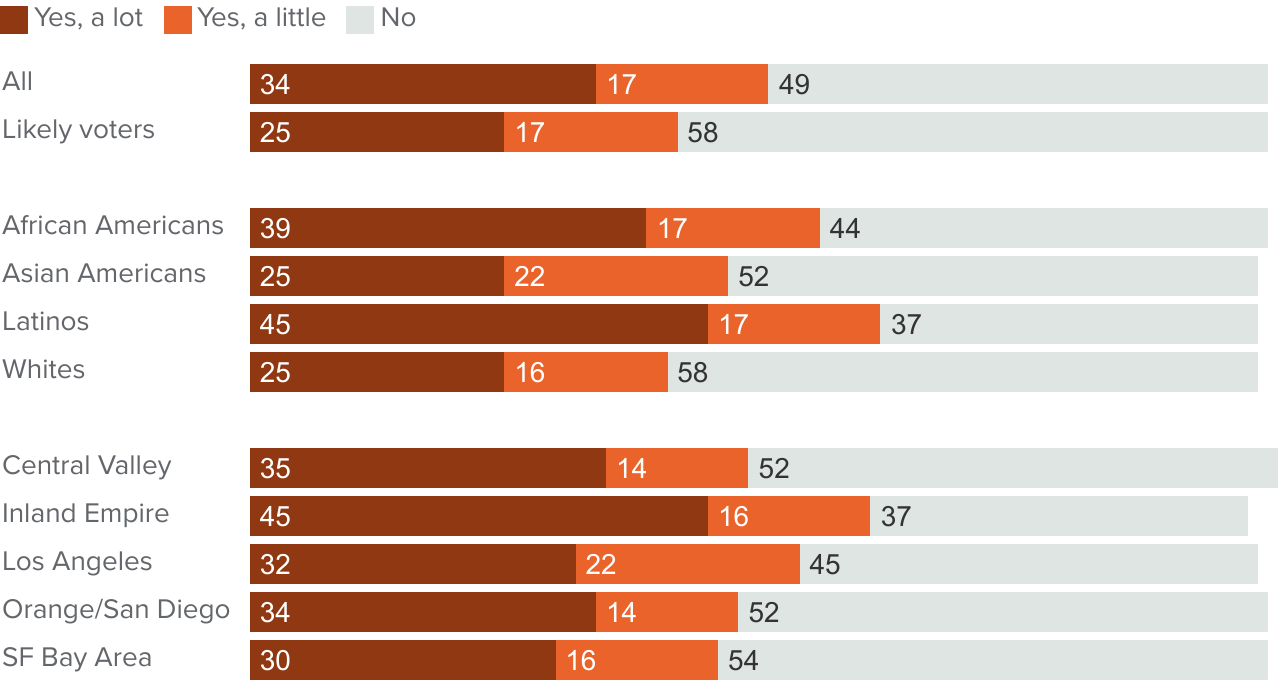
SOURCE: PPIC Statewide Survey, December 2023. Survey was fielded from November 9–16, 2023 (n=1,660 adults, n=1,113 likely voters).
Roughly three in four adults (54% a lot more, 22% some) and likely voters (45% a lot more, 24% some) say that California needs more policies geared toward making homebuying more accessible. While majorities across parties say more policies are needed, there is a partisan divide: a solid majority of Democrats and a slim majority of independents say a lot more are needed, compared to about three in ten Republicans. Majorities across demographic groups and regions say more needs to be done. Across racial/ethnic groups, strong majorities of Latinos (69%) and African Americans (67%) say a lot more needs to be done, compared to roughly four in ten Asian Americans (43%) and whites (42%). The share expressing this view declines with rising age, education, and income. Renters (68%) are far more likely than homeowners (42%) to say that a lot more policies geared toward making homeownership more accessible are needed.
About three in four adults (54% a lot more, 20% some) and likely voters (49% a lot more, 23% some) say that California needs more policies geared toward making rental housing more accessible. Majorities across partisan, demographic, and regional groups say this. Majorities of Democrats (61%) and independents (53%) say a lot more policies are needed, compared to 33 percent of Republicans. Across racial/ethnic groups, strong majorities of African Americans (73%) and Latinos (65%) say this, compared to fewer than half of whites (46%) and Asian Americans (44%). The share expressing this view declines with rising education, income, and age. Renters (68%) are far more likely than homeowners (42%) to say that a lot more policies geared toward making rental housing more accessible are needed.
About three in four Californians say the state needs more policies geared toward making homebuying and rental housing more accessible
% saying yes, a lot more/yes, some

SOURCE: PPIC Statewide Survey, December 2023. Survey was fielded from November 9–16, 2023 (n=1,660 adults, n=1,113 likely voters).
The Nation’s Role in International Conflicts
In late October, President Biden unveiled a $106 billion proposal that primarily consisted of funding for Ukraine and Israel. The Russian invasion of Ukraine has been in the news for almost two years, while the Israel–Hamas war began in October. Ninety-one percent of Californians have heard news about the escalating violence in Israel and Palestine (59% a lot, 32% a little). Californians are divided on the role the US should play in the conflict between Hamas and Israel and how much support the US should give Ukraine.
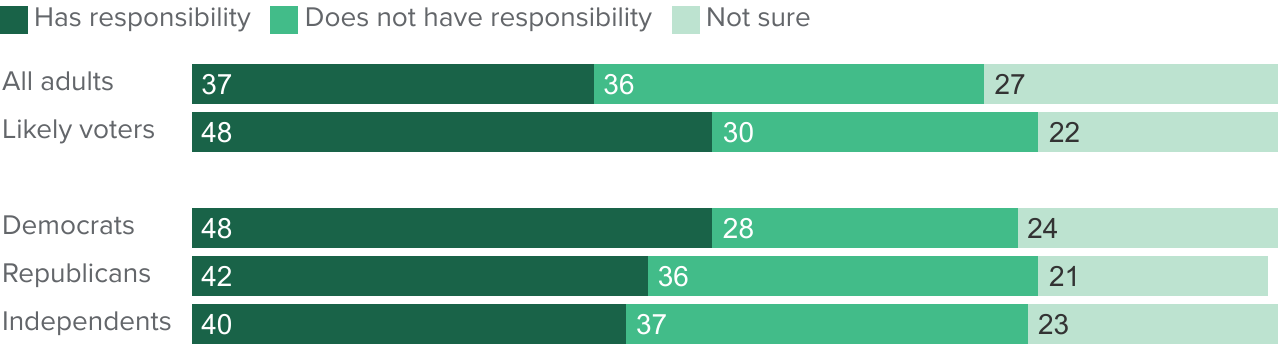
When asked about the role of the US in the fighting between Israeli forces and Hamas, nearly equal shares of Californians say the US does (37%) and does not (36%) have a responsibility; just over a quarter say they are not sure (27%). However, nearly half of likely voters (48%) say the US has a responsibility. Nearly half (48%) of Democrats say the US has responsibility, compared to slightly fewer Republicans (42%) and independents (40%). Views are similar across most regions, apart from the Inland Empire, where only a quarter (24%) say the US has a responsibility in the Israel-Hamas fighting. Across age groups, only 35 percent of those under age 55 say the US has this responsibility, compared to 44 percent of adults 55 and older. The shares who hold this view increase with educational attainment and income, and are somewhat higher among men (41%) than women (34%).
In a nationwide Economist/YouGov survey conducted in November this year, a similar share of Americans overall (38%) say the US has a responsibility in the fighting between Israel and Hamas (37% does not have a responsibility).
Californians are split on whether the US has a responsibility in the fighting between Israeli forces and Hamas
SOURCE: PPIC Statewide Survey, December 2023. Survey was fielded from November 9–16, 2023 (n=1,660 adults, n=1,113 likely voters).
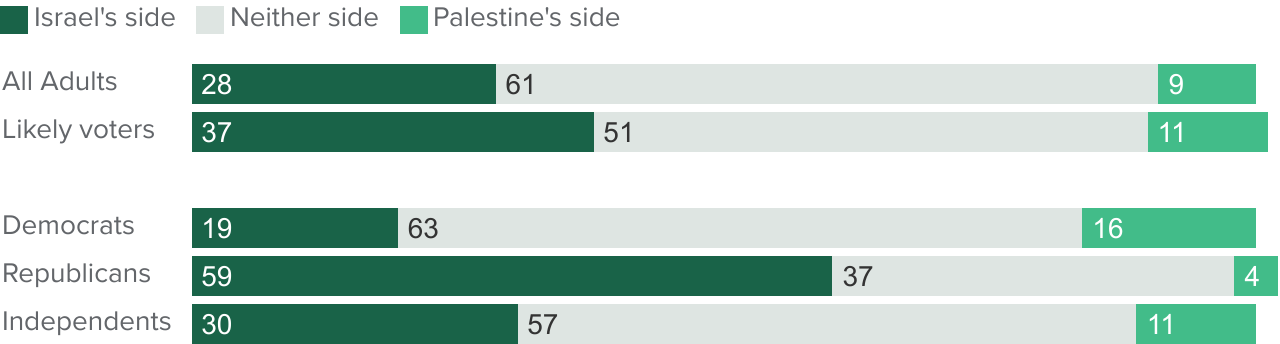
When asked about which side the US should take in the Israel–Palestine conflict, 61 percent of adults and 51 percent of likely voters say the US should not take a side. Twenty-eight percent of adults and 37 percent of likely voters say the US should take Israel’s side, while 9 percent of adults and 11 percent of likely voters say the US should take Palestine’s side. According to a national survey conducted in October by the Wall Street Journal/Ipsos, about half (52%) of Americans say the US should not take a side in this conflict. About six in ten California Republicans say the US should take Israel’s side, compared to three in ten independents and one in five Democrats. Solid majorities of both Democrats and independents say the US should not take a side in the Israeli-Palestinian conflict, compared to 37 percent of Republicans.
Majorities across demographic groups and regions say the US should not take a side in the Israel-Palestine conflict. Among Californians ages 18 to 34, 21 percent say the US should take Palestine’s side and 17 percent say the US should take Israel’s side. Among adults 55 and older, 40 percent say the US should take Israel’s side and 4 percent say the US should take Palestine’s side. Across racial/ethnic groups, Latinos (17%), Asian Americans (23%), and African Americans (29%) are less likely than whites (38%) to say the US should take Israel’s side.
A majority of Californians say the US should not take a side in the Israel-Palestine conflict
SOURCE: PPIC Statewide Survey, December 2023. Survey was fielded from November 9–16, 2023 (n=1,660 adults, n=1,113 likely voters).
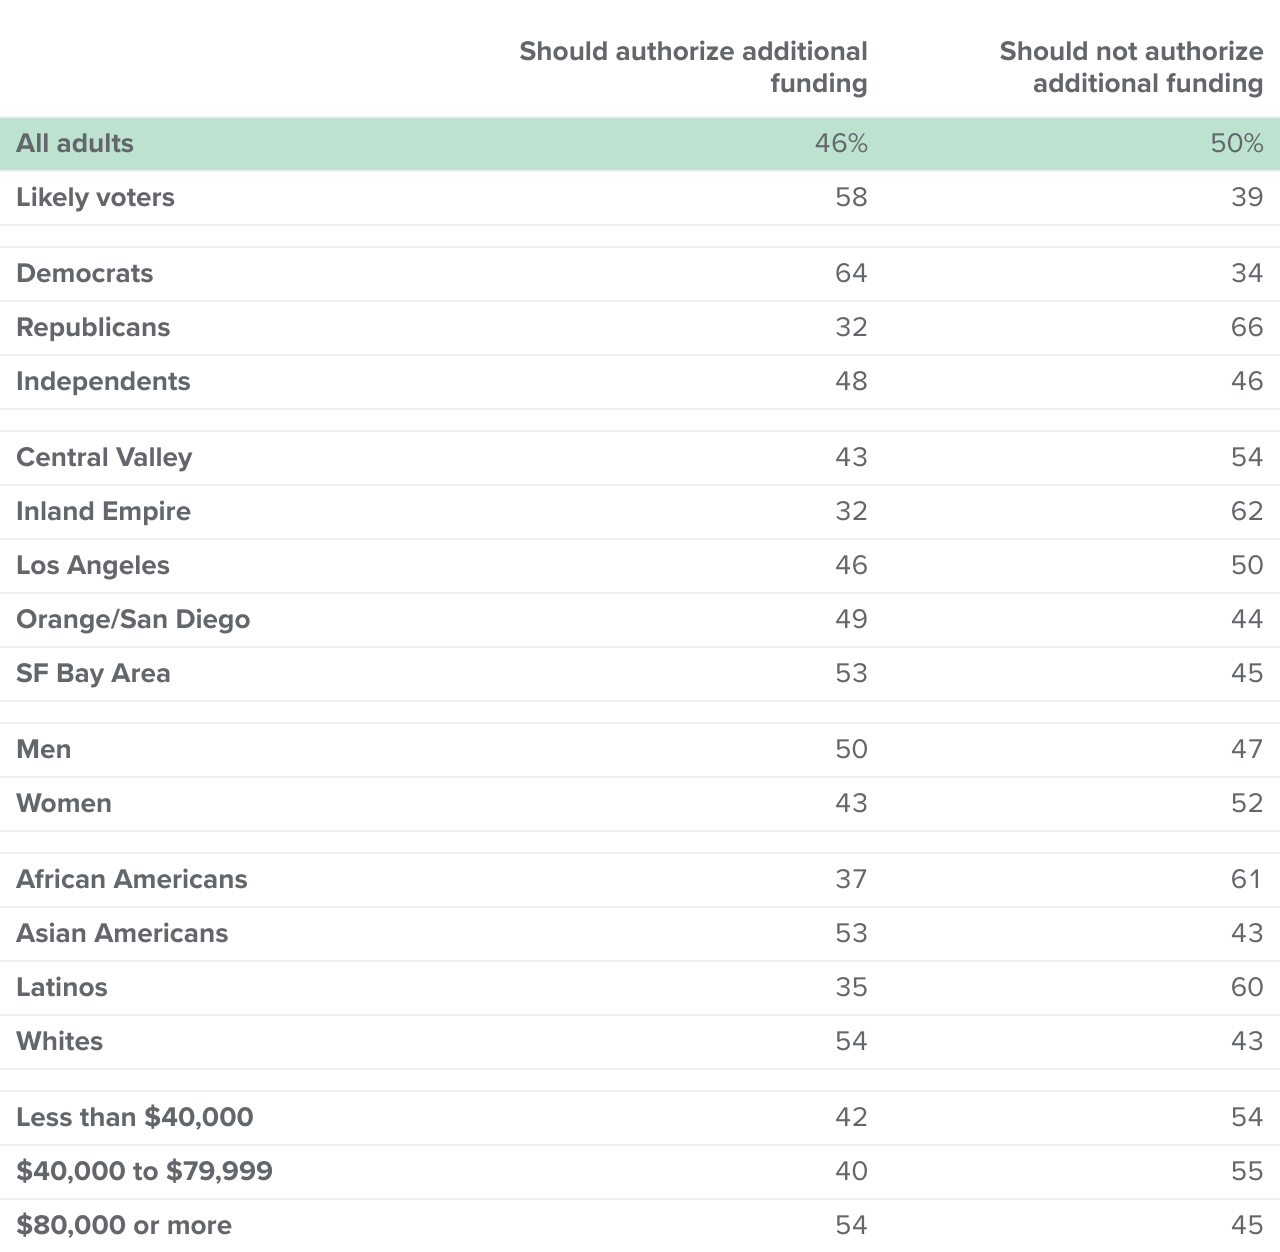
With the Russian invasion of Ukraine nearing the two-year mark, Californians are divided on whether Congress should authorize additional funding for Ukraine (50% should not, 46% should). A majority of likely voters lean toward authorizing additional funding (59% should, 39% should not). Partisans are divided: a solid majority of Democrats (64%) say Congress should authorize additional funding, compared to nearly half of independents (48%) and only a third of Republicans (32%).
Residents in the San Francisco Bay Area (53%) are much more likely to say Congress should authorize additional funding than residents in the Inland Empire (32%). Men (50%) are somewhat more likely than women (43%) to hold this view. Whites (54%) and Asian Americans (53%) are more likely than African Americans (37%) and Latinos (35%) to favor additional funding for Ukraine. The shares holding this view increase with increasing age, educational attainment, and income.
Half of Californians say the US should not authorize additional funding to Ukraine
SOURCE: PPIC Statewide Survey, December 2023. Survey was fielded from November 9–16, 2023 (n=1,660 adults, n=1,113 likely voters).
When respondents were asked to assess the amount of support the US has provided to Ukraine during the invasion by Russia, over a third of adults say it has been the right amount, about three in ten say it has been too much (29%), and 16 percent say there has not been enough support; one in five say they are not sure. Shares are similar among likely voters (41% about the right amount, 25% too much, 16% too little). The shares of Californians who say there has been too much support is up significantly from May 2022, when only 13 percent expressed that view.
Today, nearly half of Republicans say the US has given Ukraine too much support, while about two in ten Democrats and 32 percent of independents say the same. About a quarter of Democrats say the US has not given enough support to Ukraine. Residents in the Central Valley and the Inland Empire are more likely than residents elsewhere to say the US has provided too much support. Still, between 30 and 40 percent across all regions say the US has given Ukraine about the right amount of support.
Among racial/ethnic groups, white Californians are most likely to say the US has not given enough support to Ukraine, while Latinos and African Americans are most likely to say the country has given too much support. Across education levels, college graduates (22%) are more likely than less-educated adults to say the US has not given enough support (14% some college, 12% high school only). Adults under 55 (34%) are more likely than those over 55 (21%) to say there has been too much support.
Californians are divided about the amount of support the US has given Ukraine
% who say the US has provided ___ to Ukraine since it was invaded by Russia

SOURCE: PPIC Statewide Survey, December 2023. Survey was fielded from November 9–16, 2023 (n=1,660 adults, n=1,113 likely voters).
Federal Approval Ratings
October was a tumultuous month for the federal government, with the outbreak of war between Israel and Hamas and a three-week standstill in the House as Republicans struggled to elect a new Speaker. In the wake of this turmoil, Californians’ approval of the branches of the federal government has declined.
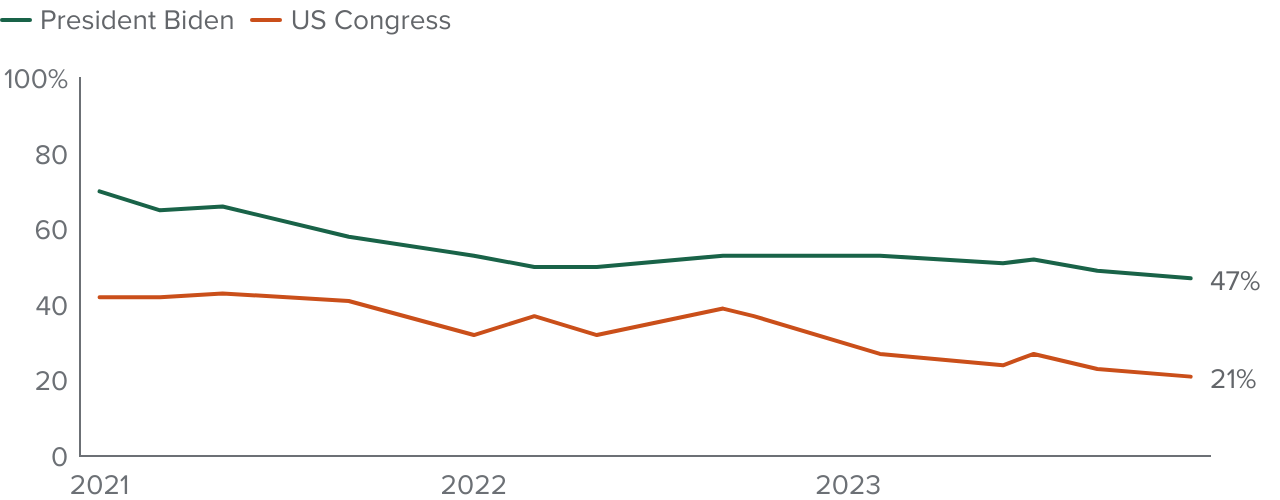
Less than half (47%) of Californians approve of Joe Biden’s handling of his job as president; a majority of likely voters approve (59%). Among all adults, this is his lowest approval rating since he took office in January 2021, when 70 percent of Californians expressed approval.
About one in five or fewer Californians (21% adults, 16% likely voters) approve of the job Congress is doing today. Approval of Congress was close to double last October (37% adults, 29% likely voters) just before the 2022 midterm elections, which shifted control of the House from the Democrats to the Republicans. Approval has declined from 27 percent in February, shortly after Republicans took control.
Less than half of Californians approve of Biden, and only about a fifth approve of Congress
% approve
SOURCE: PPIC Statewide Surveys, 2021–2023.
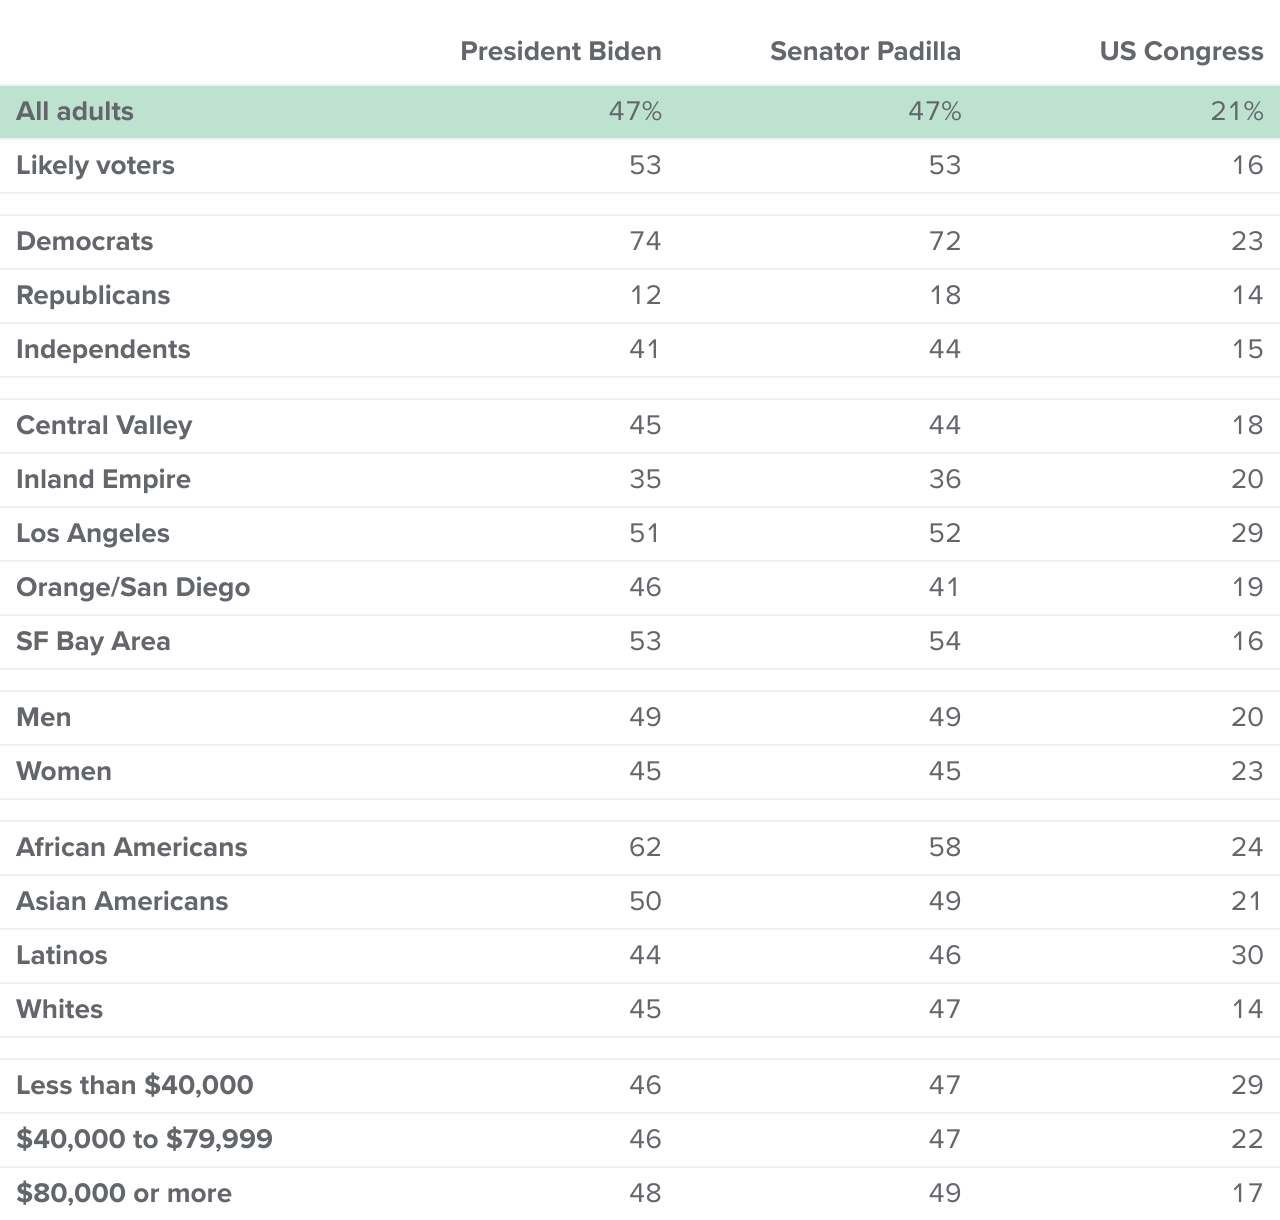
Partisans remain deeply divided on President Biden’s job performance: 74 percent of Democrats, 41 percent of independents, and 12 percent of Republicans approve. Approval is highest among African Americans (62%), compared to half of Asian Americans and less than half of whites (45%) and Latinos (44%). Majorities approve of Biden in the San Francisco Bay Area (53%) and Los Angeles (51%), while residents in the Inland Empire are the least likely to approve (35%). On the national level, 37 percent approve, and 59 percent disapprove of President Biden, according to a recent Gallup poll.
Californians are also divided on Alex Padilla’s handling of his job as a US senator (47% approve, 45% disapprove); a majority of likely voters approve (53%). Padilla’s approval has held steady since he became a US senator in 2021. Today, approval of Alex Padilla across parties and demographic groups is similar to that of President Biden’s. Democrats are far more likely than independents (44%) and Republicans (18%) to approve. A majority of African Americans (58%) approve of Padilla, compared to less than half of Asian Americans (48%), whites (47%), and Latinos (46%).
Approval of the US Congress is very low: 21 percent of adults and 16 percent of likely voters approve of the way Congress is handling its job (disapprove: 75% adults, 83% likely voters). Overwhelming majorities across partisan groups disapprove of Congress (75% Democrats, 82% independents, 84% Republicans). Strong majorities across demographic groups disapprove of Congress. Residents in Los Angeles (29%) are more likely than residents in other regions to approve, while Latinos (30%) are more likely than other racial/ethnic groups to approve. Approval of the US Congress is slighter higher in California than in the nation overall (15% approve, 82% disapprove), according to a recent Gallup poll.
Close to half approve of President Joe Biden and US Senator Alex Padilla, while about two in ten approve of the US Congress
% approval
SOURCE: PPIC Statewide Survey, December 2023. Survey was fielded from November 9–16, 2023 (n=1,660 adults, n=1,113 likely voters).
After the death of Diane Feinstein, Governor Newsom appointed Laphonza Butler to serve for the remainder of Feinstein’s Senate term. More than four in ten Californians (44% adults, 50% likely voters) have a favorable opinion of Butler. A strong majority of Democrats have a favorable opinion of Senator Butler, compared to about four in ten independents and only 16 percent of Republicans.
Across regions, about half in the San Francisco Bay Area (52%) and Los Angeles (48%) have a favorable opinion of Senator Butler, compared to four in ten or less in other regions. Asian Americans are more likely than any other racial/ethnic group to hold a favorable view. College graduates (56%) are much more likely than those with some college education (42%) or those with a high school education or less (36%) to have a favorable opinion of Senator Butler.
On October 25, Mike Johnson, a Republican from Louisiana, was elected Speaker of the House of Representatives after the chamber had gone the greater part of a month without a leader. About three in ten Californians hold a favorable view of Johnson (31% adults and likely voters). Two in three Republicans have a favorable opinion of Speaker Johnson, compared to about three in ten independents and one in six Democrats. One in three Latinos and whites view him favorably, while fewer African Americans (26%) and Asian Americans (25%) hold this view. Residents in the San Francisco Bay Area (24%) and college graduates (23%) are the least likely to have a positive view of Johnson.
Less than half hold a favorable opinion of Senator Laphonza Butler; about a third have a positive view of House Speaker Mike Johnson
% favorable opinion

SOURCE: PPIC Statewide Survey, December 2023. Survey was fielded from November 9–16, 2023 (n=1,660 adults, n=1,113 likely voters).
Topics
Political Landscape Statewide Survey