
Key Findings
California voters have received their mail ballots, and campaigns are making closing arguments ahead of the November 5 election. The national polls show a close race for president, while control of Congress is likely to be decided by slim margins in a few states. The Federal Reserve has cut interest rates amid signs of slowing inflation and continued employment growth. The California legislative session ended with the governor signing about 1,000 bills into law. Californians will also have a role as policy deciders with 10 state propositions on the November ballot, including two $10 billion state bonds, three legislative amendments to the state constitution, and five citizens’ initiatives.
These are the key findings of the Californians and Their Government survey on state and national issues, conducted October 7–October 15, 2024:
- Kamala Harris and Tim Walz (D) lead Donald Trump and J.D. Vance (R) by a wide margin (59% to 33%) in the presidential race; 58 percent of California likely voters are “extremely” or “very” enthusiastic about voting for president this year. Adam Schiff (D) leads Steve Garvey (R) by a wide margin (63% to 37%) in the US Senate race; 60 percent say that they are satisfied with the choice of candidates. Democratic candidates lead Republican candidates in local House district races by a wide margin (61% to 38%); 30 percent are “extremely” or “very” enthusiastic about voting for Congress this year. Overwhelming majorities say that voting in the 2024 election is very important and that they are closely following presidential election news. About one in three think that voters are not receiving enough information to decide how to vote on citizens’ initiatives.
 Proposition 36 (increasing crime sentences) continues to lead in both support and interest among the 10 state propositions. Seventy-three percent say they would vote “yes” on Proposition 36 if the election were held today, and 28 percent say they are most interested in this state proposition. Six in ten or more say they would vote yes on Proposition 3 (right to marriage), Proposition 4 (climate bond), and Proposition 35 (Medi-Cal funding). A majority would vote yes on Proposition 2 (education bonds). Support is below the majority vote threshold needed to pass for Proposition 5 (55% to pass local bonds), Proposition 6 (eliminating involuntary servitude for incarcerated persons), Proposition 32 (higher minimum wage), Proposition 33 (expanding local rent controls), and Proposition 34 (restricting spending on prescription drug revenues).
- Most Californians mentioned economic conditions, housing costs, and homelessness when asked to name the most important issue facing people in California today. Solid majorities of adults and likely voters think that the state is generally going in the wrong direction and expect the state to have bad times financially in the next 12 months, with partisans divided in these assessments. Forty-four percent of adults and 47 percent of likely voters approve of the job performance of Governor Newsom, while similar proportions say that they approve of the job performance of the California Legislature. Sixty-three percent of likely voters say they have a great deal or quite a lot of confidence in the system in which votes are cast and counted in California.
 Most Californians choose economic conditions, political extremism and threat to democracy, and immigration when asked to name the most important problem facing the US today. Solid majorities of adults and likely voters think the nation is generally going in the wrong direction and expect bad times financially over the next 12 months, with differing perceptions from partisans. Forty-six percent of adults and 52 percent of likely voters approve of President Biden’s job performance, and overwhelming majorities disapprove of the job performance of the US Congress. Among likely voters, 73 percent are very confident or somewhat confident that the votes for president across the county will be accurately cast and counted in this year’s election.
 Most Californians choose economic conditions, political extremism and threat to democracy, and immigration when asked to name the most important problem facing the US today. Solid majorities of adults and likely voters think the nation is generally going in the wrong direction and expect bad times financially over the next 12 months, with differing perceptions from partisans. Forty-six percent of adults and 52 percent of likely voters approve of President Biden’s job performance, and overwhelming majorities disapprove of the job performance of the US Congress. Among likely voters, 73 percent are very confident or somewhat confident that the votes for president across the county will be accurately cast and counted in this year’s election.
November Election
California voters are being inundated with television commercials, social media posts, and mailers as campaigns move into high gear in the final days before the November election. The state election ballot includes the presidential race, a US Senate race, and 10 state propositions. California voters will also be electing 52 House members, and several competitive House races may help to decide the party in control of a closely divided Congress. Eighty-nine percent of likely voters say that voting in elections in 2024 is very important (9% somewhat, 2% not too important).
US presidential race. The major news events since Labor Day in the top-of-the-ticket race included the presidential debate on September 10th and the vice presidential debate on October 1st. While national polls indicate a close race, California likely voters would choose Kamala Harris and Tim Walz (D) over Donald Trump and J.D. Vance (R) by a wide margin (59% to 33%) if the November election were held today. Preferences were similar in September (60% Biden, 29% Trump) and are aligned with the 2020 presidential election outcome in California (63.5% Biden, 34.3% Trump).
Partisans continue to overwhelmingly prefer their party’s candidate, similar to the trend that we noted before the presidential and vice presidential debates. Today, 90 percent of Democrats support Harris and 83 percent of Republicans favor Trump, while independents are leaning Democratic (50% Harris, 34% Trump). Harris leads Trump across age, education, gender, income, and racial/ethnic groups and across the state’s major regions. Notably, there is a gender gap in preferences (women: 63% Harris, 30% Trump; men: 54% Harris, 37% Trump). Fifteen percent of independents would vote for someone else, including 7 percent choosing to cast their ballots for the American Independent ticket of Robert F. Kennedy Jr. and Nicole Shanahan. Few are undecided about the presidential race.
A trend surfaced in our October survey that predicts high voter turnout in the November election: 58 percent are “extremely” or “very” enthusiastic about voting for president this year (compared to 39% in April and 37% in February). Moreover, 84 percent are “very” or “fairly” closely following news about candidates for the 2024 presidential election. Harris supporters (62%) and Trump supporters (60%) are similarly likely to say they are extremely or very enthusiastic about voting for president—and both are equally as likely to say they are very or fairly closely following news about candidates in the 2024 presidential election (85% Harris voters; 85% Trump voters).
Six in ten California likely voters support the Democratic presidential ticket

SOURCE: PPIC Statewide Survey, October 2024. Survey was fielded October 7–15, 2024 (n=1,646 adults, n=1,137 likely voters).
NOTES: Among likely voters only. *Other candidates includes the “someone else (specify)” response option and any candidates below the top two. All Certified Presidential candidates on the California general election ballot were included in the question.
US Senate race. Adam Schiff (D) continues to lead Steve Garvey (R) by a wide margin (63% to 37%) in the US Senate race. Most Democrats favor Schiff (93%) while most Republicans favor Garvey (92%)—and independents lean toward the Democrat (61% Schiff, 38% Garvey). Majorities across demographic groups and the major regions of the state favor Schiff over Garvey. There is a gender gap in Senate candidate preferences (women: 68% Schiff, 31% Garvey; men: 58% Schiff, 41% Garvey). The overall margin of support in the US Senate race was similar in September (63% Schiff, 35% Garvey)—indicating that the October 8 debate between the two candidates had little impact.
Sixty percent of likely voters are satisfied with their choices in the US Senate race (similar to 59% in September and 62% in April). Today, Democrats (72%) are much more likely than Republicans (58%) and Schiff’s supporters (67%) are much more likely than Garvey’s supporters (49%) to say they are satisfied with the candidate choices in the Senate election.
A solid majority of California likely voters would vote for Adam Schiff if the Senate election were held today

SOURCE: PPIC Statewide Survey, October 2024. Survey was fielded October 7–15, 2024 (n=1,646 adults, n=1,137 likely voters).
NOTES: Among likely voters only.
US House races. Most likely voters choose their local Democratic candidate over the local Republican candidate by a wide margin (61% to 38%) when asked about their preference in the US House race; preferences were similar in September (62% Democrat, 36% Republican). Today, over nine in ten Democratic and Republican likely voters would choose their party’s candidate, while independents are more divided (54% Democrat, 43% Republican). Majorities favor the Democratic candidate over the Republican in House races across demographic groups and regions, and there is a gender gap in preferences (women: 64% Democrat, 33% Republican; men: 58% Democrat, 42% Republican). In the 10 competitive districts (as defined by the Cook Political Report), support is about evenly divided for the Democratic candidate and the Republican candidate (50% to 48%).
Thirty percent of likely voters are extremely or very enthusiastic about voting for Congress this year (compared to a similar 30% in June and 30% in April). Today, in the competitive House races, 37 percent are extremely or very enthusiastic about voting for Congress this year. Democrats (38%) more often than Republicans (29%), and Democratic candidate supporters (34%) more often than Republican candidate supporters (27%), are enthusiastic about voting for Congress this year.
State ballot initiatives. Likely voters also shared their perceptions about the information sources that are available to California voters on state ballot initiatives (Note: interest and support for the 10 state propositions on the November ballot are summarized in the next section). Fifty-one percent think that the voter information guide mailed to voters by the Secretary of State is “very useful” to them in deciding how to vote on citizens’ initiatives that appear on the state ballot as propositions (41% somewhat, 8% not too useful). In stark contrast, 9 percent think that political advertisements paid for by the initiative campaigns are “very useful” to them in deciding how to vote on citizens’ initiatives (34% somewhat useful, 57% not too useful). Overall, about one in three (35%) think that voters are receiving “not enough” information to decide how to vote on citizens’ initiatives (21% more than enough, 44% just enough). Partisan views vary on the usefulness of the voter information guide, while they have similar views about the usefulness of political advertisements and the amount of information that voters are receiving.
Six in ten California likely voters would vote for the Democratic candidate if the 2024 election for the House of Representatives were held today

SOURCE: PPIC Statewide Survey, October 2024. Survey was fielded October 7–15, 2024 (n=1,646 adults, n=1,137 likely voters).
NOTES: Among likely voters only.
State Propositions
With five citizens’ initiatives, two state bonds, and three legislative constitutional amendments on the November 5 state ballot, we asked likely voters which one they are most interested in. About three in ten (28%) say they are most interested in Proposition 36 (Allows Felony Charges and Increases Sentences for Certain Drug and Theft Crimes) and about one in six (17%) say they are most interested in Proposition 33 (Expands Local Governments’ Authority to Enact Rent Control on Residential Property), while each of the other state propositions had fewer mentions.
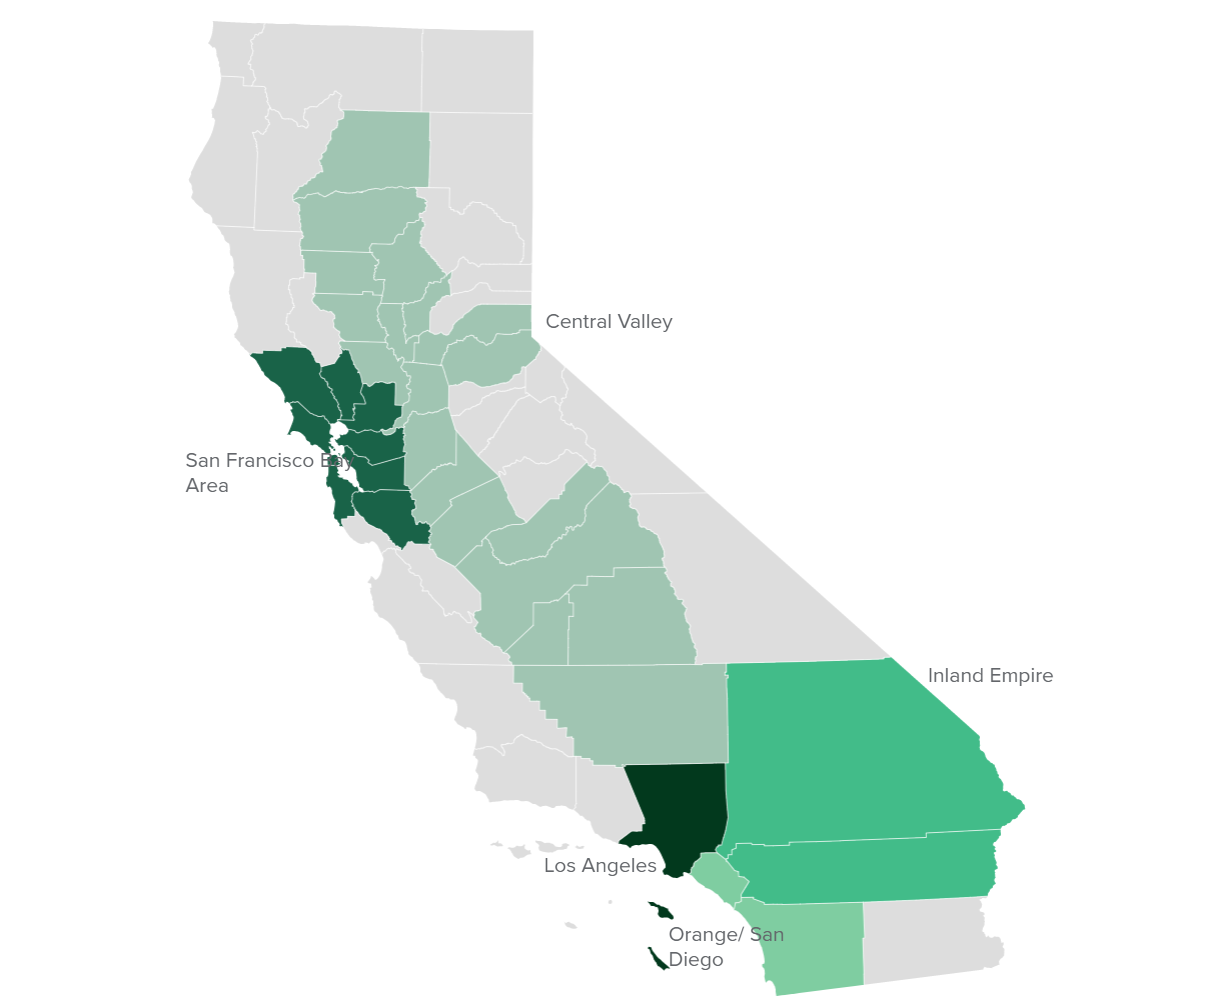
Proposition 36 would allow felony charges for possessing certain drugs and for theft under $950, if the defendant has two prior drug or theft convictions. After reading the Proposition 36 ballot title and summary, 73 percent of likely voters say they would vote yes, while 25 percent would vote no. In September, findings were nearly identical (71% yes, 26% no). Today, as there was last month, there is broad—and bipartisan—support for Proposition 36. Regionally, support is highest in the Inland Empire (80%) and lowest in Los Angeles (70%, 71% Orange/San Diego, 73% Central Valley, 73% San Francisco Bay Area). Two in three or more across demographic groups would vote yes on Proposition 36.
An overwhelming majority would vote yes on Proposition 36, which would allow felony charges and increased sentences for some drug and theft crimes

SOURCE: PPIC Statewide Survey, October 2024. Survey was fielded October 7–15, 2024 (n=1,646 adults, n=1,137 likely voters).
NOTES: Likely voters only.
Proposition 33 would expand local government’s ability to enact rent control. After reading the Proposition 33 ballot title and summary, 42 percent of likely voters say they would vote yes, while 54 percent would vote no. The share of support is down slightly from 51 percent last month. A majority of Democrats would vote yes compared to four in ten independents and two in ten Republicans. Across regions, support is highest in the Inland Empire (50%) followed by Los Angeles (45%), the San Francisco Bay Area (43%), Orange/San Diego (39%), and the Central Valley (37%). Across demographic groups, support reaches 50 percent only among Latino likely voters (50%), those with incomes less than $40,000 (58%), and renters (60%).
There is majority opposition to Proposition 33, which would expand local government's authority to enact rent control

SOURCE: PPIC Statewide Survey, October 2024. Survey was fielded October 7–15, 2024 (n=1,646 adults, n=1,137 likely voters).
NOTES: Likely voters only.
The state legislature also placed two $10 billion bonds on the November ballot, and both receive majority support at this time. Proposition 2 would authorize $10 billion in bonds for repairs, upgrades, and constuction of facilities at public K–12 schools. After reading the ballot title and summary, 52 percent of likely voters say they would vote yes on Proposition 2 (Authorizes Bonds for Public School and Community College Facilities); 46 percent would vote no. Findings were similar in September (54% yes, 44% no). Today, seven in ten Democrats would vote yes compared to half of independents and just one in five Republicans. Across regions, support ranges from 65 percent in the Inland Empire to 46 percent in Orange/San Diego (47% Central Valley, 54% Los Angeles, 60% San Francisco Bay Area). Support is higher among younger, more educated, and less affluent likely voters.
The second bond measure—Proposition 4 (Authorizes Bonds for Safe Drinking Water, Wildfire Prevention, and Protecting Communities and Natural Lands from Climate Risks)—receives more support. Proposition 4 authorizes $10 billion in bonds for water, wildfire prevention, and protection of land. After reading the ballot title and summary, 60 percent of likely voters would vote yes (38% no). Support was slightly higher in September (65% yes, 33% no). Today, partisans are deeply divided, with 81 percent of Democrats and 58 percent of independents in support, compared to 27 percent of Republicans. Across regions and demographic groups, majorities of likely voters would vote yes, although support is highest in the San Francisco Bay Area (71%) and among Latinos (68%), college graduates (66%), those age 18 to 44 (72%), and renters (74%).
We also gauged support for the six other state propositions that will be on the November ballot:
- Proposition 3 (Constitutional Right to Marriage). A strong majority of likely voters would vote yes (67%) on this legislative constitutional amendment, while three in ten would vote no (32%). Findings were nearly identical in September (68% yes, 31% no).
- Proposition 5 (Allows Local Bonds for Affordable Housing and Public Infrastructure with 55% Voter Approval). Likely voters are divided on this legislative constitutional amendment, with 48 percent saying they would vote yes and 50 percent saying they would vote no. In September, support was similar (49% yes, 50% no).
- Proposition 6 (Eliminates Constitutional Provision Allowing Involuntary Servitude for Incarcerated Persons). Likely voters are slightly more likely to say they would vote no (56%) than yes (41%) on this legislative constitutional amendment. Support for this measure has declined slightly since September (46% yes, 50% no).
- Proposition 32 (Raises Minimum Wage). Likely voters are divided on this citizens’ initiative, with 44 percent saying they would vote yes and 54 percent saying they would vote no. In September, support was slightly higher (50% yes, 49% no).
- Proposition 34 (Restricts Spending of Prescription Drug Revenues by Certain Health Care Providers). Likely voters are divided on this citizens’ initiative, with 47 percent saying they would vote yes and 49 percent saying they would vote no. Support for this measure was slightly higher in September (53% yes, 43% no).
- Proposition 35 (Provides Permanent Funding for Medi-Cal Health Care Services). A solid majority of likely voters would vote yes (62%) on this citizens’ initiative, while one in three would vote no (36%). Findings were nearly identical in September (63% yes, 34% no).
There is majority support for Propositions 2 and 4, which would issue $10 billion bonds for school facilities and climate resiliency
% voting yes

SOURCE: PPIC Statewide Survey, October 2024. Survey was fielded October 7–15, 2024 (n=1,646 adults, n=1,137 likely voters).
NOTES: Among likely voters only.
State of the State
The economy, including the cost of living and jobs, is the most named issue when Californians are asked about the most important issues facing the state (35%), and this has been the case since May 2022. Notably, the economy is the top issue across parties, regions, and demographic groups. About one in five Californians (18%) name housing costs and availability as the top issue, followed by about one in ten who say it is homelessness (12%). Smaller shares mention crime (7%), the environment (5%), and immigration (5%).
When asked about the direction of the state, Californians are more likely to be pessimistic than optimistic (60% wrong direction, 38% right direction). This has been the case since June 2023. Today, likely voters have similar views. Residents in the Central Valley (30%) are the least optimistic and those in the San Francisco Bay Area (47%) are the most optimistic. There is a wide partisan divide: six in ten Democrats (60%) are optimistic about the direction of the state, compared to about three in ten independents (31%) and 6 percent of Republicans. Across demographic groups, majorities express pessimism, but optimism is highest among African Americans (47%) and college graduates (47%).
A majority of Californians continue to say the state is going in the wrong direction

SOURCES: PPIC Statewide Surveys 1998–2024.
Californians are also pessimistic when looking forward to the economic conditions of the state over the next year. About six in ten adults (62%) and likely voters (58%) expect bad financial times, while four in ten or less expect good times (35% adults, 40% likely voters). A majority of Democrats (54%) expect good times, while two-thirds of independents (68%) and more than eight in ten Republicans (84%) expect bad times. Across regions, majorities expect bad times, but residents in the Central Valley and Orange/San Diego are the most pessimistic (68% each, bad times). The optimistic view reaches a majority only among African Americans (52%), while the pessimistic view is close to six in ten or more across all other demographic groups.
Most Californians expect bad economic times in the next year

SOURCES: PPIC Statewide Surveys 1999–2024.
Regarding elections in California, a majority have a great deal (32%) or quite a lot (21%) of confidence in the system in which votes are cast and counted in the state. More than six in ten likely voters say the same (43% great deal, 20% quite a lot). An additional quarter of California adults have some confidence, while about two in ten have very little. Nearly eight in ten Democrats (79%) have a great deal or some confidence, a share much higher than independents (52%) or Republicans (27%).
A majority of Californians are not too (27%) or not at all concerned (29%) that it is too easy for ineligible people to vote in California elections, while more than four in ten are somewhat (22%) or very (20%) concerned. An overwhelming majority of Republicans are concerned about this (57% very concerned, 28% somewhat concerned), while most independents (32% not too concerned, 27% not at all concerned) and Democrats (35% not too concerned, 42% not at all concerned) are not concerned. Most Californians are not too (35%) or not at all concerned (33%) that it is too hard for eligible people to vote in Californian elections. Strong majorities across parties, regions, and demographic groups are not concerned about this.
Over half of adults (53%) and likely voters (52%) disapprove of the way Gavin Newsom is handling his job as governor, while fewer approve (44% adults and 47% likely voters). The share of both groups disapproving of the governor has been at about half or more for all of 2024. Seven in ten Democrats approve, while about nine in ten Republicans disapprove; independents are much more likely to disapprove than approve (56% to 38%). Across regions, about half in Los Angeles and the San Francisco Bay Area approve, while majorities in the Central Valley, Inland Empire, and Orange/San Diego disapprove. Majorities across demographic groups disapprove—with the exception of African Americans (32%) and college graduates (46%).
Majorities of adults (56%) and likely voters (55%) disapprove of the job the state legislature is doing. Nearly all Republicans (92%) and six in ten independents disapprove, while a solid majority of Democrats (62%) approve. Residents in Los Angeles (50% approve, 48% disapprove) and the San Francisco Bay Area (49% approve, 49% disapprove) are more split in their opinions, while six in ten or more in the Central Valley (61%), Orange/San Diego (62%), and the Inland Empire (64%) disapprove.
California adults feel similarly toward the legislators representing their own assembly and senate districts (42% approve, 54% disapprove). Likely voters are more split in their opinion (47% approve, 51% disapprove). Across regions, majorities disapprove of their legislators, except for San Francisco Bay Area residents (50% approve). Less than half across demographic groups approve, except for college graduates (52% approve).
Less than half of Californians approve of their state elected officials
% approving of . . .

SOURCE: PPIC Statewide Survey, October 2024. Survey was fielded October 7–15, 2024 (n=1,646 adults, n=1,137 likely voters).
State of the Nation
With the November 5 election quickly approaching, most across the state continue to say the US is headed in the wrong direction. About seven in ten adults and likely voters (69% each) say this, while about three in ten say right direction (29% adults, 30% likely voters). A majority have said the US is headed in the wrong direction since June 2023. Today, majorities across partisan, demographic, and regional groups say the country is headed in the wrong direction.
Most adults continue to say the US is headed in the wrong direction

SOURCE: PPIC Statewide Surveys, 2003–2024.
Asked to choose from a list of what they think is the most important problem facing the US today, about a quarter of adults say it is the economy, unemployment, and jobs (26%). Fewer than two in ten say it is political extremism or threats to democracy (18%) or immigration (15%). Less than one in ten say it is the health care system (7%), crime or corruption (7%), or the environment and climate (7%). The top three issues likely voters chose were political extremism or threats to democracy (25%); economy, unemployment, and jobs (19%); and immigration (18%). About four in ten Republicans say immigration is the most important problem (39%), while Democrats are most likely to say it is political extremism or threats to democracy (29%); independents are about equally as likely to say it is the economy, unemployment, and jobs (22%) or that it is political extremism or threats to democracy (20%).
While most adults identify the economy as the most important problem facing the US, six in ten (60%, 53% likely voters) say they expect bad economic times in the next 12 months (good times: 37% adults, 44% likely voters). Most have expected bad financial times since February 2022. Today, a majority of Democrats (55%) expect good financial times, while over six in ten independents (63%) and about three in four Republicans (77%) expect bad times ahead. Majorities across demographic and regional groups expect bad times ahead, with an exception among African Americans, who are more divided (48% good times, 49% bad times).
A solid majority expect bad economic times in the next year, though this share is declining

SOURCE: PPIC Statewide Surveys, 2003–2024.
A majority of adults and likely voters are not too (37% adults, 35% likely voters) or not at all satisfied (18% adults, 19% likely voters) with the way democracy is working in the US. Fewer than half say they are very (5% adults, 7% likely voters) or somewhat satisfied (38% adults, 39% likely voters). Last September, majorities of adults (56%) and likely voters (58%) said they were not too or not at all satisfied. Since February 2022, the first time PPIC asked this question, majorities of likely voters have expressed dissatisfaction with democracy. Californians overall are less likely than adults nationwide to say they are not satisfied, according to a Pew Research Center international poll conducted in April (US adults: 44% not too, 25% not at all satisfied).
While Californians are not satisfied with the way democracy is working in the country, most are confident that their vote for US president this year will be accurately cast and counted. Sixty-five percent of adults (28% very, 37% somewhat) and more likely voters (38% very, 35% somewhat) are at least somewhat confident; roughly one in three or fewer adults and likely voters are not too (22% adults, 16% likely voters) or not at all confident (12% adults, 11% likely voters). Over eight in ten Democrats and about two in three independents are at least somewhat confident; a majority of Republicans are not too or not at all confident.
Fewer than half of adults approve of the job Joe Biden is doing as president (46%), while a slim majority disapprove (52%). A slim majority of likely voters approve. Approval ratings among adults have remained at half or below since July 2023. Overall, Californians are slightly more likely than adults nationwide (39%) to approve of Biden, according to an October Gallup poll.
About two in ten or more adults and likely voters approve of the way US Congress is handling its job; overwhelming majorities disapprove. The share who approve has not breached 30 percent among adults since October 2022. Californians overall are somewhat more likely than adults nationwide (16%) to approve of Congress, according to the Gallup poll.
When it comes to the way their own representative for the US House of Representatives is handling their job, four in ten or more adults and likely voters approve, while majorities disapprove. Shares are similar to June 2024; however, a majority of adults have not expressed approval since September 2022.
Fewer than half approve of Biden, US Congress, and their own US House representative
% approving of . . .

SOURCE: PPIC Statewide Survey, October 2024. Survey was fielded October 7–15, 2024 (n=1,646 adults, n=1,137 likely voters).

Topics
Political Landscape Statewide SurveyLearn More

Californians’ Changing Views of Their Governor

Commentary: California’s Direct Democracy and Its Policy Outcomes

Five Fast Facts on California Voters
Majorities of Californians Express Confidence in State and Nationwide Elections
Video: Californians and Their Government
