

Key Takeaways
Widespread concerns over the economic prospects for young Californians are fueled by shifting opportunities, the lasting effects of the pandemic, economic uncertainty, and the rise of AI technology. Faced with an aging population, rising out-migration, and falling immigration, California policymakers have moved to engage California youth and improve their pathways to the workforce and career. Effective policy efforts, however, depend on understanding who is at risk, how outcomes have evolved, and what may be driving trends.
In this report, we provide new context on how young Californians are progressing along key milestones—primarily work and education—and how these patterns have changed over time. Several key facts and policy implications emerge, including:
- Young adults now stay in school longer and attain higher levels of education. Over one-third of today’s 24-year-olds born in the late 1990s have completed a bachelor’s degree or higher, compared to less than a quarter of Californians born in the late 1980s.→
- Entry into the labor market, and into full-time work, occurs later. Fewer teenagers are working overall, including fewer working while in school. But by age 24, about the same share of young adults across recent generations are in the labor force.→
- Lower shares of young adults are not working or in school. Roughly 17 percent of Californians born in the late 1990s were not in school or working at age 24 compared to 22 percent of those born a decade earlier. A lower share of young women than men in recent cohorts are not in school or working, a gender difference that has flipped over time. Shares are also higher among Latino and Black young adults.→
- Most who are not in school or working return to education and/or the labor market within a year. Being out of school and work is transitory for most. However, about 6 percent of young men and 2 percent of young women aged 20–24 in California remain out of work and school in consecutive years.→
- Economic conditions and demographic shifts explain most improvements. The demographics of recent generations of young adults differ from earlier generations, and many entered the labor market during periods of strong economic growth in the 2010s and from 2021–2023. These factors can account for most of the improvements in educational and economic outcomes across cohorts.→
- Young adults are hitting notable “milestones” later in life. Recent generations live with their parents into their 20s at higher rates and marry and have children at lower rates at all ages than earlier generations. These shifts are not fully explained by demographics and economic conditions.→
Introduction
The events of early adulthood can shape a person’s economic opportunities and outcomes; decisions over courses to take in high school, whether to pursue college or work, and whether to start a family lay the foundation for economic outcomes that persist much later in life. At each of these key milestones and decision points, broad economic forces also shape opportunities. Understanding these transition points has been a longstanding policy and research focus.
The growth of California’s workforce also depends on young adults starting their careers, especially given broader demographic trends. An aging population, rising out-migration, and shifting immigration patterns may alter California’s labor force and economy. While policymakers have long considered ways to better engage youth to improve their economic success, youth-focused workforce efforts could also bolster the state’s economy as labor force participation rates wane due to an aging population (Lafortune et al. 2024). Furthermore, as young adults delay milestones such as moving out of their parents’ home, seeking employment, getting married, and/or having children, California’s demographics and economy may shift. Understanding and documenting these trends is necessary to effectively address these issues.
Concerns over the economic conditions and outcomes among young adults are widespread today. Many factors heighten these concerns, including a rise in youth unemployment (Bohn, Cuellar Mejia, and Lafortune 2025), limited entry-level jobs for young graduates (Scheid 2025), the downsides of entering the labor market during business cycle slumps (Schwandt and von Wachter 2019), and the potential impact of AI in the workplace (Kinder et al. 2024). Longstanding divides by race, class, and region in these outcomes are well-documented (Bohn et al. 2020), as are gender gaps driven in part by declining economic outcomes among men (Bengali et al. 2025; Binder and Bound 2019).
At the same time, more young Californians are achieving higher levels of education (Rodriguez et al. 2024) and a higher share are in school and/or working than in past decades (Payares-Montoya 2024). Nevertheless, concern arises over young adults who are out of work and school in pivotal early adult years, as both build key human capital that correlates with long-term economic security (MaCurdy et al. 2024; Reeves and Smith 2024). While these young adults are a small share—roughly 11 percent of 16- to 24-year-olds in California—they amount to nearly half a million young adults. Efforts to improve opportunities for young adults may lead to increased labor force participation, benefiting individuals as well as the aggregate workforce.
In this report, we examine trends in educational and economic outcomes among young adults in California, exploring how different recent generations (defined by their year of birth) fare as they age and reach key milestones to adulthood.
Recent Economic Trends among Young Adults
A large share of Californians are concerned about the current and future economic prospects of today’s young adults (Baldassare et al. 2024). Examining recent economic trends confirms some signs of worry, particularly in the post-pandemic era.
Unemployment rates in California have been climbing steadily after an initial post-COVID drop (Figure 1). Most recently, over 9 percent of the state’s 16- to 30-year-olds were unemployed compared to 6.6 percent in 2022. Across all young adult age groups, unemployment rates remain higher today than in 2019. However, a look at trends since 2000 reveals periods of more dire unemployment circumstances than today that coincide with macroeconomic shocks like the Great Recession and COVID, reflecting broader economic conditions affecting not just young adults.

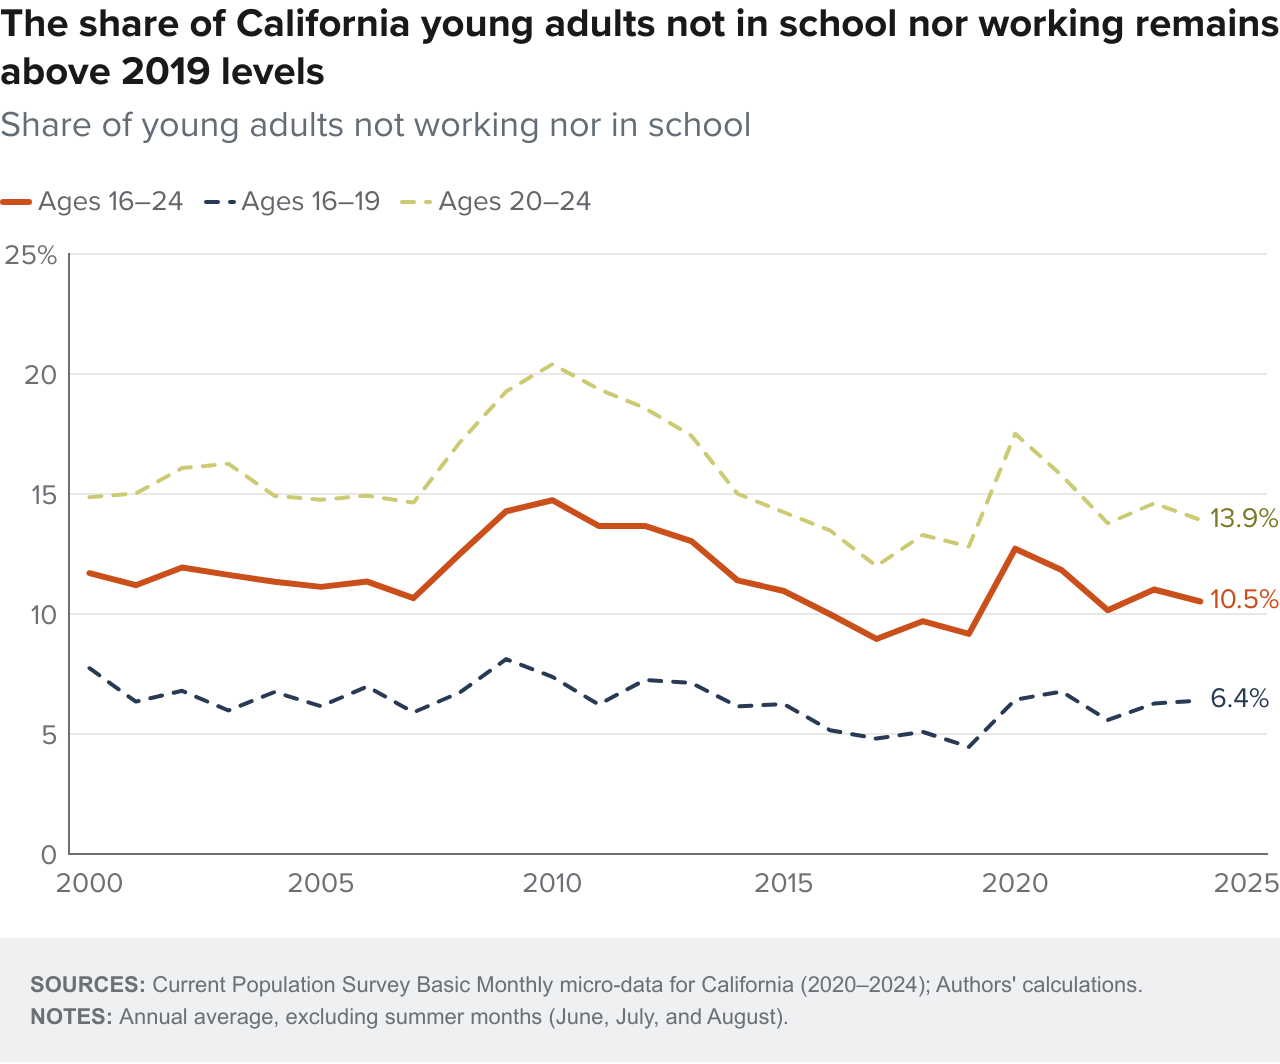
Examining the share of young adults who are not working (either unemployed or dropped out of the labor force) and simultaneously not in school helps us better understand a more significant case of disconnection. As with unemployment, the share has dropped since its COVID spike and remains below early 2000s levels but above those of 2019 (Figure 2). In 2024, over 10 percent of 16- to 24-year-olds in California were not in school nor working—about a percentage point higher than in 2019; the share of 20- to 24-year-old Californians in this situation is higher (13.9%) than that of 16- to 19-year-olds (6.4%), who are more likely to still be in school.
Academic outcomes among recent high schoolers are also raising concern, in light of falling test scores after the pandemic (Hough and Chavez 2022). Examining 11th grade test scores reveals a concerning trend that predates the pandemic; the lowest-scoring students in both math and English Language Arts (ELA) now score far below their levels a decade ago. Meanwhile, the highest-scoring students have continued to see growth (Technical Appendix Figures C2 and C3). The widening gap brings further concern over future outcomes for today’s young adults.
Education and Work Milestones
Recent trends in key labor market indicators show rising unemployment—but also greater connection to work and/or school among more recent young adults. To better understand these trends we examine whether trajectories for young adults are shifting over time.
We focus on several outcomes:
- Educational attainment. We separate into categories based on degree attainment and participation in postsecondary education: no high school diploma, high school diploma (but no further education), some college (but no degree), associate degree, and a bachelor’s degree or higher.
- Employment. Employed part time or full time.
- Labor force participation. Employed or unemployed but available and searching for work.
- Neither in school nor work. Those who are not in school and not employed. These young adults are sometimes referred to as “disconnected youth,” “opportunity youth,” or “NEET” (not in employment, education, or training). While useful, these coarse classifications do not capture the full range of young adult circumstances and/or milestones (e.g., living at home, caring for a young child). Later, we explore a wider range of circumstances.
Individuals may gain education and change their employment circumstances at any point throughout life. However, the vast majority earn credentials and launch their careers by age 30 or earlier. Indeed, as family and other household responsibilities grow with age, investing time and resources in education or in switching careers can become more difficult. For this reason, we focus on education and employment milestones among Californians from ages 16 to 30, inclusive.
Demographic and Migration Patterns Are Shifting
Decisions over whether and when to come to (or leave) California affect the composition of young adults in California at any given point. This may affect how we interpret differences across cohorts and/or other demographic groups over time. For example, recent cohorts may appear to have better outcomes than earlier cohorts if, on average, those with worse economic outcomes leave California or those with better outcomes move to California. Shifts in immigration and internal migration over our period of study are substantial. College-going patterns also shift, including trends in young adults moving across state lines for college.
Changes in immigration to California have had a large effect on the composition of young adults. About 20 percent of Californians aged 16–19 were foreign-born among those born between 1985–87 (Technical Appendix Table C15). Today, the share has fallen; about 8 percent of 16- to 19-year-olds are foreign-born.
By their late 20s, more Californian young adults are foreign-born because they migrate with their families or for school or employment throughout their 20s. That is, when those born in the mid-80s reached 25–30, over 28 percent were foreign-born. Young adults born more recently, however, reflect a smaller level of immigration from abroad.
Geographic mobility year to year is relatively low among young adults (and their families), including migration internationally and across state lines: 2 to 3 percent of 16- to 19-year-olds moved outside California in the year prior (Technical Appendix Table C16). The percentage doubles for 20- to 24-year-olds, with 4 to 5 percent moving per year. By age 24, roughly 25 percent of those born in California live in another state, a rate that has stayed roughly constant across generations (Technical Appendix Figure C19).
Finally, differences across generations may reflect the economic circumstances during their formative years. College graduates who enter the labor market during a recession face negative and persistent economic consequences (Kahn 2010); those who entered during the Great Recession saw longer-term drops in employment (Rothstein 2023). Later, we estimate the extent to which economic conditions drive differences across cohorts.
More Young Adults Are Working and/or in School in Recent Generations
Among those born in 1997–99, at age 24, about half were employed (56%), 16 percent were working while in school (Figure 3, far right bar), and 10 percent were still in school (and not working). An estimated 17 percent were not in school nor working, a group we discuss in detail later.
When these young adults were in their late teens, most were in school—consistent with the traditional pathway to education and the labor market for young adults (Figure 3, far left bar). The share working while in school rises substantially as young adults age—as does the rate neither in work nor in school, which doubles between age 18 and 23. Notably, at age 20, recent generations were as likely to be working while in school (32%) as to be in school only (32%). After age 20, working while in school is more common than being in school only.

These trends vary by race/ethnicity and gender. In their early 20s, fewer Black and Latino young adults are working, in school, or both than their white or Asian peers. (Technical Appendix Figure C3). Additionally, young men are more likely than young women to be working only in their early 20s (Technical Appendix Figure C4).
Past cohorts of 16-year-old Californians engaged with education and work in similar ways: a broad majority were in school, although the share working fell slightly (Technical Appendix Figure C2). That is, those born in the mid-1980s were three times more likely to work as those born roughly a decade later in the 90s—and about 50 percent more likely to work than those born two decades later.
While trends in the propensity to work at young ages play a role in these patterns, economic conditions do as well. Children born in 1994 were 16 in the aftermath of the 2007–2009 financial crisis, when unemployment and muted job growth persisted. We discuss later in more detail the important role economic conditions play in explaining differences across cohorts.
Today, these young adults are 24 and are more likely to be working (56%) than 24-year-olds in prior years (49% 12 years ago). At the same time, school attendance at age 20 has increased modestly, particularly for those born in 1991-forward. Taken together, fewer are out of both school and work in recent years compared to earlier cohorts. About 12 percent of 20-year-olds born between 2003–2005 are doing neither, compared to 16 percent of those born between 1985–87. While these rates increase with age, they are lower among more recent cohorts (Figure 4).


Educational Attainment Is Higher among More Recent Cohorts
Research has consistently documented earnings and other economic benefits from higher educational attainment. This is especially true for college education, but lower levels of educational attainment also show relative wage benefits.
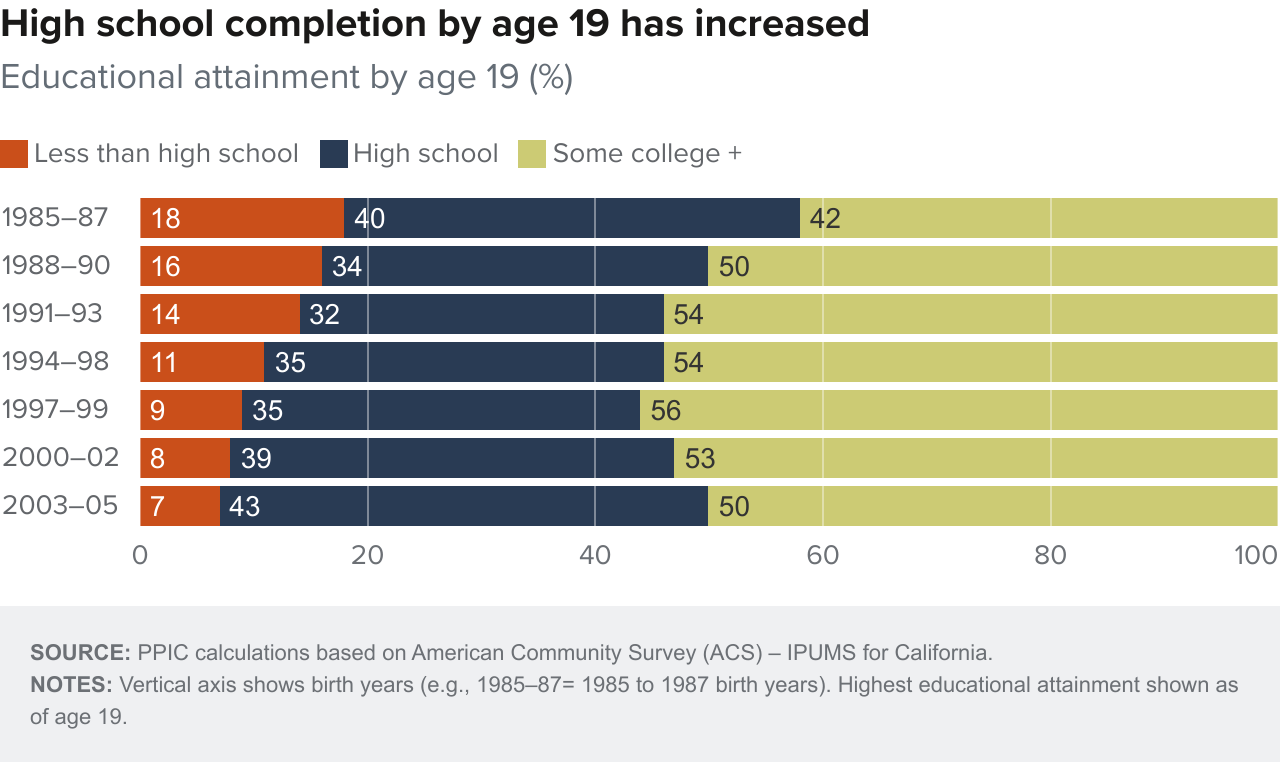
For the most recent cohort of 19-year-olds (born between 2003–2005), only 7 percent had less than a high school diploma by age 19, compared to over twice the share of 19-year-olds in the early 2000s (born between 1985–87), as shown in Figure 5. A majority of 19-year-olds have started college (“some college+”), except for the earliest cohort in our data (those born in the mid-80s). However, a large and slightly growing share of 19-year-old high school completers have not started college (43% among 19-year-olds born 2003–05).
High school completion rates have increased for all major demographic groups, with the largest gains among Latino youth—rising by approximately 20 percentage points over the study period (Technical Appendix Tables C1 and C2). Despite these gains, high school completion among Latino young adults at age 19 (90%) remains below the rates observed for other racial/ethnic groups, which approach or exceed 95 percent. Additionally, women are consistently more likely than men to complete high school by age 19, with completion rates of 94 percent and 92 percent, respectively.
The largest shift in educational attainment occurred in bachelor’s degree completion by age 24 (Figure 6). For those born from 1997–1999, fewer than 10 percent of 19-year-olds have less than a high school diploma, while approximately one-third have earned a bachelor’s or advanced degree. The share who fail to complete high school has shrunk by half; meanwhile the share who complete a bachelor’s degree or more has increased by about half. Much of that improvement includes completing a credential; a similar share of young adults have at least some college attendance by age 24 (62% among those born in the mid-80s compared to 67% of those born in 1997–99) but more today have earned a bachelor’s degree or more.

Degree attainment in recent cohorts is higher across all demographic groups (Technical Appendix Tables C3 and C4). Asian women have the highest rates of bachelor’s degree completion, approaching 60 percent, followed by white women at roughly 45 percent. In contrast, Latino men have the lowest completion rates at 12 percent and experienced relatively modest gains, while Black men also saw limited improvement over the same period.

Entry into the Labor Market, and into Full-Time Work, Occurs Later
Across all cohorts of young adults, entry into work climbs through the early 20s (Figure 7, first panel). By age 22, for instance, over 70 percent are working, and gaps across birth years are narrow. For the cohorts we can observe throughout their 20s, rates mostly stabilize in the late 20s.
These patterns reveal broad similarity across generations, despite changing demographics and economic conditions. However, trajectories differ across generations, with older groups entering the labor market earlier and more recently born groups entering later—but with higher participation rates.

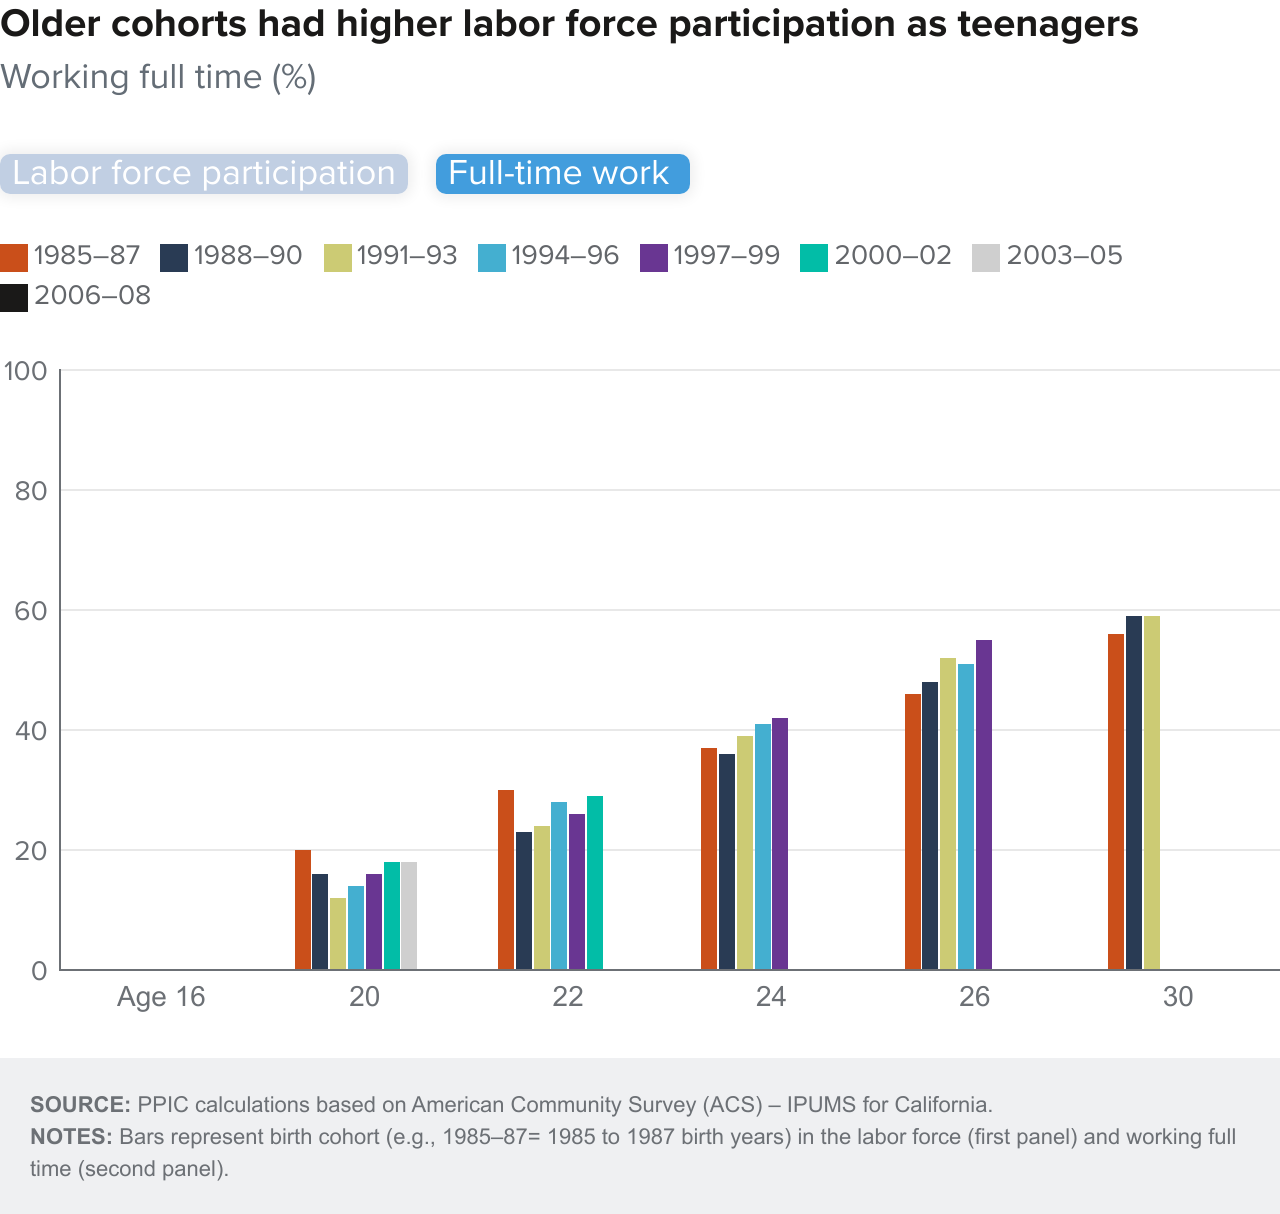
While working full time is uncommon until the mid-20s, older cohorts of young adults are more likely to work full time earlier in life, compared to more recent generations (Figure 7, second panel). But early entry into full-time work for older generations does not mean they are better off in this regard by the late 20s; the youngest cohorts we can measure, those born in the mid- to late-90s, are more likely to be working full-time than their older counterparts once they reach age 25.
Gender differences in labor force participation persist but have narrowed
At age 24, men in most recent cohorts are slightly more likely to be in the labor force than women (81% vs. 78%; Technical Appendix Tables C5 and C6). By age 30, labor force participation rises to 87 percent for men and 80 percent for women. Across racial and ethnic groups, rates are comparatively lower for Black men and Latina women throughout young adulthood. Among Latina women, child care responsibilities play a role in lower participation (Lafortune et al. 2024).
At age 24, white and Latino men have the highest rates of full-time employment, with close to 50 percent working full time, while Black men, Black women, and Latina women exhibit some of the lowest rates. By age 30, full-time employment rises substantially for most groups, with Asian men surpassing all others at 71 percent, followed by white and Latino men at 66 percent and 64 percent, respectively (Technical Appendix Tables C7 and C8).
More recent cohorts report slightly higher hourly wages
On average, median wages are slightly higher for more recent cohorts (Technical Appendix Figure C10). By age 23, for example, median wages (inflation adjusted) are roughly 3 dollars per hour higher for those born in 2000 to 2002 compared to those born in the late 1980s. The pattern continues into their late 20s; wages for more recent generations exceed that of their predecessors. Additionally, the advantage of those born in the mid-1980s fades away, and by age 30, their median wage is lowest across cohorts. Economic conditions in early adulthood have an outsize impact on earnings—most notably during the Great Recession—when controlling for these factors, wage differences are much smaller across cohorts.
Young Adults Not in School or Work
Who makes up the group of young adults who are not in school or working? There are notable demographic shifts across cohorts (Technical Appendix Tables C17 and C18): whereas women in older cohorts made up the majority of young adults out of school and work, today young men make up the majority at age 16 and 20—although the divide is even at age 24. Latino young adults comprise the majority in older and recent cohorts.
Recent cohorts of young adults today who are out school and work are also much less likely to have children and/or have ever been married, especially through age 24. Also, many more are still living with their parents than in prior generations.
The Share Not in School or Work Varies by Demographic Group
Rates of young Californians out of school and work vary by gender and race/ethnicity but have fallen at all ages and in all groups when comparing younger and older generations (Figure 8). In recent cohorts, men (13%) are more likely than women (11%) to be out of school and work at age 20, while the opposite was true in earlier cohorts: women (17%) were more likely than men (15%) to be out of school and work. At age 24, women become more likely than men to be out of school and work in both older and younger generations; but again, the share has fallen in recent cohorts.


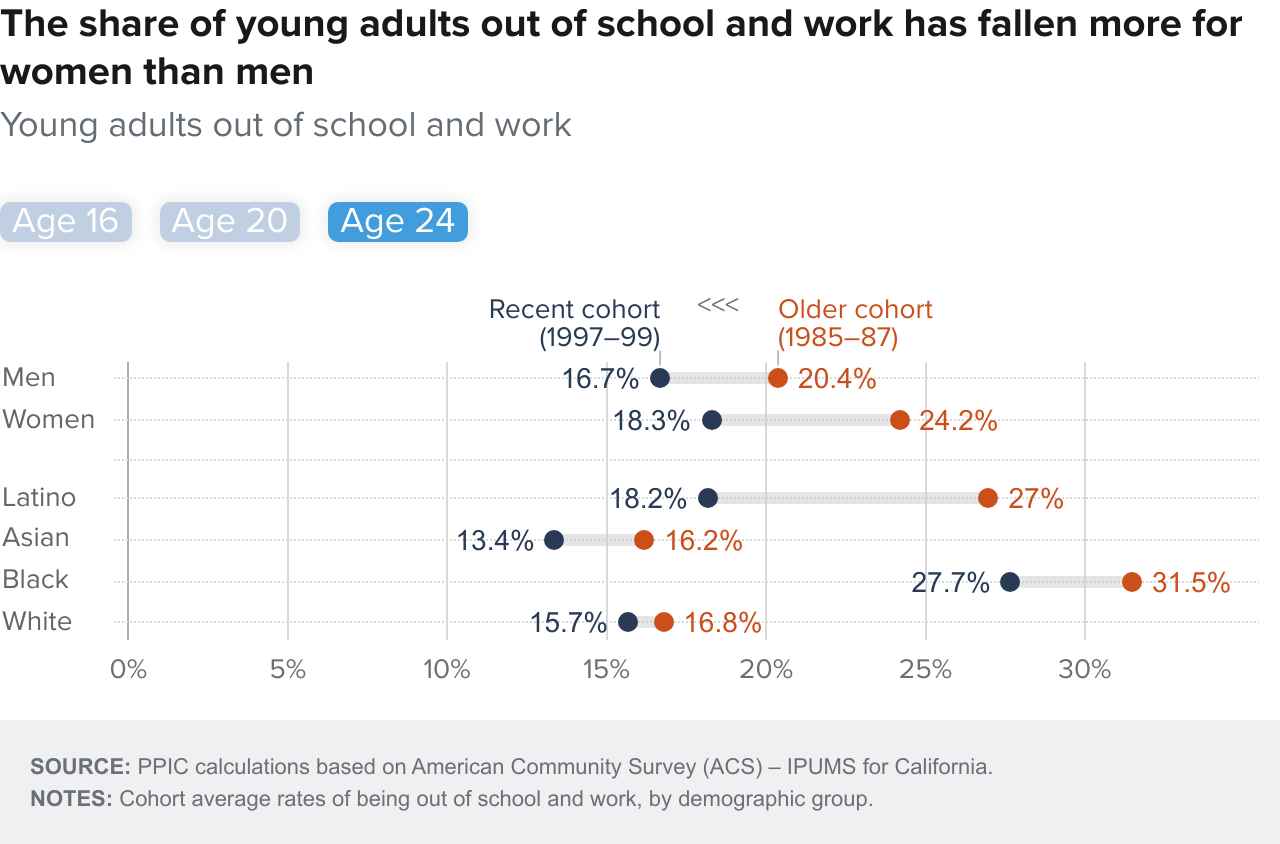
Notable differences appear in the share out of school and work across demographic groups: young Black and Latino Californians have higher rates compared to their Asian and white peers at every age, with the highest likelihood among Black men and women, and Latina women across cohorts (Technical Appendix Figures C2, C12, and C13). Despite these disparities, the overall rates of being out of school and work have improved modestly for all groups over time, though we lack the precision to draw firm conclusions for all groups.
Being out of School and Work Is a Temporary Phenomenon for Most
We analyze the Current Population Survey (CPS) to examine the challenges that may leave young adults out of school and work either for a long period or for short spells that indicate transitions rather than “disconnection.” Individuals in the CPS are interviewed for four months, not interviewed for the next eight, and then interviewed again for four months. This means that we observe individuals twice, one year apart: for example, an individual surveyed in January through April in one year will be surveyed during the same months the next year.
We calculate year-to-year transition rates for labor force participation and enrollment in schooling. Figure 9 reports transitions into and out of the labor force at different ages for young adults born from the mid-1980s through the late 1990s (and early 2000s under age 24).
At either end of the age spectrum, most young adults do not change their work status year to year; the youngest are mostly not in the labor force and stay that way and the oldest are mostly in the labor force and stay that way.
However, across generations the share of 16- to 19-year-olds not in the labor force increases, and the share entering the workforce year-to-year decreases, consistent with our earlier results on young adults staying in education longer. Across generations, the share of 20- to 24-year-olds who are not in the labor force also increases slightly—as do annual transitions out of the workforce. Entries into the workforce exceed exits for most generations at any age, reflecting traditional early career years. For those 25–30, entries and exits have remained relatively stable across cohorts.
Year-to-year transition rates into and out of the labor force among young adults, by birth cohort
Percent of cohort

SOURCE: Current Population Survey for California.
NOTES: Adjacent to the x-axis are birth cohorts (e.g., 85–89= 1985 to 1989 birth years) and then ages at which outcomes are measured. Outcomes all pertain to labor force participation (LF). Year-to-year transition rates estimated using matched responses across survey waves 12 months apart.
Using a similar approach, we examine year-to-year transitions for being both out of school and work. As most are in school and/or working in their teenage years, we focus on ages 20–24. The share who remain out of school and work two years in a row is nearly half, dropping from 8 percent in the 1985–89 cohort to 4 percent in the 2000–04 cohort (Technical Appendix Figure C14). This suggests that most return to education and/or employment in any given year. Rather than being a “persistent” state, young adults have considerable flow out of (and into) school and work.
Figure 10 splits these differences by gender. The decline—particularly in more persistent disconnection of longer than one year—is most notable for women (11% for the 1985–89 cohort to 2% in 2000–04). For men, the rate has remained similar.
Year-to-year transition rates into and out of school/work, by gender and birth cohort
Percent of cohort, ages 20–24

SOURCE: Current Population Survey for California.
NOTES: Those who are not in school or work at time of CPS survey. Year-to-year transition rates estimated using matched responses across survey waves 12 months apart.
For both men and women, the share who moved into school or work within a year has also increased. But for women, the share in their early 20s is generally smaller than the overall share entering or persisting without work or school. For men, the opposite is true, indicating a net growth in being out of school and work on average over these ages (consistent with earlier evidence).
Overall, these statistics provide important nuance about the variation in the persistence of young adults who are out of school and work. On the one hand, the small share of those who are out of school or work for longer periods may face longer-term and more structural barriers to employment or education.
On the other hand, there is considerable flow into and out of school and work, and more young adults experience some spell of being out of school and work at some point in early adulthood than point-in-time statistics reported earlier show. This is consistent with longitudinal evidence from MaCurdy et al. (2024), who show that 19 percent of young men and 25 percent of young women in the early 2000s experienced at least one spell of being out of work and school. Future research examining longitudinal trajectories could provide greater insight into these transitions and the variation in the persistence of the connection to school and work over early adulthood.
Household Milestones
Young adulthood is a period when individuals begin forming independent households, which can include moving away from their parents, marriage, childbirth, and taking on financial responsibilities. These decisions interact with the educational and employment milestones discussed above but also are influenced by a broad range of social, cultural, and other factors (Hemes and Vespa 2025). In our data, we observe some key milestones related to household formation.
Household Milestones Occur Later for More Recent Cohorts
Young adults today are more likely to live with their parents longer, enter marriage later, and have fewer children than earlier counterparts. These trends may reflect broader changes in economic conditions, social norms, and the timing of major life events. It has become increasingly more common for young Californians to delay forming a household and having children.
Most young Californians born in the 1980s were not living with their parents by age 22. By comparison, those born in the 1990s and early 2000s took an additional two years for a majority to live apart from their parents; that is, by age 24 (Figure 11). Around 20–30 percent of young adults in all the generations we can track into their late 20s and age 30 are living with their parents by 24, regardless of birth year. So, the key difference across generations is when between the ages of 19 and 30 young adults form households independent of their parents.

Relatedly, fewer young adults are married in their 20s today than in prior generations. By age 22, for instance, about 14 percent of Californians born in the 1980s were ever married; for the most recent generation (those born in the early 2000s) the rate is about half as much (Figure 12).
Though marriage rates increase with age, fewer in recent generations are married by their late 20s than their earlier counterparts. By age 30, more than 46 percent of children born in the mid-1980s were ever married compared to 39 percent of those born in the early 1990s. It remains to be seen if those born in the 2000s will have even slower marriage rates—so far, they are tracking with their counterparts born in the mid-1990s.

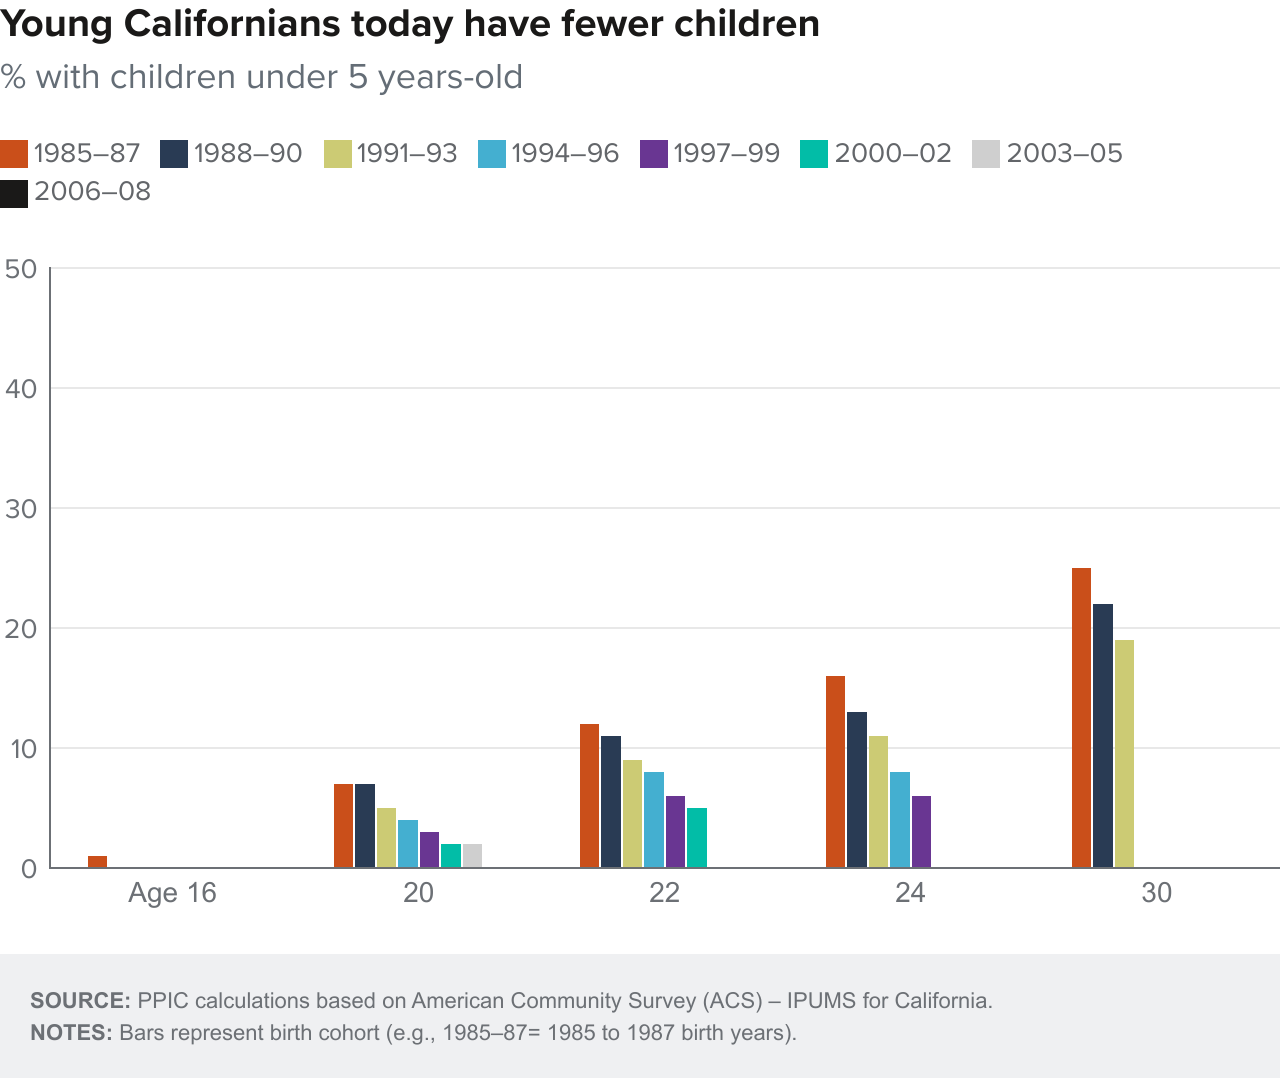
Finally, fewer young adults are becoming parents in their 20s today compared to earlier generations. By age 22, over 10 percent of those born in the 1980s were parents, but the rate is half as much for those born in the early 2000s. The trajectory toward parenthood declines cohort by cohort at almost every age, with the biggest gaps emerging around age 23 and persisting through the late 20s.
Across demographic groups, these changes vary. Whereas the share of young adults living with their parents increased by several percentage points across generations, the opposite was true for Asian young adults, who were less likely to live with their parents into their early twenties (Technical Appendix Tables C9 and C10). Marriage rates have declined more among Latina women (at age 24, a 12-percentage point drop) and Black men (at age 30, a 9-percentage point reduction; Technical Appendix Tables C11 and C12) than other race-gender groups. Similarly, the largest reductions in childbearing occurred among Latino and Black women at ages 20 and 24, each exceeding 10 percentage points, while Black females at age 30 were the only group to see an increase in this measure, rising by 3.9 percentage points (Technical Appendix Tables C13 and C14).
The Drivers behind the Trends
What is driving the differences across cohorts in their economic, educational, and social outcomes? Here, we consider the role of shifting demographic composition, broad social patterns, and economic conditions. For example, young adults born in the mid- to late-1980s were in their early 20s during and following the Great Recession—in the late 2000s and early 2010s—exactly when they might be starting work after college. Similarly, disruptions during the COVID-19 pandemic are associated with (temporary) increases in the share neither working nor in school for young adults born between 1994–1996, who were in their early 20s at that point (Technical Appendix Figure C11).
More Young Adults Are Completing Bachelor’s Degrees
With each cohort, greater shares of young adults complete bachelor’s degrees at age 24, even after controlling for demographics, regional unemployment rates, and time period effects—which capture common factors that affect all individuals in a given three-year window (e.g., the Great Recession). This suggests underlying shifts driving college degree completion beyond the macroeconomy and demographic changes in California.
Nonetheless, important differences appear across demographic groups. Asian and white young adults have higher completion rates than Black and Latino young adults (between +17 pp for white to +25 pp for Asian young adults). Women also have higher rates than men on average by 8 percentage points, though family responsibilities create barriers—women with young children are 10 pp less likely than women without children to complete a degree.
Workforce Participation Is Similar between Men and Women
For those age 24 or older, labor force participation rates are statistically similar across generations after controlling for demographic characteristics and period effects (see Technical Appendix Table D2). Holding these other factors equal, Latino young adults have the highest participation rates, 4 to 7 pp higher than other groups. Women have 2 pp lower rates than men—and for women with young children, the rate is 14 pp lower.
In terms of full-time work, more recent generations are more likely to be working full time by their mid- to late-20s than their older counterparts. These trends are largely explained by period effects rather than demographic changes, controlling for other characteristics (see Technical Appendix Table D3).
Racial and gender differences persist after controlling for other demographic and period differences across generations. Latino young adults are more likely to be employed full time when compared to other racial groups, who are between 2 to 3 pp less likely. Women are also less likely to be employed full time (-5 pp) compared to men, and even more so if they have a child under age 5 (-9 pp compared to women without children under age 5).
Economic and Period Conditions Explain Generational Differences in Young Adults Not in School or Work
The rates of young Californians who are out of school and work have fallen, largely due to economic factors. Generational differences are similar after controlling for demographics (see Technical Appendix Table D4). While race/ethnicity, nativity, and other characteristics are related to school and labor force participation, their differences across cohorts do not appear to drive long-term trends.
What does seem to matter are economic conditions: accounting for regional unemployment rates explains some of the generational differences, and accounting for time period and unemployment fully explain them. Some of this likely reflects the impact of changing labor market conditions; some may reflect how social patterns, like the decline in teen births, have widespread effects on the choices of young adults over time.
However, differences in the share of young adults out of school and work persists across racial groups even after controlling for other economic and demographic factors: Black young adults have 6 percentage point higher rates than Latinos, while Asian and white individuals have 5 and 3pp lower rates than Latinos, respectively.
Milestones Reflect Generational Shifts beyond Demographics and Period
Even after controlling for demographic and period effects, recent generations show significant differences in marriage, having children under age 5, or living independently from parents.
Some but not all of the generational decline in the likelihood to marry is explained by demographics and period effects. Similarly, while recent cohorts of young adults are more likely to live with their parents, generational differences are mostly (but not entirely) explained by demographic and period-specific factors.
There are also differences by race and gender. Marriage rates for Asian and Black young adults are 9 pp and 8 pp lower, respectively, compared to Latino young adults. Young women today are 6 pp less likely to live with their parents than men, all else equal. White young adults are 9 pp less likely to live with their parents than Latino young adults while Asian young adults are 1 pp more likely.
Notably, the share living with parents has been rising: rates through 2013–23 are 5–7 percentage points higher than through 2004–06. The change may reflect greater housing costs, longer time in postsecondary education, and other challenging economic conditions.
Generational gender patterns reflect timing and likelihood of having children
Childbirth, or the delaying of it, is a major factor among those not in school or work, which is seen most clearly in gender gaps. The gaps have narrowed over time: in earlier generations, more young women were out of education and work as of age 20 or 24 compared to men—while the opposite is true in recent generations (Figure 8, earlier). Since at least 1980s birth cohorts, young adult women over 18 and without children have always had lower rates of being out of school and work than their male counterparts (Technical Appendix Figure C18). The importance of childbearing in connection to education or work for young women is particularly notable in the 20s; by age 30, differences in being out of school and work between young men and women are smaller.
Early Warnings and Interventions
Beyond economic and generational drivers, individual choices and family contexts shape young adults’ achievement of key milestones. Longitudinal data lets us assess these factors, tracking individuals over time as they progress through school and work. California has developed the Cradle to Career Data System, which will meet such data needs when fully complete. At this stage, we rely on a national source, the High School Longitudinal Study (HSLS) from the National Center for Education Statistics (NCES) as well as research literature.
The HSLS has tracked ninth graders in 2009 through their high school, college, and early careers (Technical Appendix B). This group corresponds to our 1994–95 birth cohort; however, the HSLS sample does not permit a California-only analysis given its limited size. Nonetheless, national patterns are similar to those of California’s young adults with few exceptions.
Early Indicators for Young Adults Not in School or Work
We use HSLS data to connect high school indicators with odds of being out of school and work later in life. While this analysis is not causal, early indicators could be used to direct attention by practitioners or policymakers in the hopes of preventing later adverse outcomes. A few key early correlates of later outcomes emerge (Technical Appendix Table B2):
- Higher family socioeconomic status in high school is associated with significantly lower odds of being out of school or work at age 21–22. Socioeconomic status, together with parental education and employment, also explains much of the disparity across race/ethnic groups.
- Better high school math performance is associated with a lower probability of being out of school and work later in life—even after controlling for socioeconomic factors and demographic characteristics.
- Individual expectations for educational attainment in the future correlate with odds of being out of school and work: a high schooler expecting to earn a bachelor’s degree or more is less likely to be disconnected by age 21–22.
- Dropping out of high school before earning a diploma is associated with a higher probability of being out of school and work later in life, while the inverse is true for completing high school.
Insights into Interventions and Supports to Aid Connection to School and Work
Related research has examined what works to support young adults who are not working nor in school to reengage in one or both.
High school completion: Because of the connection between high school completion and later work and education outcomes, strategies aimed at identifying and preventing at-risk high school students from dropping out are a major focus of intervention.
Effective strategies from rigorous evaluations include monitoring student attendance and academic performance for early warning signs, providing timely and personalized academic or behavioral support to students who have fallen off track (either individually or in small groups), and engaging students in curricula or programs that connect schoolwork with college and career readiness (Rumberger et al. 2017; Freeman & Simonsen 2015).
Additionally, alternative schools, equivalency-to-college bridge programs, and comprehensive youth programs have been found to offer promising results for reengaging youth who have dropped out to pursue secondary education, earn a diploma, and even bridge to postsecondary vocational training or college (Treskon 2016).
Connection to postsecondary education: While pursuing higher education may be a more difficult path for young adults who are disconnected from work and school, programs that connect young adults with academic counselors or mentors have demonstrated success in postsecondary enrollment (Jobs for the Future 2018). Pursuing career education or earning credentials through community colleges also offer a pathway for youth to reengage with postsecondary education and build skills for the future (Anderson et al. 2019).
Engagement with work and work-based learning: While education can offer one route to “reconnect,” research shows that many young adults out of school and work are more inclined to pursue work-related opportunities. Opportunities for paid work, such as apprenticeships, pre-apprenticeships, or paid internships can result in skill gains, as well as the ability to afford basic needs to help stay connected to work (Alexander et al. 2023).
Job training and workforce development programs, particularly those with integrated support and financial services, also have shown success in supporting reconnection with labor market opportunities (Treskon 2016; Alexander et al. 2023). For youth out of work and school who may be reluctant to seek help reengaging, research has shown programs designed to meet multiple needs through bundled services and additional supports, such as counseling or case management, can be particularly successful (Millenky et al. 2024).
Conclusion
Young adults make critical choices between the ages of 16 and 24 that can have long-term payoffs—or repercussions. They don’t make these choices in a vacuum and may be influenced by their economic circumstances and the macroeconomy, access to educational and training opportunities, and broader social trends. Today’s young adults are considering how college pays off relative to its costs, what looking for a job in a slow market means for their opportunities, and whether living at home makes better sense than facing high rents.
Despite the present challenges, we find that young adults are generally staying in school longer, earning higher-level credentials, and entering into full-time work at higher rates than their predecessors. The vast majority have achieved these milestones by age 24—fewer among them are out of school and work. More recent cohorts are more likely to be in school—and stay in school longer to earn postsecondary degrees through their early adult years. Despite decreases over time in the share who work, young adults are pursuing postsecondary education to earn credentials or build skills for future careers.
Household composition and formation has also shifted for young adults. In recent generations, fewer are getting married in their 20s or having children, affecting the share who remain in school and who enter the labor market. Across their early 20s, young women are much more likely to be working or in school than in prior generations.
Today, 16- to 20-year-old young men are more likely to be out of school and work than young women of the same age—a reversal of past trends; inequities by race also persist as Black and Latino Californians remain more likely to be out of school and work.
Nationally, high school grades, student expectations, and completing high school are correlated with lower odds of being out of school and work after high school. Given these patterns, promising directions to improve labor market and educational connections include policies that help students earn better grades and earn their diplomas and that expand access to affordable postsecondary education and early career experiences.
Indeed, we see the biggest rise in young adults out of school and work around the end of high school—making it an important time for interventions. Still, family socioeconomic status explains much of the disparity by race and ethnicity (nationally), suggesting that policies that target young adults must take into account underlying economic circumstances and disparities.
Being out of school and work is not a persistent state—most young adults out of school or work at a given time eventually undertake education or employment one year later. Yet some remain out of school and work for longer. Young adults who struggle with transitions around schooling or work may require different policy prescriptions than those who are persistently out of the labor force and school. The share of young women experiencing longer spells of disconnection has fallen, but the opposite is true for young men. Interventions that target young Californians who are disconnected from school and work should reflect the changing demographic composition of this population.
Additional longitudinal data sources, like California’s Cradle to Career Data System, would bolster future research on the key transition points over young adulthood. Records in other states have illuminated important factors around young adult milestones, allowing nuanced indicators at the individual level (Boston Consulting Group 2023). Beyond enabling better research, these data systems could improve identification of young adults at risk of or experiencing some level of disconnection.
Topics
Completion Economic Mobility Economic Trends Economy Higher Education Jobs and Employment K–12 Education Population Workforce and TrainingLearn More

Is College Worth It?

How Are California’s Young Adults Faring Economically?

More Young Californians Are Working or in School than in Prior Generations

Without School or Work, Some California Youth Are Left Disconnected from the Economy

Young Californians May Be Choosing Work over School
