Key Findings
PPIC conducted its latest statewide survey soon after a series of unprecedented events unfolded on the world and national stage. US military action in Venezuela that led to the capture and removal of its president was followed by a US threat to take over Greenland. Operation Metro Surge in Minneapolis–St. Paul by the Department of Homeland Security resulted in thousands of arrests, two fatal shootings by federal agents, and a flurry of protests. The California governor proposed a 2026–27 state budget that raised concerns about federal cutbacks and a structural deficit. The Federal Reserve paused further interest rate cuts amid signs of US job growth and lower inflation, and California has continued its rapid expansion into the artificial intelligence (AI) industry.
These are the key findings of the Californians and Their Government survey on the 2026 elections, the state budget and taxes, state issues, and national issues that was conducted February 3–11, 2026:
- Five candidates are now in a close competition in the top-two gubernatorial primary in June—Steve Hilton (R), Katie Porter (D), Chad Bianco (R), Tom Steyer (D), and Eric Swalwell (D). About six in ten likely voters say they are satisfied with the choice of candidates in the governor’s race. About half are not too closely following the news about the governor’s race while about seven in ten are interested in seeing town halls and debates with the candidates. When it comes to local House races, six in ten likely voters favor the Democratic candidate over the Republican candidate. Democratic likely voters are more enthusiastic than others about voting in this election. For majorities of likely voters, the candidates’ positions on affordability are very important in determining their vote for governor and Congress.
- Forty-three percent of adults and 47 percent of likely voters think the state budget situation is a big problem. After reading a brief description of the governor’s proposed 2026–27 state budget, about six in ten support the plan. About half name health and human services as their highest priority for state spending and favor the state using its own funds to help offset federal cuts to health and human service programs. Fifty-five percent of adults and likely voters would prefer to pay lower state taxes and have fewer state services. Sixty-one percent of adults and likely voters favor raising state taxes paid by the wealthiest Californians to help reduce the large gap between state spending and revenues.
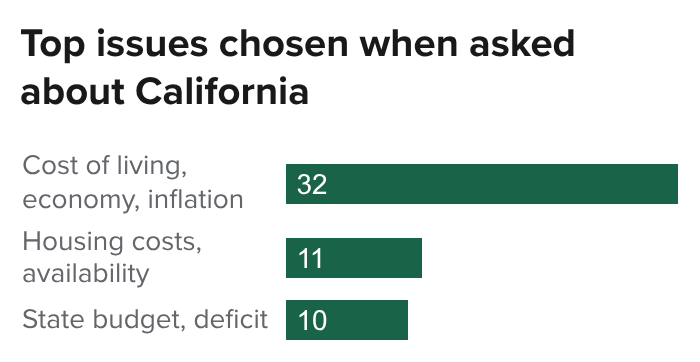 About one in three Californians name the cost of living and inflation as the most important issue for the governor and legislature to work on in 2026. Majorities think that things in California are going in the wrong direction, and seven in ten expect that California will have bad times financially during the next 12 months. Most expect their local economy and personal financial situation to be about the same six months from now. Seven in ten feel that their incomes are not keeping up with inflation. Four in ten are concerned about not having enough money to pay their rent or mortgage. Fifty-one percent of adults and 52 percent of likely voters approve of the job performance of Governor Gavin Newsom. Majorities expect the governor and legislature to work together and accomplish a lot this year.
 Most Californians name political extremism or threats to democracy, economic conditions, and immigration as the most important problems facing the US today. About three in four think that the US is generally going in the wrong direction and expect that the US will have bad times financially during the next 12 months. Majorities of Californians disapprove of the job that US Immigration and Customs Enforcement (ICE) is doing, approve of recent protests against ICE actions, and believe that ICE actions have made communities less safe. Seven in ten oppose the federal cuts to Medicaid. Twenty-five percent of adults and 30 percent of likely voters approve of the job performance of President Donald Trump. About one in four expect the president and Congress to work together and accomplish a lot this year.
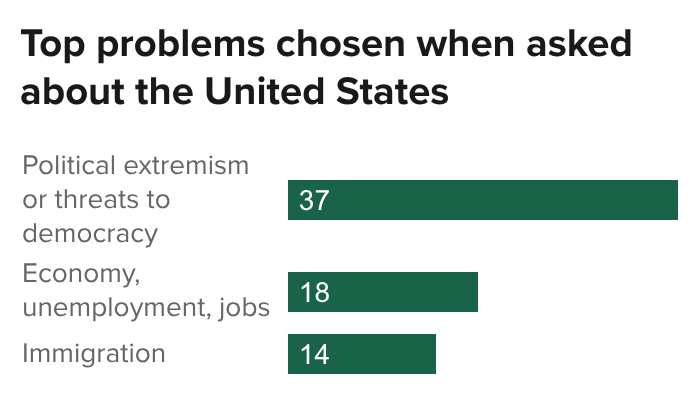 Most Californians name political extremism or threats to democracy, economic conditions, and immigration as the most important problems facing the US today. About three in four think that the US is generally going in the wrong direction and expect that the US will have bad times financially during the next 12 months. Majorities of Californians disapprove of the job that US Immigration and Customs Enforcement (ICE) is doing, approve of recent protests against ICE actions, and believe that ICE actions have made communities less safe. Seven in ten oppose the federal cuts to Medicaid. Twenty-five percent of adults and 30 percent of likely voters approve of the job performance of President Donald Trump. About one in four expect the president and Congress to work together and accomplish a lot this year.
2026 Elections
California’s direct democracy has shaped the fundamental features of the state’s 2026 elections. The open primary on June 2, which will determine the top two candidates running for Congress and state elected offices in the November 3 general election, is a result of the citizens’ initiative passed by California voters in 2010. No incumbents are running in several of the races—including governor—due to the two-term limits established by the citizens’ initiative passed by California voters in 1990. The congressional elections are taking place with a partisan redistricting plan that California voters passed last November.
Gubernatorial Primary. California likely voters are now closely divided between five candidates in the top-two governor’s primary: Steve Hilton (R), Katie Porter (D), Chad Bianco (R), Eric Swalwell (D), and Tom Steyer (D). Other candidates each have 5 percent or less support while 10 percent are undecided. Most Republicans support the two Republican candidates (39% Hilton, 32% Bianco), and half of Democrats support the three Democratic candidates (19% Porter, 18% Swalwell, 14% Steyer); few partisans would vote for a candidate outside of their party. Independents divide their support between Porter (15%), Hilton (11%), Steyer (11%), Bianco (9%), and Swalwell (8%). Since our December PPIC Survey, three Democratic candidates (Matt Mahan, Steyer, Swalwell) entered the governor’s race, and support for Democrat Xavier Becerra (14% to 5%) and Porter (21% to 13%) has declined while support for Bianco and Hilton held steady.
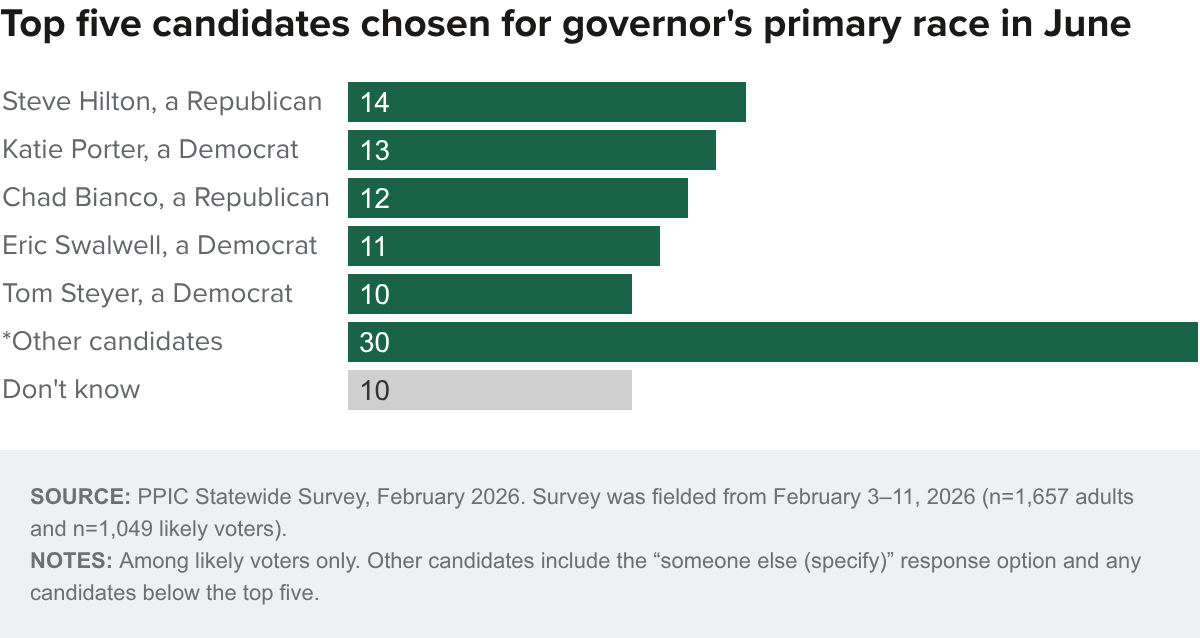
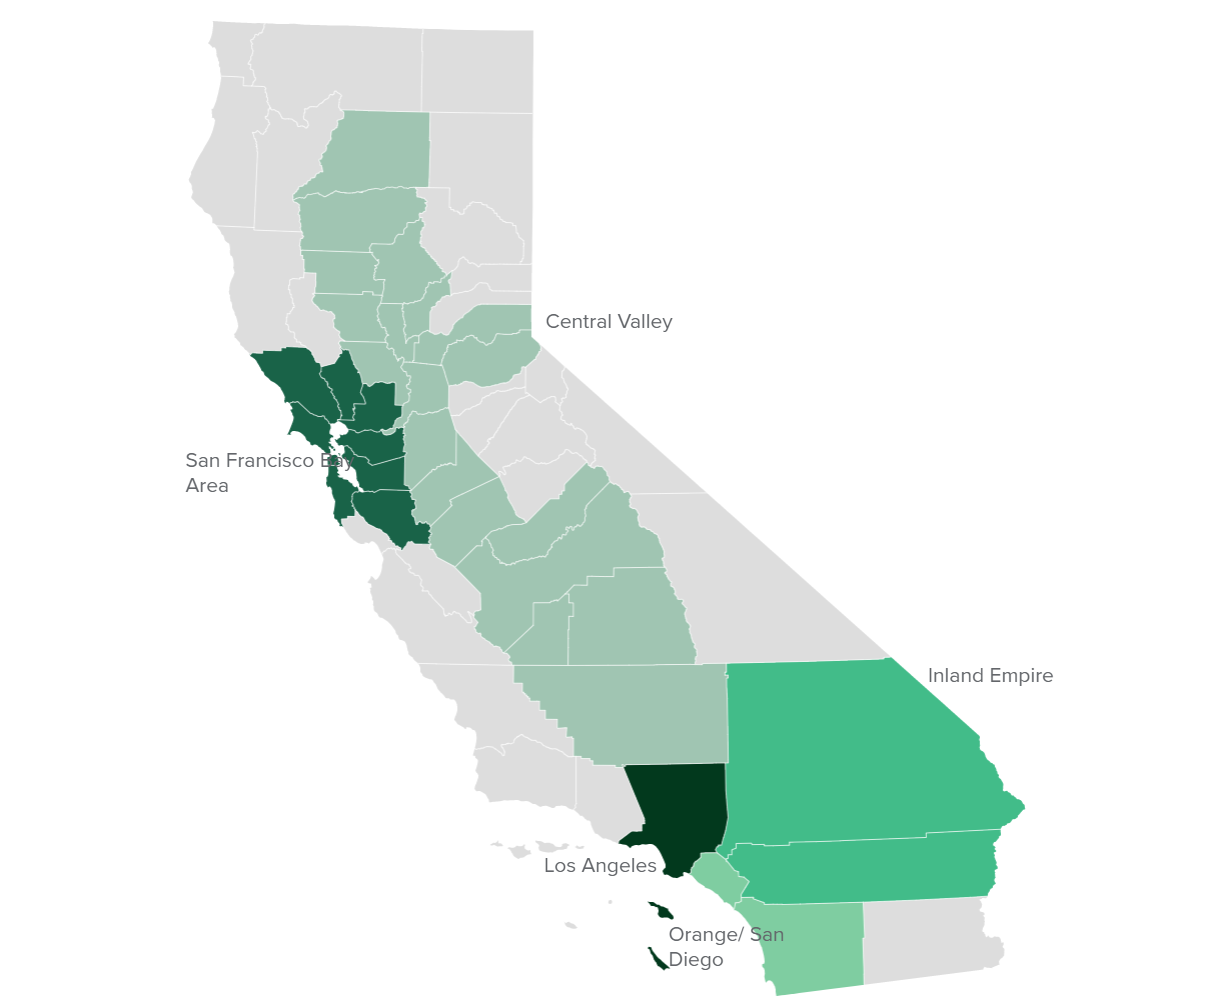
Sixty-one percent of likely voters are satisfied with the candidate choices in the governor’s race. Partisans vary in satisfaction with the choices for governor (69% Democrats, 64% Republicans, 45% independents) while majorities express satisfaction across demographic groups and state regions (69% Inland Empire; 64% Orange/San Diego County; 63% San Francisco Bay Area; 60% Central Valley; 54% Los Angeles).
When asked about the most important qualification to them for a candidate for governor, 66 percent of likely voters choose the candidates’ stands on the issues, as do majorities across parties, regions, and demographic groups. Fewer name character (17%), experience (11%), or political party (6%) as the most important qualification. The candidates’ positions on affordability and the cost of living are very important to 61 percent of likely voters and to majorities across parties, regions, and demographic groups in determining their vote for governor. Those who are under 35 years of age (78%), renters (73%), and those with incomes under $40,000 (73%) are more likely than others to say the candidates’ positions on affordability and the cost of living are very important to them.
Forty-eight percent of likely voters say they are not too closely following the news about candidates for the 2026 governor’s election (11% very, 28% fairly, 13% not at all closely), as do pluralities across partisan and demographic groups and state regions. Still, 72 percent say they are very (29%) or somewhat (43%) interested in seeing a series of debates and town halls with the candidates for governor, including majorities across parties, regions, and demographic groups.
US House Races. California likely voters choose the Democratic candidate over the Republican candidate in their House race by a wide margin (62% to 36%). The margin was similar in the December PPIC survey and in PPIC surveys during the 2024 election cycle. Partisans overwhelmingly support their party’s candidate while the majority of independents would vote for the Democratic candidate. About half or more across demographic groups and state regions would vote for the Democratic candidate for Congress.
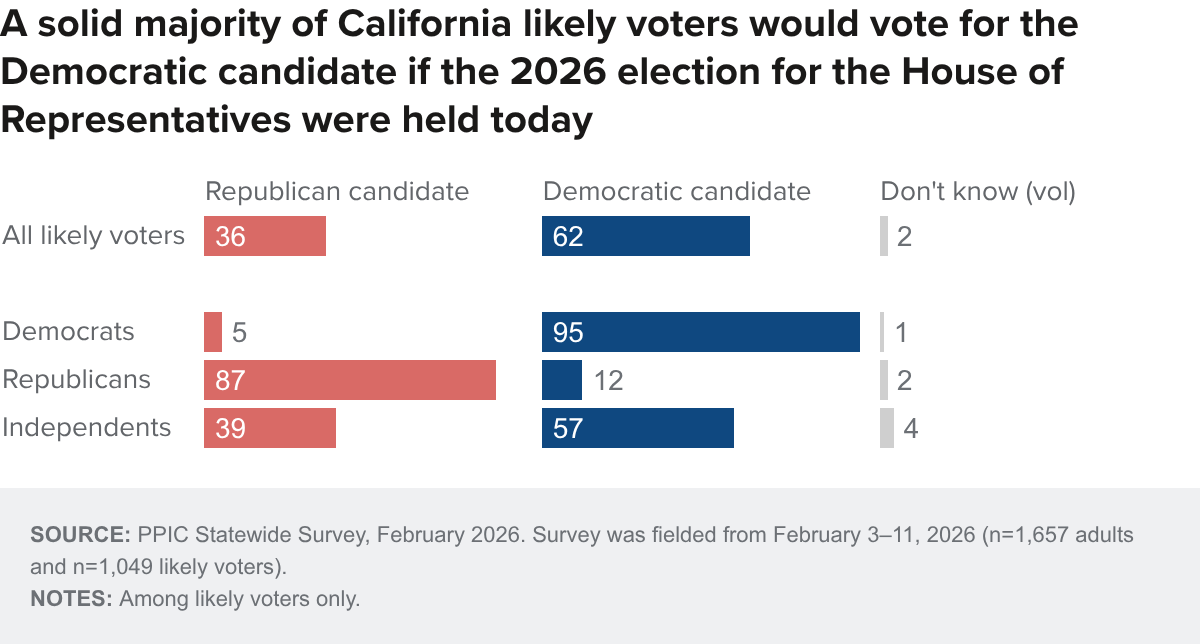
In the wake of partisan redistricting after voters passed Proposition 50, 38 percent of likely voters are very or extremely enthusiastic about voting for Congress this year, and more Democrats (51%) express this level of enthusiasm than Republicans (31%) and independents (24%). Fifty-seven percent of likely voters think the country will be better off if the Democrats win control of Congress in this November’s elections, with partisans varying in this view (89% Democrats, 11% Republicans, 50% independents). Fifty-six percent say the candidates’ positions on affordability are very important in determining their vote in the House race. Those under 35 years old (76%), renters (71%), Latinos (65%), those with incomes under $40,000 (64%), and Democrats (63%) are more likely than others to say that candidates’ positions on affordability are very important.
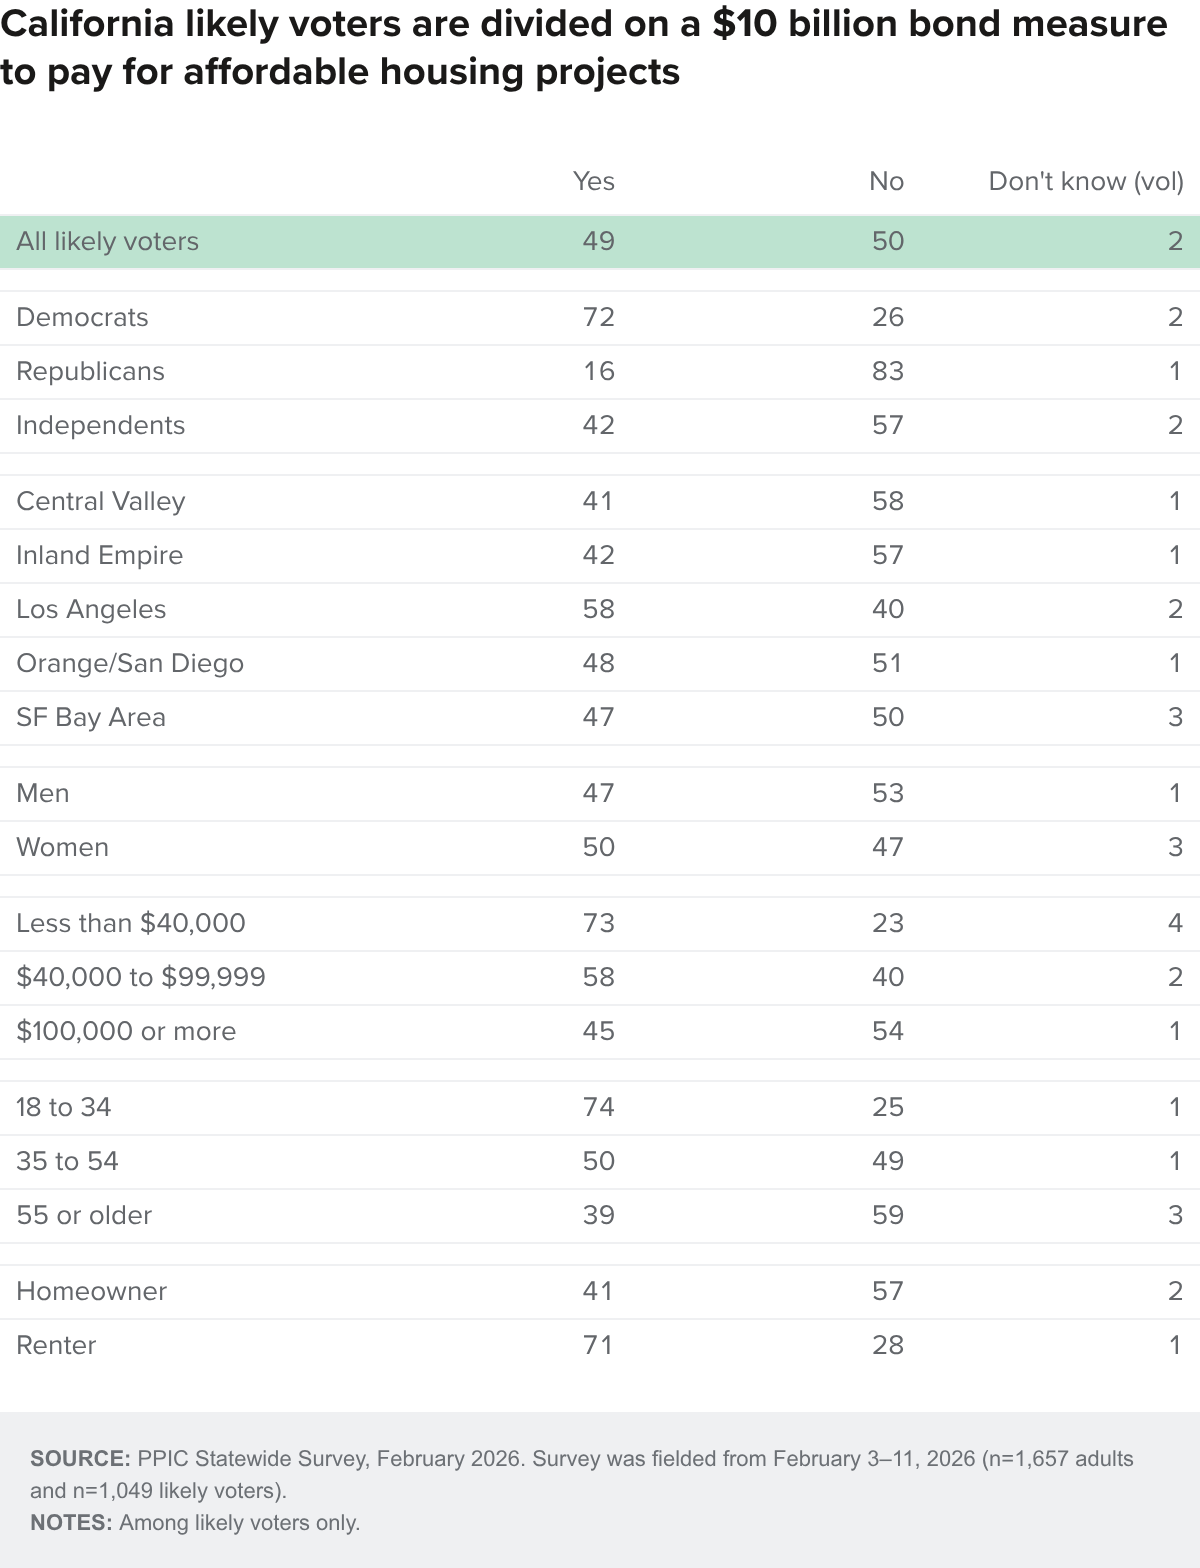
State Ballot Measures. There are no state propositions on the June ballot, but California voters are likely to face an abundance of legislative measures and citizens’ initiatives on the November ballot. Several of the potential state propositions would ask voters to weigh in on state fiscal issues, including a billionaires’ tax, a $10 billion state housing bond, and raising the voter threshold to pass taxes. In the context of the projected gap between state spending and revenues—and given the looming cuts in federal funding for state programs—how do Californians feel about voters making the tough decisions facing the state budget this year?
Seventy-seven percent of likely voters prefer that California voters make some of the decisions about spending and taxes at the ballot box; only 22 percent prefer the governor and legislature to make all spending and tax decisions. By comparison, just 51 percent of likely voters say they have a great deal (6%) or fair amount (45%) of trust and confidence when it comes to the voters making fiscal decisions about spending and taxes at the ballot box while 49 percent have not much trust (36%) or none at all (13%).
Likely voters are divided (49% yes, 50% no) when asked about the $10 billion dollar state bond to fund affordable rental housing and homeownership programs. Likely voter support for the state housing bond varies across partisan, age, homeowner, and income groups and state regions. Majorities who say that they would vote yes have a great deal or fair amount of trust and confidence in the voters making fiscal decisions.
State Budget and Taxes
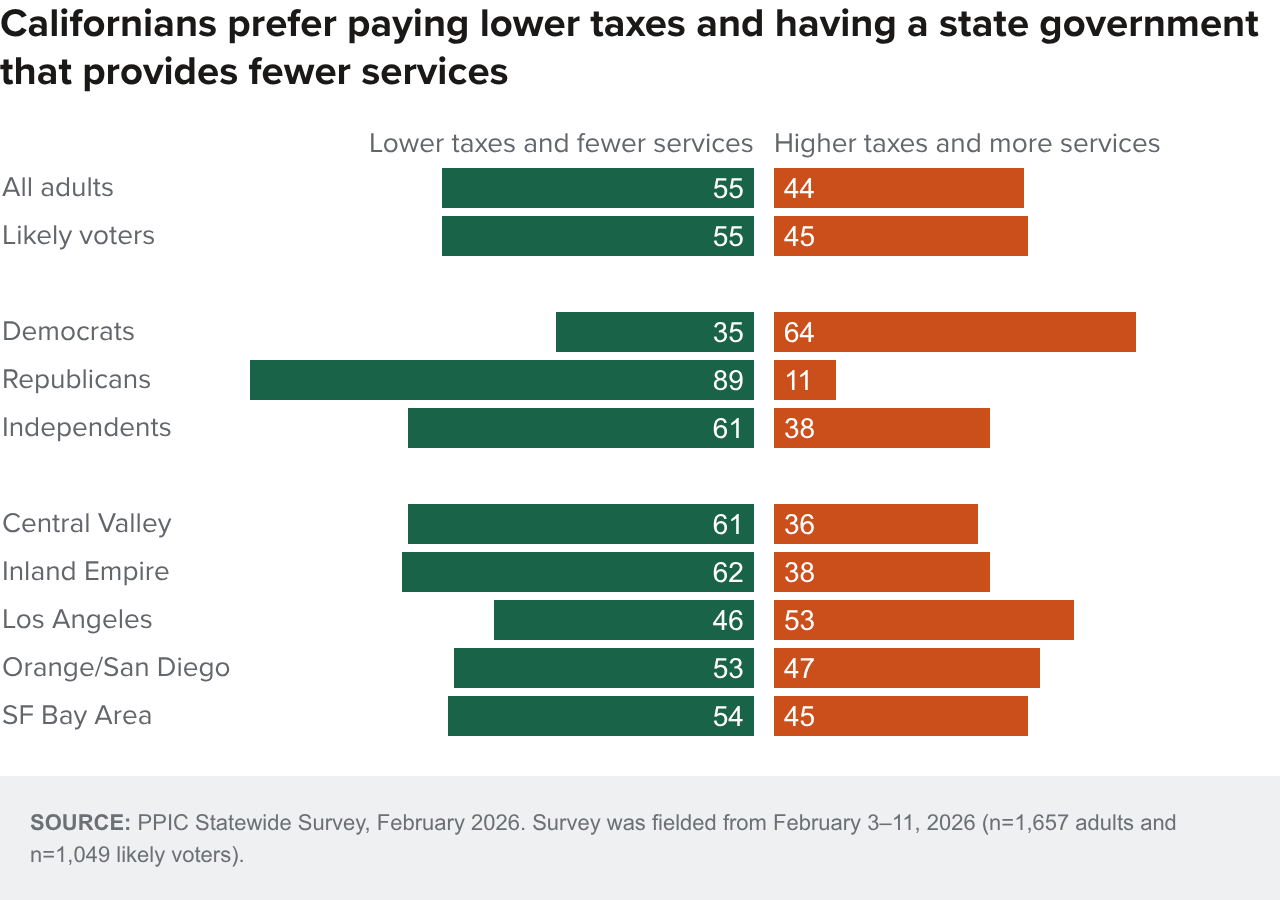
As the California budget process begins, a majority of Californians and likely voters say they prefer to pay lower taxes and have a state government that provides fewer services rather than pay higher taxes and have a state government that provides more services. Findings were similar last June (55%) and February (51%). The preference for lower taxes and fewer services is prevalent, with majorities across parties, regions, and demographic groups holding this view, with a few exceptions: Democrats (35%), Los Angeles (46%), renters (46%), those ages 18 to 34 (49%), and those with incomes of less than $40,000 (48%).
Turning to the state budget, Governor Newsom released his budget proposal for 2026–27 with $248.3 billion in General Fund spending and with a $2.9 billion deficit that is addressed primarily by suspending a $2.8 billion end-of-year deposit to the Rainy Day Fund. The budget prioritizes existing investments, including increased K–12 per pupil funding and expanded before/after/summer school programs. When asked about the state budget situation—that is, the balance between government spending and revenues—nine in ten Californians say it is a big problem (43%) or somewhat of a problem (48%), while fewer than one in ten (7%) say it is not a problem. Likely voters hold similar views (47% big problem, 45% somewhat of a problem, 8% not a problem). Californians held similar views last June (43% big problem, 49% somewhat of a problem) and February (38% big problem, 53% somewhat of a problem). Today, overwhelming shares of Californians across parties, regions, and demographic groups say the budget situation is a problem. Notably, Republicans (77%) and independents (50%) are far more likely than Democrats (24%) to call it a big problem.
When asked which of four areas should have the highest priority when it comes to state government spending, about half say health and human services (49%) and more than a third say K–12 public education (37%); fewer than one in ten say prisons and corrections (7%) or higher education (6%).
After reading a short summary of Governor Newsom’s budget proposal, six in ten Californians and likely voters support Governor Newsom’s proposed budget for the next fiscal year. There is a wide partisan divide between Democrats and Republicans, while a majority of independents are in favor. Looking beyond party, about half or more across regions and demographic groups support the budget proposal.

Californians are divided on how they would prefer to deal with the $2.9 billion gap between spending and revenues: 43 percent say mostly through spending cuts while 39 percent say a mix of spending cuts and tax increases. Fewer than one in ten say mostly through tax increases (8%). Likely voters are slightly more likely to prefer addressing the gap mostly through spending cuts (49%).
When asked about specific components of the proposal, a majority of adults (55%) and likely voters (59%) favor the state using its own funds to help offset the federal cuts to health and social service programs in the One Big Beautiful Bill Act. When asked about using $200 million in state funds to replace reduced federal support for electric vehicle incentives, just one in three Californians (32%) and likely voters (35%) are in favor.
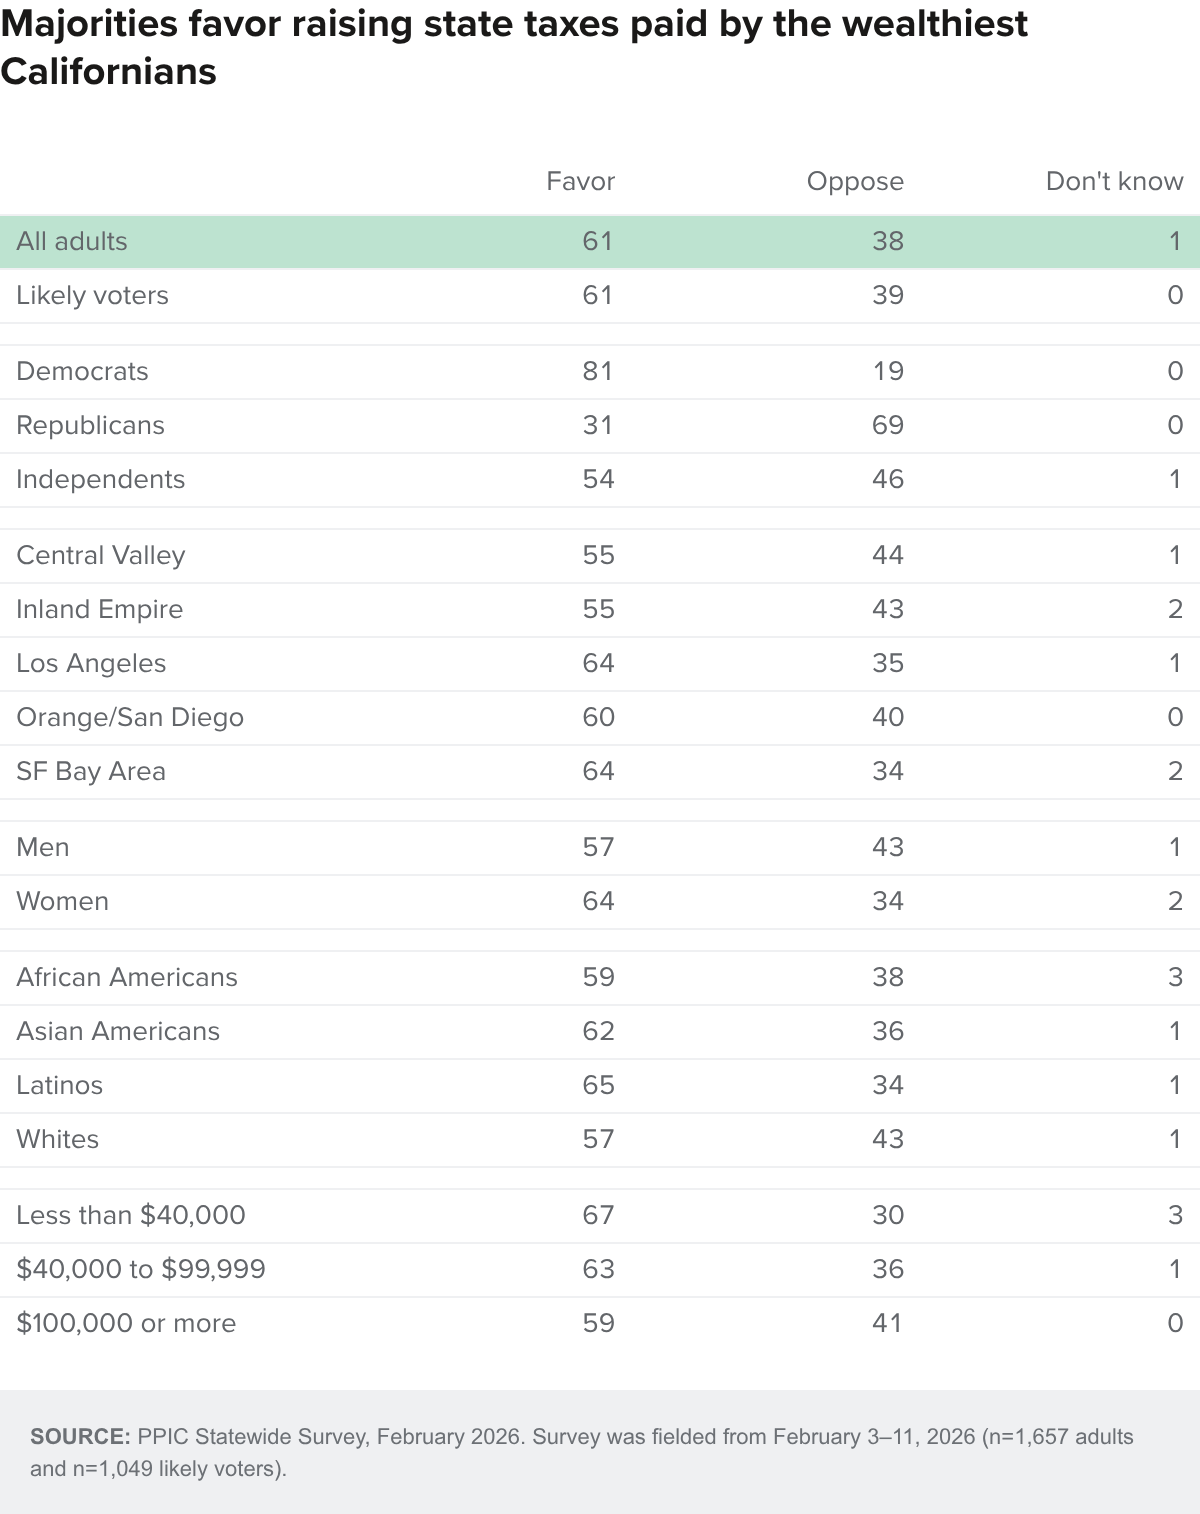
With signatures being gathered for state ballot measures that propose a one-time 5 percent wealth tax on billionaires and extending a current tax on high-income earners, how do Californians feel generally about raising the state taxes paid by the wealthiest Californians to help reduce the large gap between state spending and revenues? Six in ten adults and likely voters are in favor, while nearly four in ten are opposed. Although partisans are divided on this proposal, there is majority support across regions and demographic groups.
State of the State
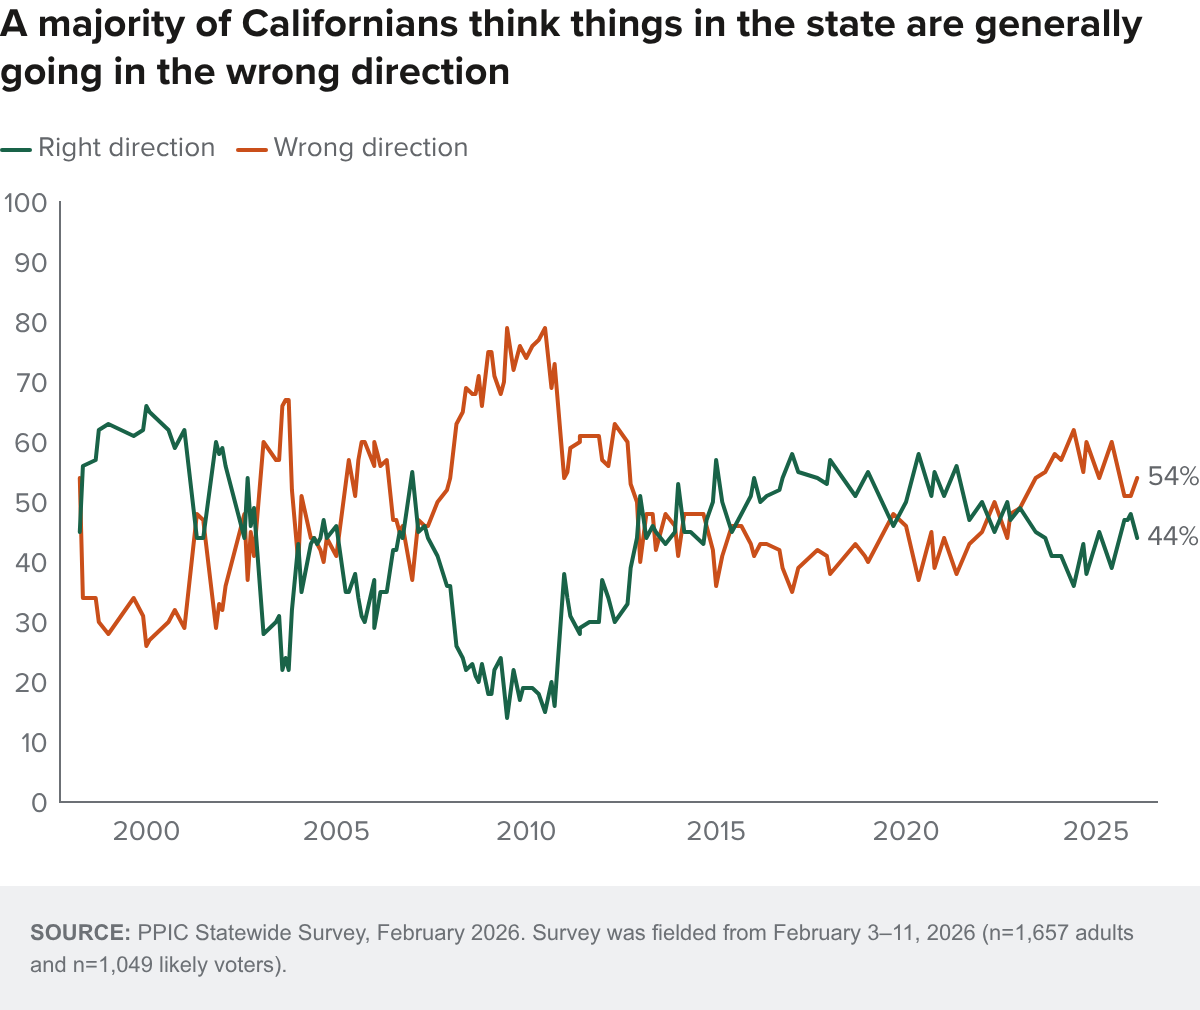
Majorities of California adults (54%) and likely voters (52%) think that things in the state are headed in the wrong direction; these views are nearly unchanged from last February (54% adults, 51% likely voters). Seven in ten Democrats (70%) say the state is going in the right direction, while nine in ten Republicans (90%) and six in ten independents (62%) say it is headed in the wrong direction. Majorities across most major regions hold a negative view, with the exception of San Francisco Bay Area residents (52% right direction). About half or more across demographic groups say the state is going in the wrong direction.
When asked about the most important issue for the governor and state legislature to address in 2026, Californians are far more likely to name the cost of living, the economy, or inflation (32%) than any other issue. This was the top issue across parties, regions, and demographic groups. Consistent with these concerns, about seven in ten adults (71%) and likely voters (73%) expect bad economic times over the next year. A majority of Californians have expressed this gloomy economic outlook since late 2021.
About four in ten adults expect their local economy to be weaker six months from now (30% somewhat weaker, 11% much weaker). About half (49%) say it will remain about the same, and only one in ten expect it to be stronger (8% somewhat stronger, 2% much stronger). Across state regions, Los Angeles residents (47%) are the most likely to expect their local economy to weaken over the next six months, while San Francisco Bay Area residents (36%) are the least likely. Aside from the Bay Area, just one in ten or fewer residents across regions expect their local economy to be stronger.
Looking ahead six months, about six in ten Californians (58%) expect their personal financial situation to remain about the same. About one in four expect it to worsen (18% somewhat weaker, 5% much weaker), while about two in ten expect it to improve (15% somewhat stronger, 3% much stronger). Majorities across parties, regions, and demographic groups anticipate no change in their personal finances over the next six months. About three in ten Los Angeles residents (29%) expect their financial situation to worsen, a higher share than in other major regions. Perceptions of financial decline fall as income rises (32% less than $40,000; 27% $40,000 to $99,999; and 20% $100,000 or more).
Most Californians feel that their income is not keeping up with inflation; about two in three or more across demographic groups share this view. The perception that personal income is falling behind inflation decreases with rising income. San Francisco Bay Area residents are more likely than residents in other regions to say their income is keeping up with inflation.
Furthermore, about four in ten Californians are very (15%) or somewhat (27%) concerned about having enough money to pay their rent or mortgage. Concern about housing payments varies across regions, with Inland Empire residents (51%) the most worried and San Francisco Bay Area residents (32%) the least concerned (46% Los Angeles; 44% Central Valley; 37% Orange/San Diego). A majority of Latinos (54%) are concerned, compared to smaller shares of African Americans (45%), Asian Americans (41%), and whites (27%). Most residents earning less than $100,000 are concerned about their housing payments (74% less than $40,0000; 55% $40,000 to $99,999), compared to a much smaller share of those earning more than $100,000 (28%). Renters (59%) are nearly twice as likely as homeowners (31%) to be concerned about paying for housing.

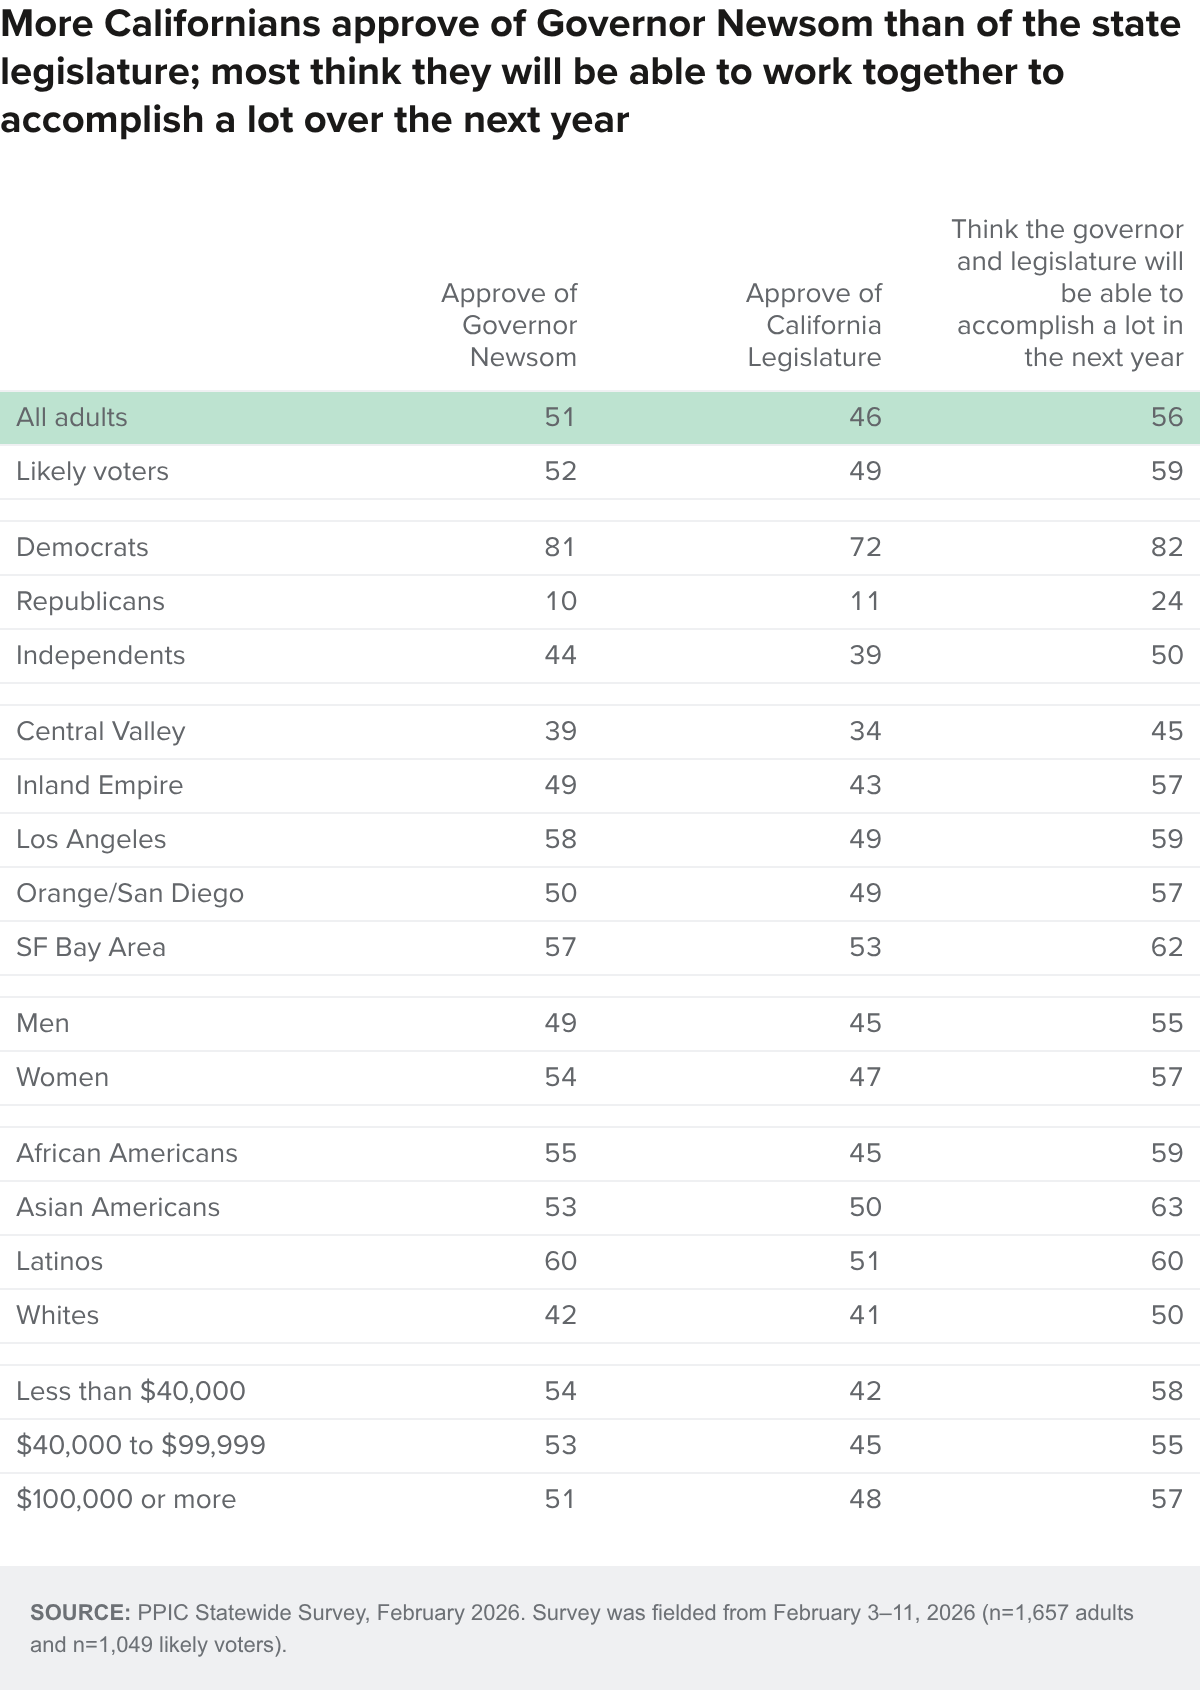
A slim majority of adults and likely voters approve of Governor Newsom’s job performance (disapprove: 47% adults, 47% likely voters). An overwhelming share of Democrats approve, while a majority of independents and nine in ten Republicans disapprove. The share of adults approving is similar to a year ago (52% February 2025). Approval is much higher in Los Angeles (58%) and the San Francisco Bay Area (57%) than in the Central Valley (39%). About half or more across most demographic groups approve of Newsom except for whites (42%) and residents with some college education (44%).
A slim majority of adults disapprove of how the California Legislature is handling its job, while likely voters are evenly split (49% approve, 49% disapprove). These shares are similar to a year ago. Approval varies across parties, regions, and demographic groups and is highest among Democrats (72%), San Francisco Bay Area residents (53%), and Latinos (51%).
A majority of adults (56%) and likely voters (59%) say Governor Newsom and the state legislature will be able to work together to accomplish a lot in the next year. Eight in ten Democrats and half of independents agree, while three in four Republicans disagree. Half or more across most regions and demographic groups hold this positive view.
State of the Nation
After a tumultuous first year under President Trump’s second term, Californians most often choose political extremism or threats to democracy (37%) as the most important problem facing the US today, followed by jobs and the economy (18%), and immigration (14%). About three in four California adults (77%) and likely voters (73%) say the country is headed in the wrong direction—similar to a year ago. Californians are more likely than adults nationwide (61%) to hold this pessimistic outlook, according to an Ipsos poll conducted earlier this year.
Most say the US will have bad financial times in the next 12 months (72% adults, 69% likely voters), similar to a year ago. Today, six in ten or more across demographic, regional, and partisan groups expect bad times; however, there is an exception among Republicans, where six in ten (61%) expect good times financially over the next year.
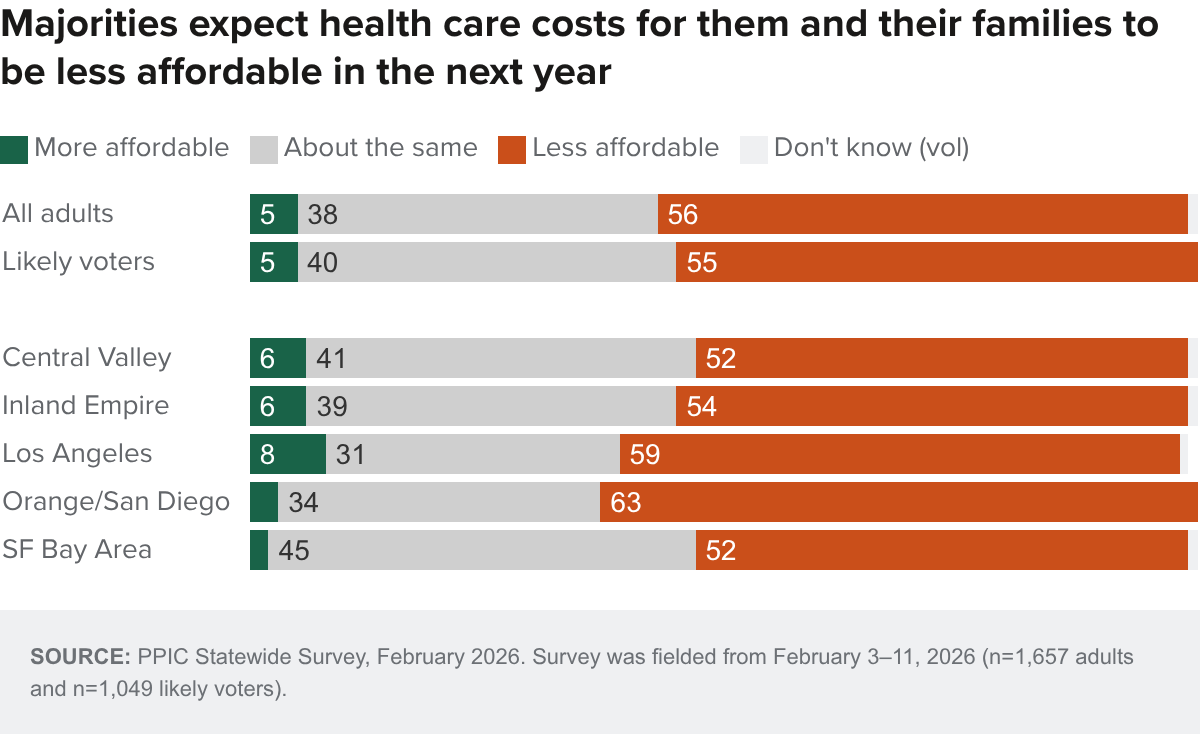
Majorities of adults and likely voters expect health care costs for them and their families to become less affordable in the next year; about four in ten say it will be about the same, and very few expect it to be more affordable. Half or more across demographic groups and the state’s major regions expect health care costs to be less affordable. Californians are about as likely as adults nationwide (56%) to say this, according to a recent Kaiser Family Foundation (KFF) poll.
Most adults (49% strongly, 24% somewhat) and likely voters (52% strongly, 17% somewhat) in the state oppose the cuts to Medicaid included in the One Big Beautiful Bill Act. Partisans are divided on this issue, and two in three or more across demographic and regional groups are at least somewhat opposed to the cuts to Medicaid.
A solid majority of adults and likely voters (64% each) say the US Congress did the wrong thing by not extending enhanced tax credits through the Affordable Care Act that expired at the end of 2025 (right thing: 32% adults, 35% likely voters). Partisans are divided, and six in ten or more across demographic and regional groups say the US Congress did the wrong thing. Californians are about as likely as adults nationwide in the KFF poll to say this (67%).
With a dramatic increase in funding and operations for the US Immigration and Customs Enforcement agency (ICE), about three in four adults (77%) and likely voters (73%) disapprove of the job that ICE is doing (approve: 22% adults, 27% likely voters). Most across demographic, regional, and partisan groups disapprove, except for Republicans (64% approve). Californians (77%) are much more likely than adults nationwide (60%) to disapprove, according to a January NPR/PBS News/Marist poll.
Six in ten adults and likely voters say that in the communities where ICE is conducting its operations, the operations are making those communities less safe; two in ten adults and a quarter of likely voters say more safe, and two in ten or fewer say it does not change either way. Californians age 18 to 34 (73%), Asian Americans (71%), San Francisco Bay Area residents (72%), and college graduates (69%) are among the most likely to say ICE makes communities less safe. Adults in the state are more likely than adults nationwide to say this (52%), according to a January CBS/YouGov poll. Six in ten California adults (42% strongly, 18% somewhat) and likely voters (48% strongly, 13% somewhat) approve of recent protests against ICE actions.

The president’s approval ratings remain low, with a quarter of California adults and three in ten likely voters saying they approve. This share is similar to a year ago (30% adults, 33% likely voters). Today, there is a large partisan divide on this issue. Californians are less likely than adults nationwide (38%) to approve of the president, according to an Ipsos poll in January.
About two in ten adults and likely voters approve of the way the US Congress is handling its job. These shares are similar to a year ago. Today, about seven in ten or more across parties, regions, and demographic groups disapprove, with the exception of Republicans who are divided.
Roughly a quarter of adults and likely voters say that the president and the US Congress will be able to work together and accomplish a lot in the next year, with seven in ten or more holding a pessimistic view (74% adults, 71% likely voters). Last February, Californians were much more optimistic (39%). Today, two in three or more across parties, regions, and demographic groups are pessimistic, except for Republicans who are more likely to be optimistic (62%).


Topics
2026 Election Political Landscape Statewide SurveyLearn More
California Voters and the Top-Two Primary

Californians Want a Smaller State Government as Views on Taxes Turn Negative
Concern over Health Care Affordability Is Widespread

Most Californians Expect Little Change to Their Finances Despite Economic Uncertainty
It’s Anyone’s Race in the Governor’s Primary