Key Findings
In response to Texas’s partisan congressional redistricting, California voters passed Proposition 50 in a November 4 election that took place during the longest federal government shutdown in US history. The federal shutdown from October 1 to November 12 affected the federal workforce and the households that receive federal food assistance; it also disrupted air travel for many Americans. Meanwhile, executive actions continue on tariffs, increased immigration enforcement, and National Guard deployments in US cities. The Federal Reserve cut interest rates this fall amid concerns about job growth, consumer prices, and spending.
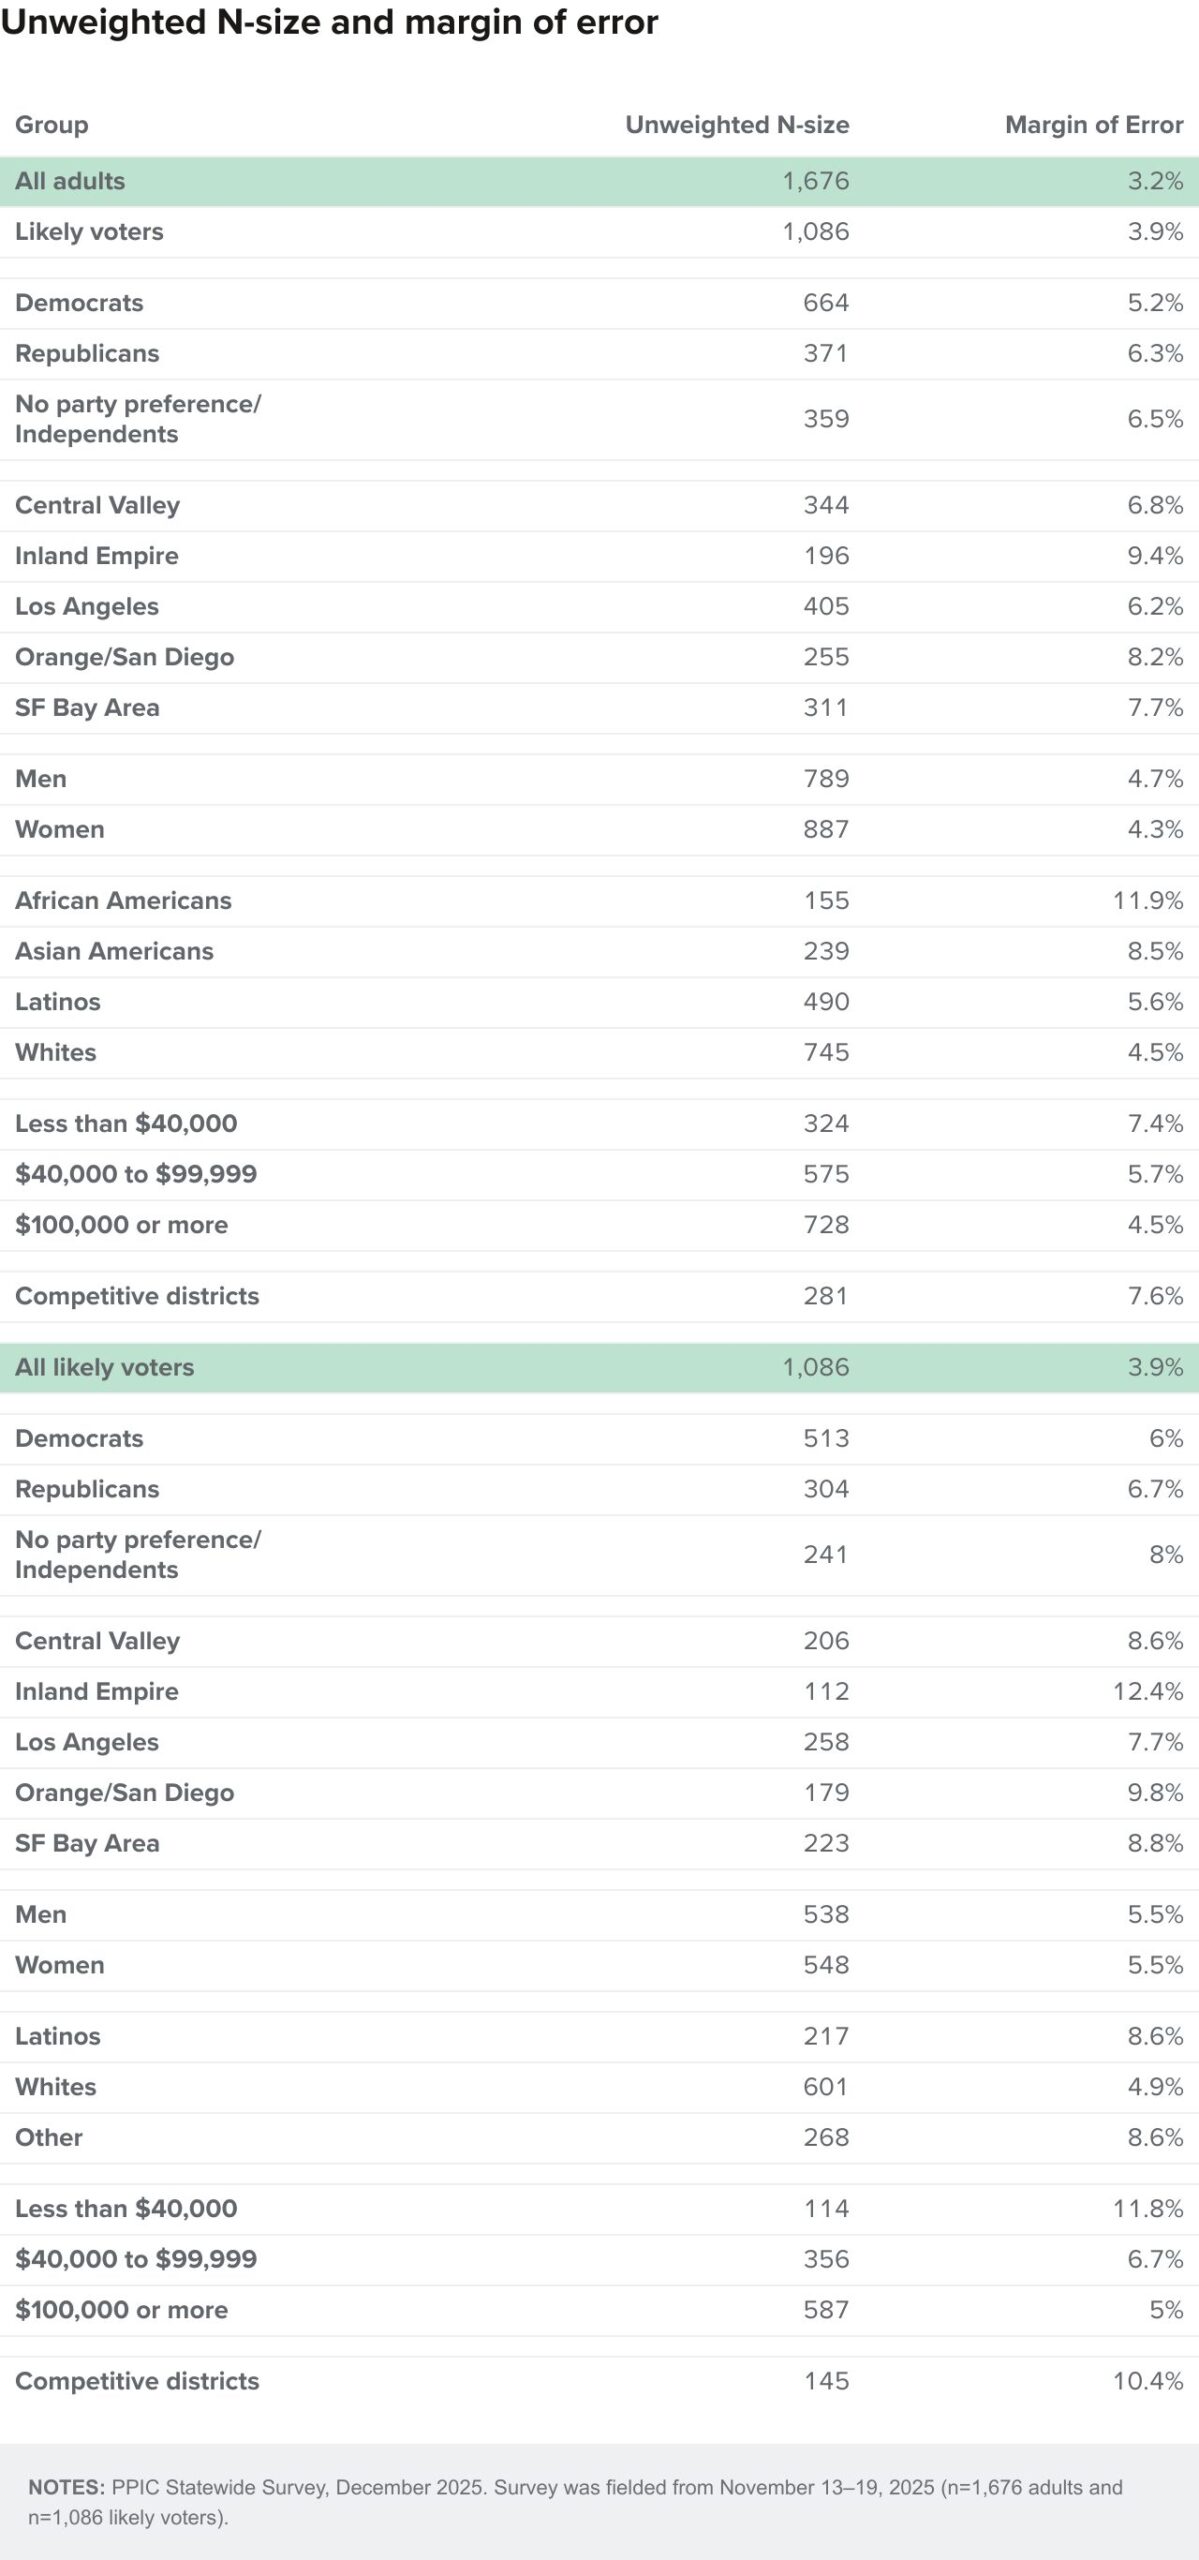
These are the key findings of the Californians and Their Government survey on the federal policy landscape, the California June primary, national issues, and state issues conducted from November 13–19, 2025:
- Twenty-five percent of Californians and 29 percent of likely voters approve of the job performance of President Donald Trump. Two in ten adults and likely voters approve of the way the US Congress is handling its job. Three in ten adults and likely voters approve of the way the US Supreme Court is handling its job. Majorities disapprove of the job that ICE is doing and approve of the protests against ICE actions. Six in ten oppose the deployment of National Guard troops to a major city in the state. Seven in ten favor the extension of federal tax credits on health insurance that are set to expire at the end of the year. Majorities of likely voters think that passing Proposition 50 will be mostly a good thing for California and that this election was worth the cost—though partisans are divided.
- Fifty-six percent of likely voters say they are more enthusiastic than usual about voting in the congressional election next November. Pluralities say it is better if one party controls the White House and the other party controls Congress. About six in ten say the election outcome they prefer is a Congress controlled by Democrats, that they lean toward voting for the Democratic candidate in their local congressional race, and that they prefer to elect someone with experience in politics. Katie Porter (D) is leading in the June gubernatorial primary, while 40 percent say they are not satisfied with the choices of candidates. Forty-nine percent say they prefer statewide candidates with experience and proven track records, and 45 percent want the next governor to continue Newsom’s policies.
 When asked about the most important problem facing the US today, Californians most often name political extremism or threats to democracy, followed by economic conditions. About three in four say that things in the US are generally going in the wrong direction and think the US economy will have bad times during the next 12 months. Forty-six percent say they are very concerned about the price of food and consumer goods in the US today, and 74 percent think the US will have widespread unemployment or depression in the next five years. About seven in ten are not too or not at all satisfied with the way the US democracy is working and are pessimistic that Americans with different political views can still come together and work out their differences.
 Californians name the cost of living and economic conditions as the most important issue facing the state today. About half think that California is generally going in the wrong direction and 71 percent say California will have bad times financially during the next 12 months. About two in three adults say that housing affordability is a big problem in their part of California and 45 percent say that housing costs are a financial strain on them. About three in four are less comfortable making a major purchase, like a home or car, or household purchases now than they were six months ago. Majorities of adults (54%) and likely voters (56%) approve of the job performance of Governor Gavin Newsom.
 Californians name the cost of living and economic conditions as the most important issue facing the state today. About half think that California is generally going in the wrong direction and 71 percent say California will have bad times financially during the next 12 months. About two in three adults say that housing affordability is a big problem in their part of California and 45 percent say that housing costs are a financial strain on them. About three in four are less comfortable making a major purchase, like a home or car, or household purchases now than they were six months ago. Majorities of adults (54%) and likely voters (56%) approve of the job performance of Governor Gavin Newsom.
Federal Policy Landscape
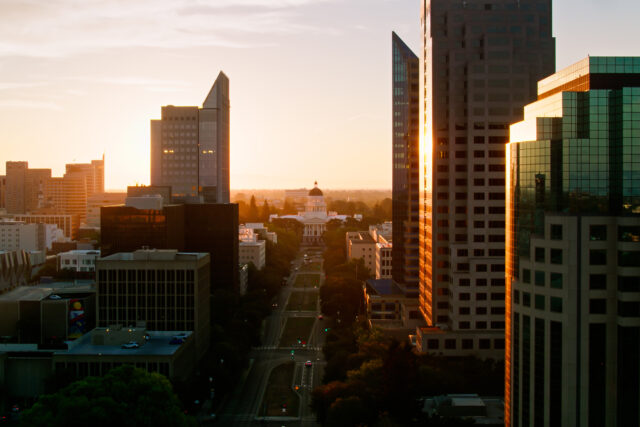
The longest federal government shutdown in US history ended with the US Congress passing a budget bill that President Trump signed into law on November 12. Executive actions continue to include tariffs, increased federal immigration enforcement, and ongoing and pending deployment of National Guard troops in US cities. The US Supreme Court issued emergency orders on federal funding for the SNAP food program and heard arguments on tariffs imposed by executive orders. In California, Proposition 50 passed easily, and the political focus now turns to the 2026 midterm election.
Proposition 50 outcome. Sixty-four percent of California voters chose “yes” on Proposition 50, which was titled “Authorizes Temporary Changes to Congressional District Maps in Response to Texas’ Partisan Redistricting,” in the November 4 special statewide election. In the aftermath, 62 percent of likely voters say that passing Proposition 50 will be “mostly a good thing” for California (38% “mostly a bad thing”). Fifty-six percent of likely voters think this election was worth the cost (43% not worth the cost). Partisans are divided, and most likely voters who disapprove of President Trump think passing Proposition 50 will be mostly a good thing for California (86%) and that the election was worth the cost (71%). But 51 percent of likely voters think it is a “bad idea” for the governor and legislature to make the decisions about congressional redistricting (47% good idea).
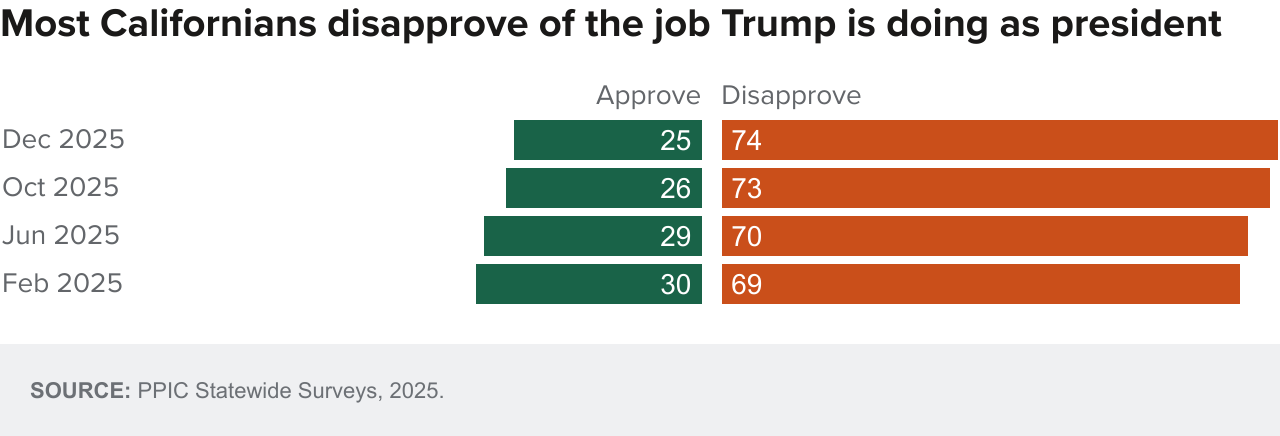
President. Donald Trump’s approval rating stands at 25 percent among California adults and 29 percent among likely voters. Approval of the president’s handling of the job was similar at the start of his second term. Today, 4 percent of Democrats, 79 percent of Republicans, and 21 percent of independent voters approve of the president. Fewer than four in ten across the state’s regions and across age, education, gender, income, and racial/ethnic groups approve of the president’s job performance. The president’s approval rating is higher in national polls.
US Congress. Eighteen percent of California adults and 19 percent of likely voters approve of the way that the US Congress is handling its job. Approval ratings for Congress have been similar throughout our 2025 surveys. Fewer than 30 percent of adults have approved of Congress since February 2023. Today, 6 percent of Democrats, 49 percent of Republicans, and 16 percent of independents approve of the way that Congress handles its job. Fewer than one in four approve of Congress in House districts held by either Democrats (17%) or Republicans (23%). Fewer than one in four adults across demographic groups and state regions approve of the way that the US Congress is handling its job. Americans’ approval of Congress is similar in national polls.

Thirty-four percent of California adults and 42 percent of likely voters approve of the way their own representative to the US House of Representatives is handling the job. Californians‘ approval ratings were similar in our June survey (40% adults, 47% likely voters). Today, 42 percent of Democrats, 36 percent of Republicans, and 34 percent of independents approve of their own House representative. Four in ten or fewer across state regions and demographic groups approve of the way their own House representative is handling the job.
Supreme Court. Twenty-nine percent of California adults and 31 percent of likely voters approve of the way the US Supreme Court is handling its job. Californians’ approval was similar in our June 2025 survey (31% adults, 32% likely voters) and in our September 2024 survey (31% adults, 31% likely voters). By comparison, approval was higher in January 2017, when 57 percent of California adults and 53 percent of likely voters approved of the Supreme Court. Today, about one in three or fewer across demographic groups and regions approve of the way the Supreme Court is handling its job, while partisans are divided (12% Democrats, 67% Republicans, 28% independents). The approval rating of the US Supreme Court is higher in national polls.
US immigration policies. Seventy-two percent of adults and 67 percent of likely voters disapprove of the job the US Immigration and Customs Enforcement agency (ICE) is doing. Disapproval of ICE was similar in our October survey (71% adults, 65% likely voters). Today, majorities disapprove of the job that ICE is doing across age, education, gender, income, and racial/ethnic groups (83% Latinos, 81% African Americans, 78% Asian Americans, 59% whites), while partisans are divided (94% Democrats, 21% Republicans, 72% independents). Moreover, 58 percent of adults and 59 percent of likely voters say they strongly approve or somewhat approve of recent protests against ICE actions. This includes half or more across demographic groups and across most state regions. Partisans are divided on this issue (82% Democrats, 19% Republicans, 58% independents).
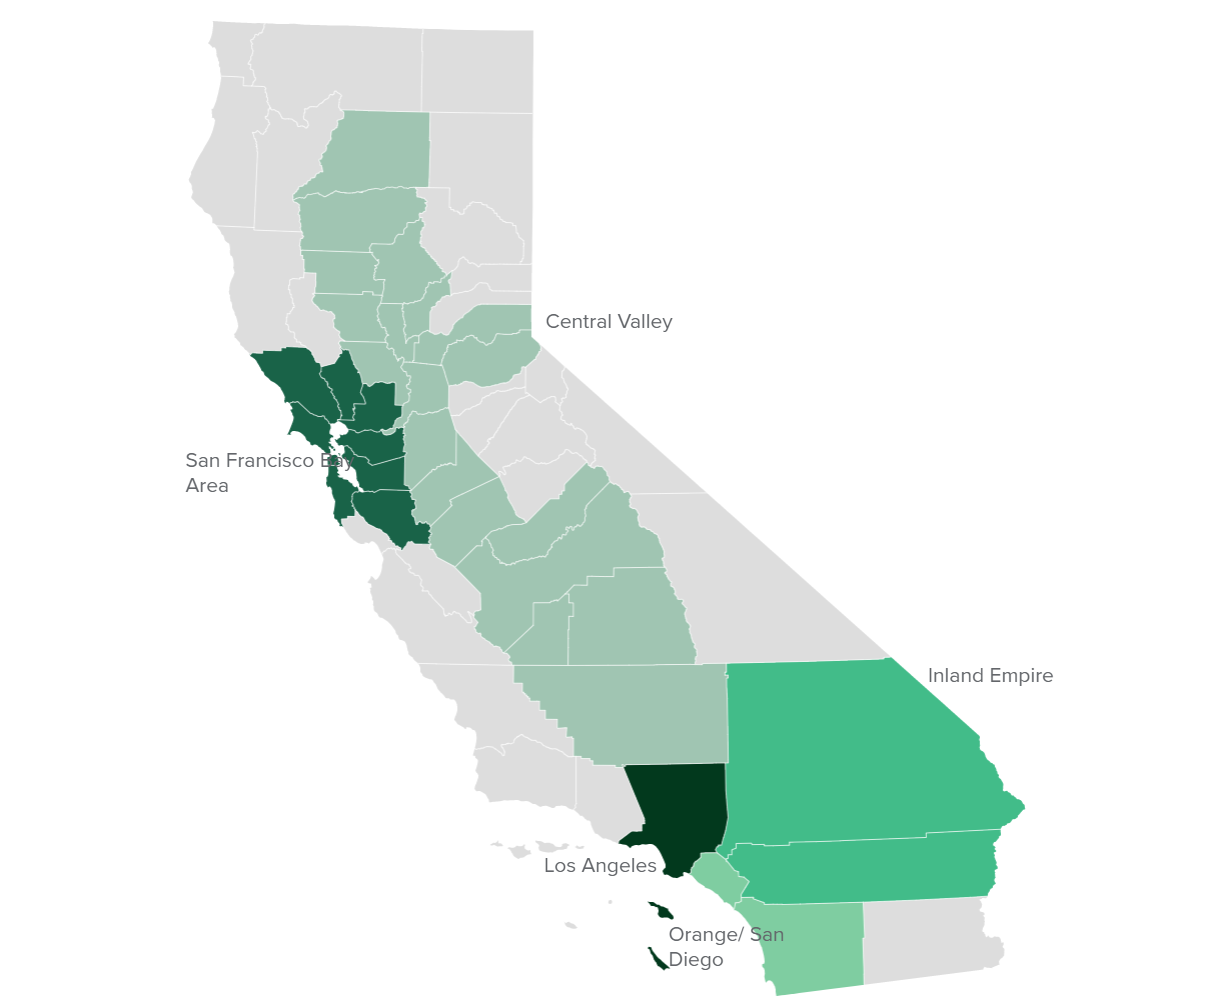
National Guard troops. About six in ten Californians (68% adults, 66% likely voters) say they strongly oppose or somewhat oppose deploying National Guard troops for law enforcement efforts in a city in their state. Majorities across demographic groups and regions (59% Central Valley, 64% Inland Empire, 70% Los Angeles, 70% Orange/San Diego, 79% San Francisco Bay Area) are opposed to this use of National Guard troops, while partisans are divided (91% Democrats, 19% Republicans, 72% independents). A recent national survey found about half of Americans opposed deploying National Guard troops to a city in their state for law enforcement purposes.
Federal tax credit for health insurance. Overwhelming majorities of Californians (70% adults, 70% likely voters) think that Congress should extend the enhanced tax credits available to some people who purchase health insurance through the Affordable Care Act that are set to expire at the end of 2025. Six in ten or more across demographic groups and state regions hold this view, while partisans are divided (89% Democrats, 33% Republicans, 68% independents). A recent national survey found a similar share of Americans holding this view. The federal government shutdown ended with the passage and signing of a budget bill to fund the federal government through January 30, 2026, that did not include an extension of these federal tax credits.

California Primary
With about six months to go before the June 2026 California gubernatorial “top two” primary election, just over a third of likely voters are following news about the gubernatorial candidates very (11%) or fairly (25%) closely. By comparison, about one-quarter of likely voters were paying this much attention in December 2017 ahead of the 2018 primary. Today, interest is particularly high in the Inland Empire (48%) and the Central Valley (46%). About half of Republicans (49%) are paying close attention, compared to fewer Democrats (34%) and independents (26%). A majority of likely voters (55%) say they are satisfied with their choices of candidates for next June’s gubernatorial primary, while 40 percent are not satisfied and 5 percent are unsure. Democrats (60%) are more likely than Republicans (53%) and independents (47%) to express satisfaction. Majorities across most regions are satisfied; the San Francisco Bay Area (44%) is the exception.
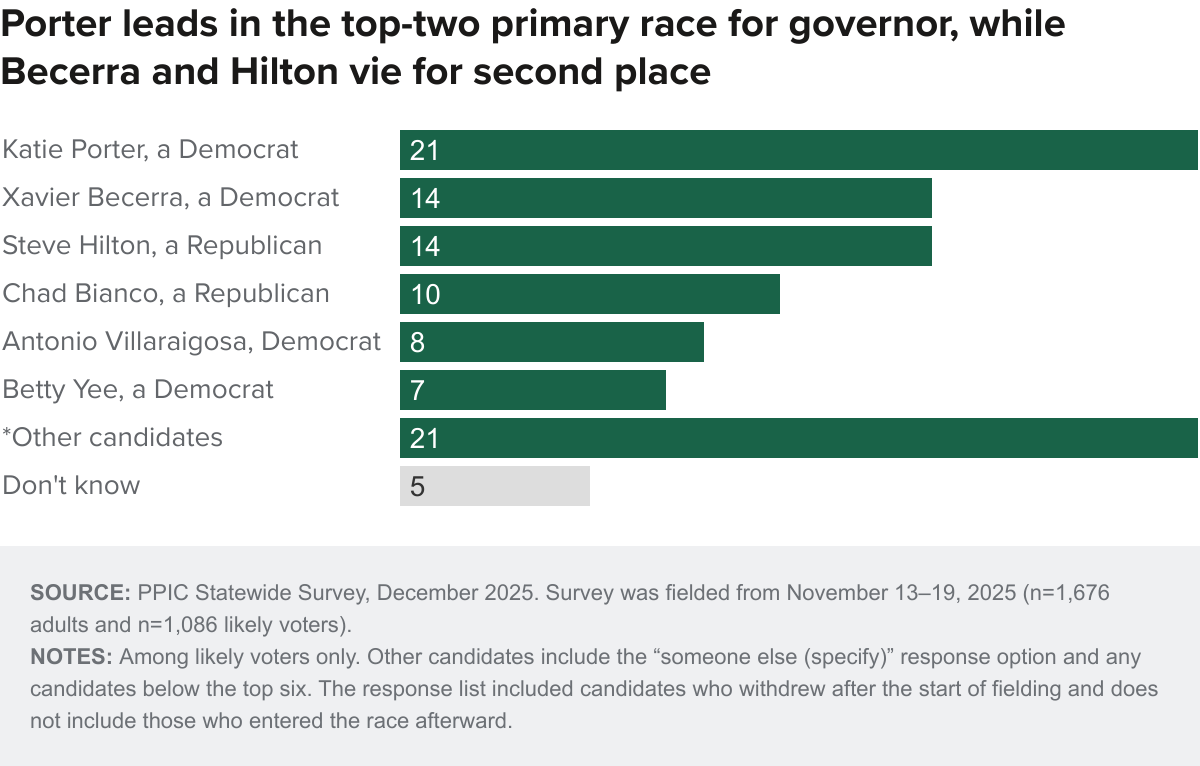
When asked to choose from a list of 16 candidates in mid-November (before several additional candidates had entered the gubernatorial race), about one in five likely voters said they would vote for Democrat Katie Porter. Republican Steve Hilton and Democrat Xavier Beccera are tied for second place at 14 percent. One in ten or fewer support Republican Chad Bianco, Democrat Antonio Villaraigosa, or Democrat Betty Yee.
Among Democratic likely voters, Porter leads Becerra by 10 points (32% to 22%), while among Republicans Hilton leads Bianco by 16 points (41% to 25%). Independents prefer Porter (20%) and Becerra (12%) over other candidates. Porter holds a significant lead among likely voters in Orange/San Diego, while Bianco has a similar advantage in the Inland Empire. In other major regions, there is no clear frontrunner.
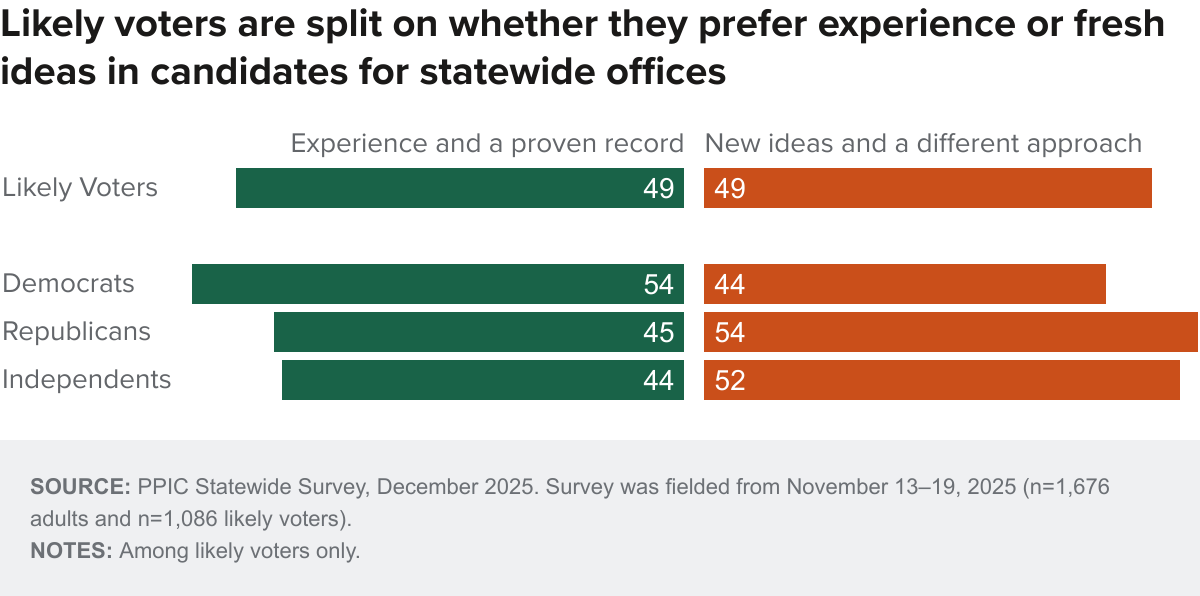
Likely voters are evenly divided on which of two sets of qualities matter most in a candidate for statewide office: new ideas and a different approach, or experience and a proven record. Democratic likely voters (54%) lean toward experience and a proven record, while Republicans and independents lean toward new ideas. Preferences are nearly evenly split across regions and demographic groups, with the exception of residents earning less than $40,000: 57 percent of this group favor a fresh approach.
A majority of likely voters (54%) would prefer the next governor to pursue policies different from those of Governor Newsom, while 45 percent would prefer a continuation of his policies. Nine in ten Republicans (94%) and a majority of independents (56%) want to see new policies, while seven in ten Democrats (69%) want to see a continuation of Newsom’s policies. Six in ten in the Central Valley and the Inland Empire and a slim majority (52%) in Los Angeles prefer a break from Newsom’s policies. A slim majority (51%) in the San Francisco Bay Area prefer Newsom’s policies be continued; and Orange/San Diego likely voters are evenly split. Older likely voters (58%) are more likely than those ages 18 to 44 (46%) to prefer a change in direction, as are white likely voters (63%) compared to Latinos (43%) and those of other racial and ethnic backgrounds (46%).
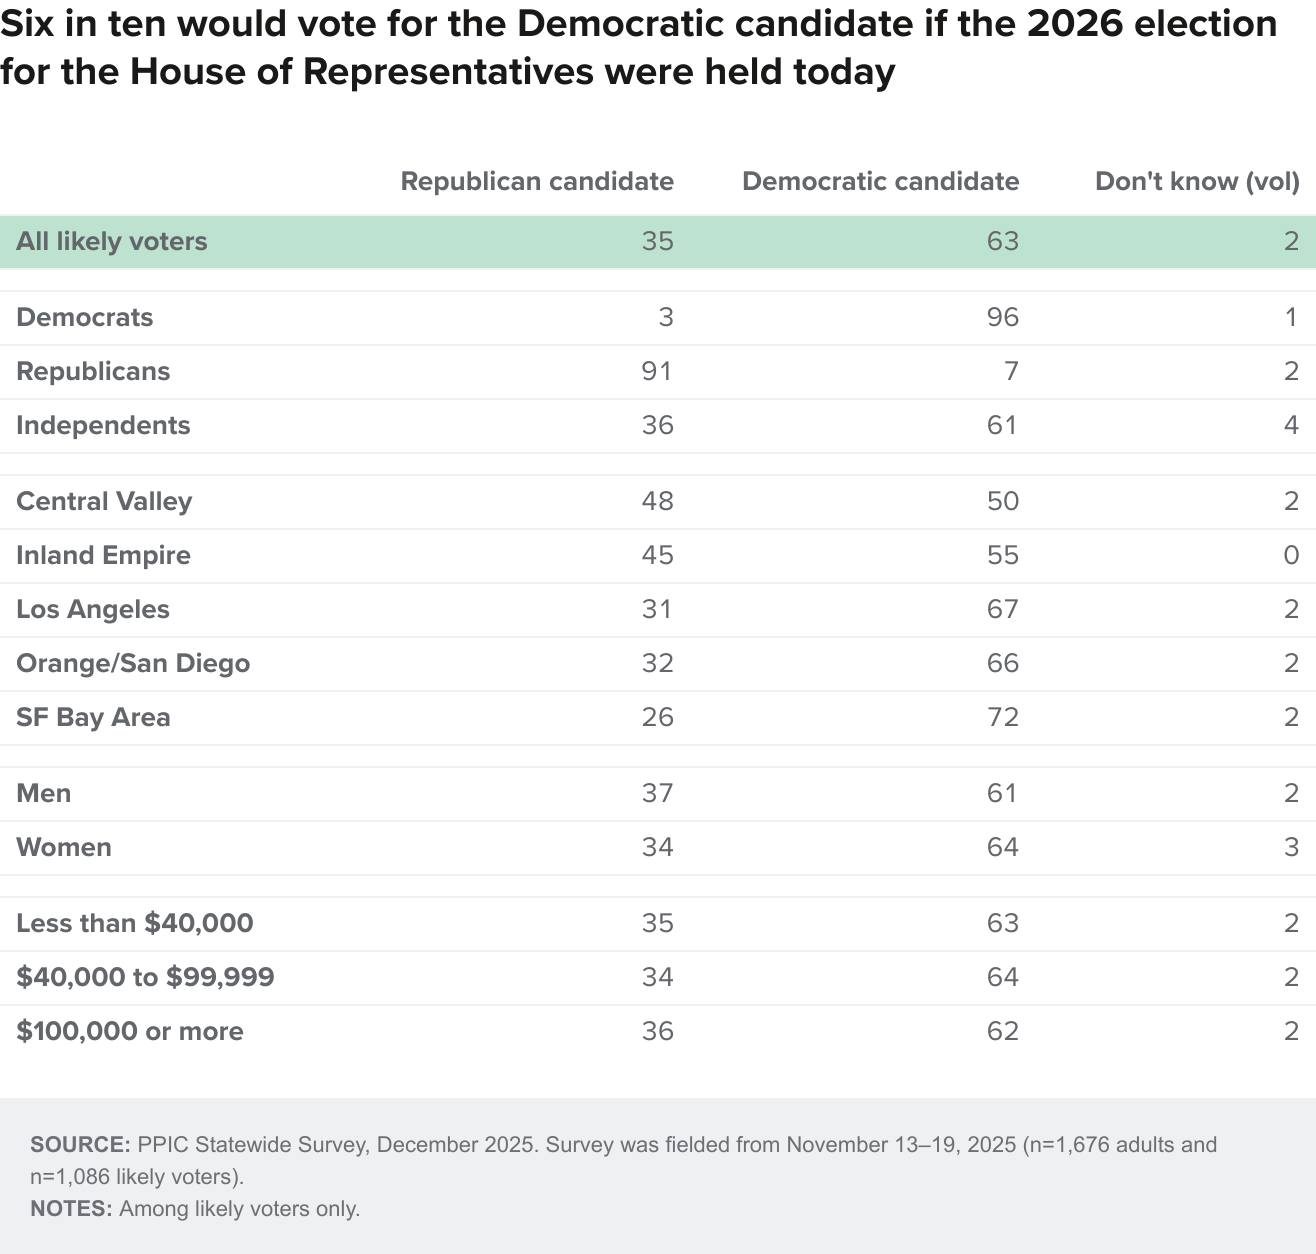
Turning to national elections, if the 2026 election for the US House of Representatives were held today, 63 percent of likely voters say they would vote for or lean toward the Democratic candidate, while 35 percent would vote for or lean toward the Republican candidate. These shares were similar when we asked about the 2024 House elections. Half or more across the state’s major regions and across demographic groups would vote for the Democratic candidate. Since October 2024, likely voters in Orange/San Diego have shifted significantly toward the Democratic candidate (from 52% in October 2024 to 66% in December 2025), while other major regions show no significant change.
Partisans remain firmly aligned: 91 percent of Republicans and 96 percent of Democrats would vote for their party’s House candidate. Independents prefer the Democratic candidate by a 25 point margin, up from an 11 point margin in October 2024.
A majority (56%) of likely voters say they are more enthusiastic than usual about voting in congressional elections next November. Seventy-two percent of Democratic likely voters are more enthusiastic, compared to 38 percent of Republicans and 46 percent of independents. About six in ten likely voters prefer Congressional candidates with political experience (58%), while about four in ten prefer candidates who are new to politics (39%). Seven in ten Democrats (71%) prefer experience, while half of Republicans (50%) and independents (51%) prefer newcomers. Majorities across regions and demographic groups prefer congressional candidates with political experience.
A solid majority of likely voters (65%) say their preferred outcome next year is a Congress controlled by Democrats, while 34 percent prefer a Congress controlled by Republicans. Nearly nine in ten Republicans (88%) prefer a Congress controlled by Republicans. Nearly all Democrats (96%) and two in three independents (66%) want a Democratic Congress. Majorities across regions and demographic groups prefer this outcome. A plurality of likely voters (44%) say it is better if one party controls the White House and the other party controls Congress, while three in ten say it is better when the president’s party controls Congress (29%) and a quarter think it doesn’t matter too much (25%). A majority of Democratic likely voters prefer split control, while half of Republicans (50%) prefer Congress to be aligned with the president’s party and independents are mixed.
National Issues
Overwhelming majorities of California adults and likely voters say the US is generally headed in the wrong direction (adults: 77%, 22% right direction; likely voters: 74% wrong direction, 26% right direction). The share of adults saying the wrong direction has remained similar since the beginning of this year. Today, Democrats (93%) and independents (79%) are more likely than Republicans (36%) to say the country is headed in the wrong direction. Seven in ten or more across demographic and regional groups say the country is headed in the wrong direction. Californians are most likely to say that the most important issue facing the US is political extremism (32%), followed by jobs and the economy (26%) and immigration (12%). Views among likely voters are similar (39% political extremism, 23% jobs and the economy, 10% immigration).
Thinking about economic conditions in the US, about three in four California adults (75%) and likely voters (73%) say the country will have bad times financially during the next 12 months (good times: 23% adults, 26% likely voters). Seven in ten or more adults have expected bad financial times since the beginning of the year. Partisan views today are split, with most Democrats (92%) and independents (77%) saying there will be bad financial times and most Republicans (60%) saying there will be good times ahead. Seven in ten or more across demographic and regional groups expect bad financial times in the next year. Adding to that sentiment, about seven in ten adults (74%) and likely voters (69%) expect periods of widespread depression or unemployment over the next five years; far fewer expect mostly good times (24% adults, 28% likely voters).
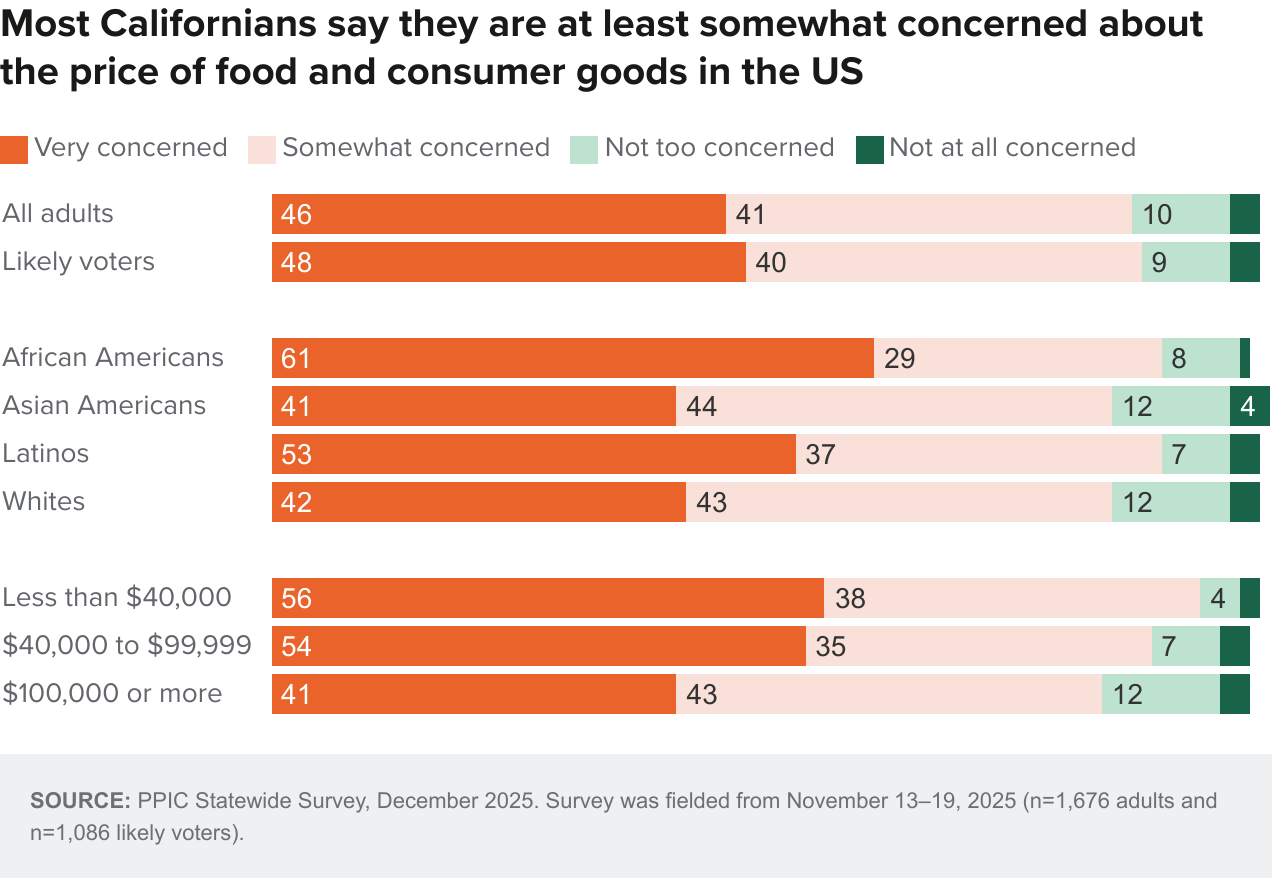
When it comes to the price of food and consumer goods in the country today, nearly nine in ten Californians say they are very or somewhat concerned. While overwhelming majorities across partisan groups express concern, Democrats are most likely to say they are very concerned (61%), followed by about four in ten independents (44%) and three in ten Republicans (31%). Four in ten or more across demographic and regional groups say they are very concerned about these prices. The shares saying this are highest among African Americans, Latinos, those earning less than $100,000, and residents in the Inland Empire.
When asked about the way democracy is working in the US, just three in ten adults (5% very, 23% somewhat) and likely voters (6% very, 23% somewhat) say they are satisfied; seven in ten say they are not too or not at all satisfied (adults: 40% not too satisfied, 31% not at all; likely voters: 38% not too satisfied, 33% not at all). Majorities have been dissatisfied since October 2022, but the share who are dissatisfied has reached a record high. Today, over eight in ten Democrats (84%) and seven in ten independents (70%) express dissatisfaction, while a majority of Republicans (55%) say they are at least somewhat satisfied. Asked how democracy in the US is working compared to five years ago, overwhelming majorities of California adults say it has gotten worse (24% a little worse, 47% a lot worse).
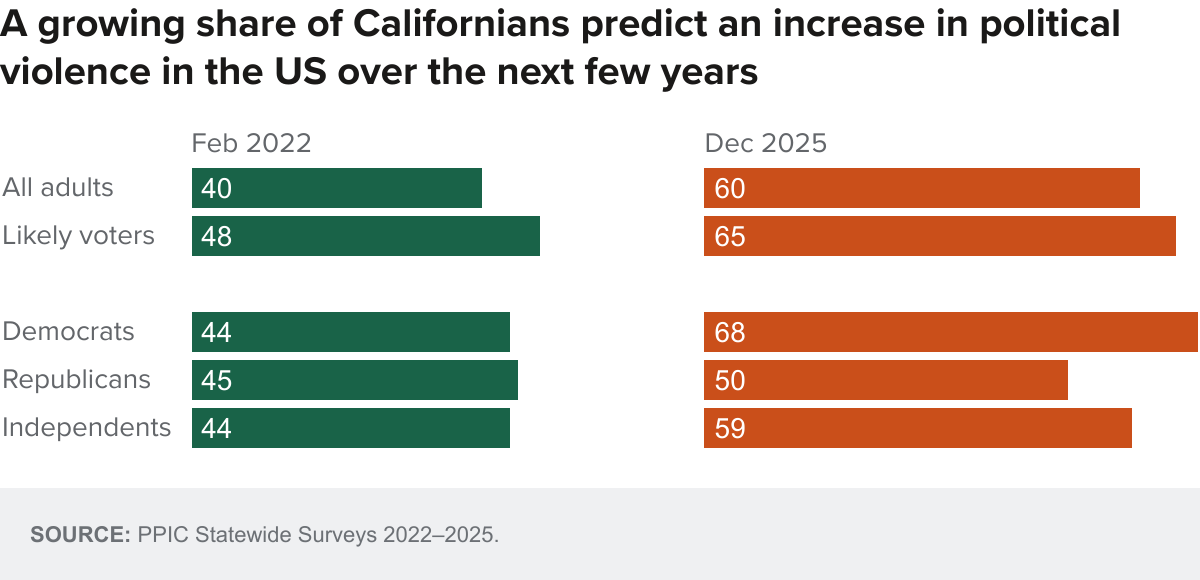
In the context of a tense political climate across the nation, the proportion of Californians who expect an increase in political violence in the US over the next few years has grown by 20 percentage points since February 2022. Today, six in ten adults and about two in three likely voters think they will see an increase in political violence in the US over the next few years; about three in ten say there will be the same amount there already is, and very few say there will be a decrease. Majorities of independents and Democrats predict an increase in political violence, as do half of Republicans. Majorities across most demographic and regional groups predict an increase, with this share increasing with rising education and income.
Californians are pessimistic about whether Americans with different political views can still come together and work out their differences. Today, three in four or more adults and likely voters say they are pessimistic, including most Democrats, Republicans, and independents. The share of adults who are pessimistic has increased from a year ago (63% in December 2024). While three in four or more across demographic groups are pessimistic, shares are highest among Asian Americans, college graduates, adults earning over $100,000, and residents in the San Francisco Bay Area and Orange/San Diego.

State Issues
Californians continue to see the economy, cost of living, and inflation (36%) as the most important issue facing the people of California and this has been the top issue since 2023. Fewer Californians choose housing cost or availability (13%) or government in general, problems with elected officials or parties (10%). Notably, the economy is the top issue for Californians across parties, regions, and demographic groups.
About seven in ten Californians (71%) think the state will have bad economic times in the next 12 months. Economic pessimism is widespread, with more than six in ten across parties, regions, and demographic groups expecting bad economic times. Californians are more optimistic when asked about the direction the state is headed in, although views are divided (48% right direction, 51% wrong direction). It’s noteworthy that while partisans are similarly pessimistic about the economy, they are divided on whether the state is headed in the right direction (74% Democrats, 44% independents, 10% Republicans). There is also variation across the state’s regions (right direction: 57% San Francisco Bay Area, 51% Los Angeles, 46% Orange/San Diego, 45% Inland Empire, 38% Central Valley).
Since housing costs and availability have been a top issue for Californians for many years, we asked Californians how much of a problem housing affordability is in their part of California. Nearly all Californians see this as a problem, with two in three saying it is a big problem (65%) and three in ten saying it is somewhat of a problem (31%). Just 4 percent say housing affordability is not a problem. The view that housing affordability is a big problem is widely held by six in ten or more across parties, regions, and demographic groups.
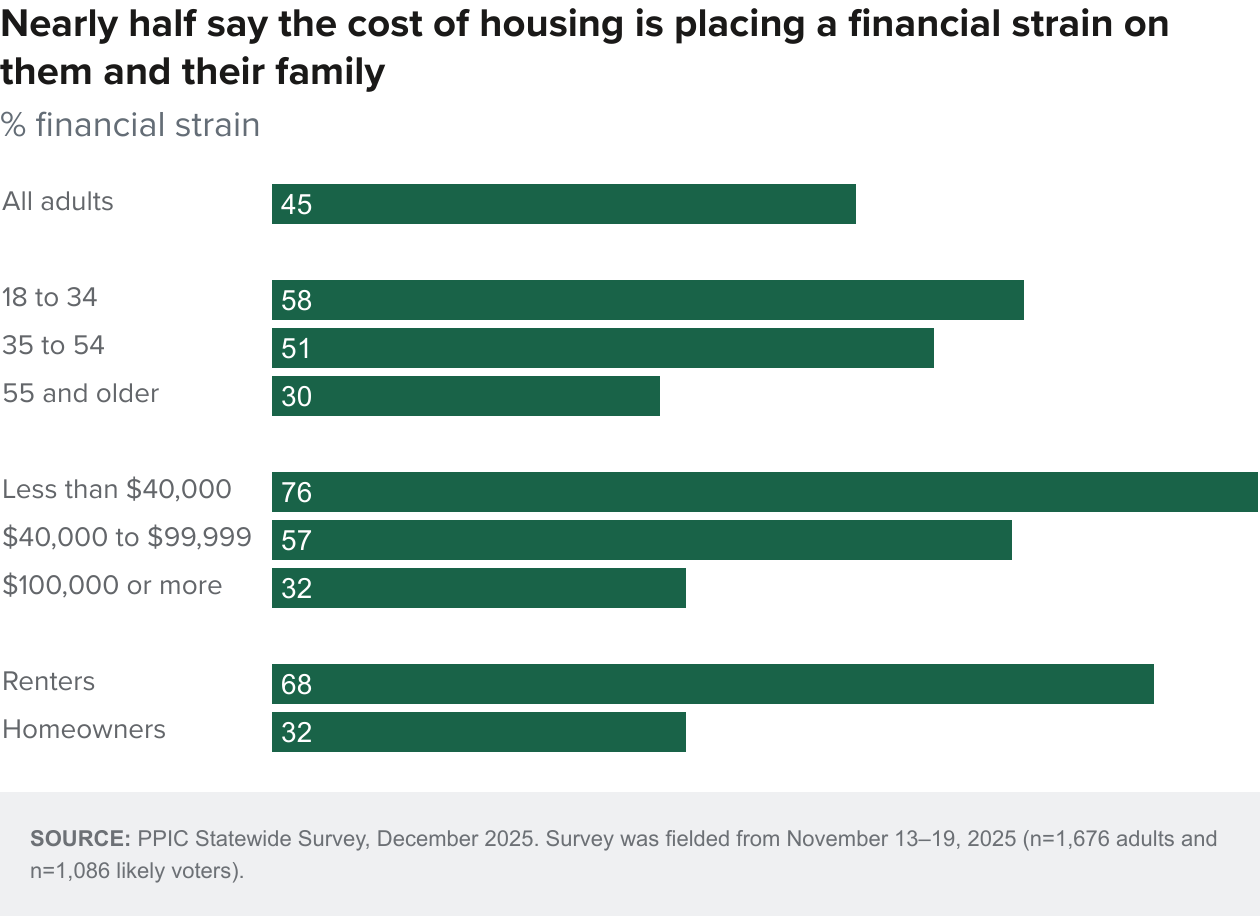
Turning to the financial impact of housing costs, more than four in ten Californians say the cost of housing places a financial strain on them and their families (25% a lot, 20% a little). Residents in the Inland Empire (52%) are the most likely to say they feel this strain, followed by those in Los Angeles (48%), the San Francisco Bay Area (45%), the Central Valley (43%), and Orange/San Diego (39%). Renters (68%) are more than twice as likely as homeowners (32%) to say the cost of housing places financial strain on them. Three in four earning less than $40,000 say housing costs create strain, including more than half (57%) who report feeling a lot of strain. African Americans (58%) and Latinos (56%) are far more likely than Asian Americans (39%) and whites (33%) to say housing costs put a financial strain on them and their families.
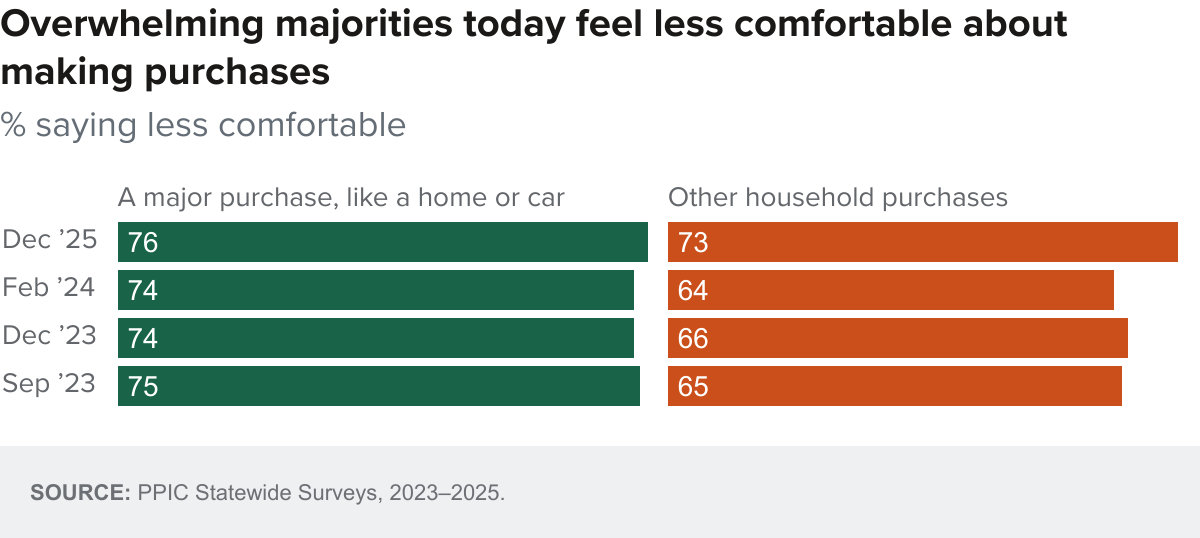
Given that inflation has cooled off from the highs of a few years ago, but remains elevated, we asked Californians how they feel about making purchases today compared to six months ago. Overwhelming shares of adults are less comfortable making a major purchase, such as a home or car (76%), or making other household purchases (73%). In February 2024, the share saying they were less comfortable making a major purchase (74%) was nearly identical, but the share who are less comfortable making other household purchases has increased by 9 points. Notably, this is the smallest gap between comfort in making a major purchase and making other household purchases since we first asked this question in 2023.
Today, two in three or more across parties, regions, and demographic groups are less comfortable about making a major purchase. This share is similar across parties and regions, while it declines with rising education and income. Six in ten or more across parties, regions, and demographic groups are also less comfortable about making other household purchases. Once again, this share is similar across parties and regions, while it declines with rising education and income.
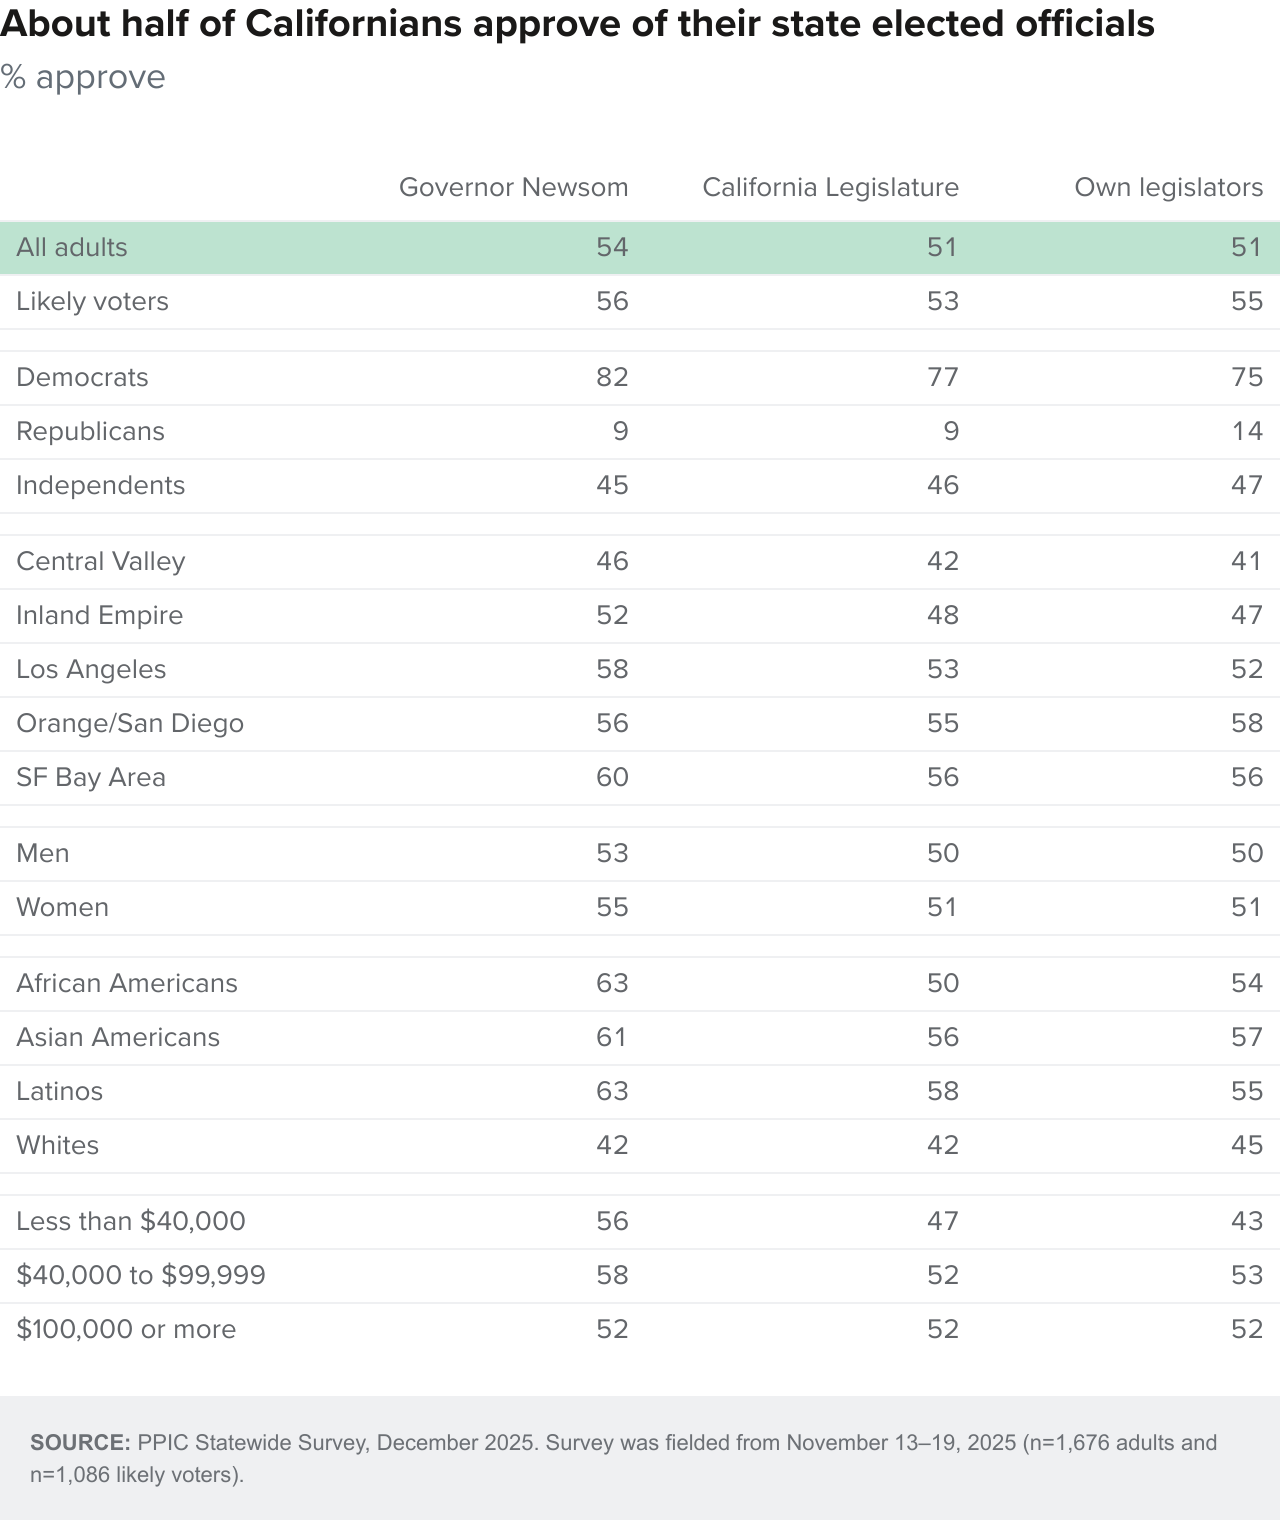
In the wake of Proposition 50 passing, how do Californians feel about state elected officials? About half of adults and likely voters approve of Governor Newsom (54% adults, 56% likely voters), the state legislature (51% adults, 53% likely voters), and state legislators representing their assembly and senate districts (51% adults, 55% likely voters). Approval of the governor and legislature was similar among adults in October (54% Governor Newsom, 49% legislature), while the share approving of their state legislators has increased 8 points since June (43%).
Overwhelming shares of Democrats approve of the governor, state legislature, and their own legislators; just under half among independents and about one in ten Republicans approve of all three. Across regions, residents in the San Francisco Bay Area, Orange/San Diego, and Los Angeles are more likely to approve of the governor, the legislature, and their own legislators than those in the Inland Empire or Central Valley. Notably, approval ratings for all three fall short of a majority among whites, while majorities of African Americans, Asian Americans, and Latinos approve of their state elected officials.
Topics
2026 Election Political Landscape Statewide Survey