Key Findings
California’s registered voters have received their June 2 primary ballots in the mail. The gubernatorial primary has generated high levels of interest because of the uncertainty about the top-two candidates who will move on to the general election in November. Meanwhile, the November ballot has been taking shape, with several citizens’ initiatives now eligible and a June 25 deadline looming for qualification and withdrawal. Governor Newsom released a May state budget revision for 2026–27 that proposes to use higher-than-expected revenues to cover future budget gaps. The US military action against Iran is in a ceasefire phase, while oil prices remain high. The US economy is sending mixed signals on consumer prices, jobs, bonds, and the stock market, while the AI boom is raising concerns about AI-related job layoffs in California.
These are the key findings of the Californians and Their Government survey on the 2026 elections, the state budget and taxes, state issues, and national issues that was conducted May 14–18, 2026:
- The leading candidates in the top-two gubernatorial primary are Xavier Becerra (D; 23%) and Steve Hilton (R; 20%) followed by Tom Steyer (D; 15%), Chad Bianco (R; 13%), and Katie Porter (D; 12%). Seven in ten likely voters are following the news about the governor’s race very or fairly closely. About six in ten say they are satisfied with the choice of candidates in the governor’s race and think that the top-two primary has been mostly a good thing for California since Proposition 14 passed in 2010. In local House races, 64 percent favor the Democratic candidate over the Republican candidate. Democratic likely voters are more enthusiastic than others about voting in the congressional election. Fifty-four percent would vote yes on a one-time state tax on taxpayers with assets over $1 billion.
- Forty-one percent of adults and 45 percent of likely voters think that the state budget situation is a big problem. Most name health and human services and public education as their preferred areas for state spending. Majorities would favor paying lower taxes and having a state government that provides fewer services. After reading a brief description of the governor’s proposed 2026–27 state budget, majorities of adults and likely voters support this plan. A plurality of Californians prefer to deal with the expected large gap between spending and revenues in the near future with a mix of spending cuts and tax increases. Fifty-seven percent of adults and 60 percent of likely voters favor raising the amount of state taxes paid by some of the largest corporations to help reduce this gap.
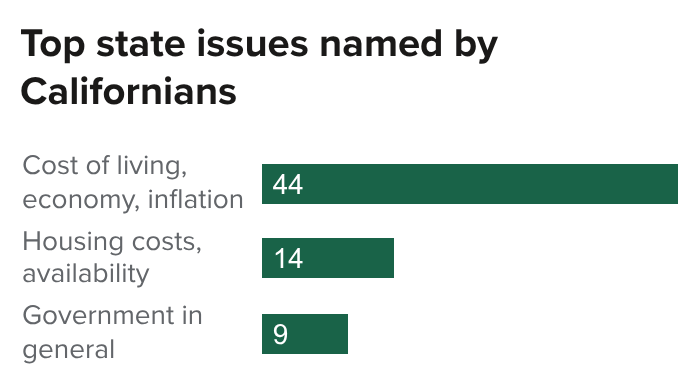 About half of Californians name the cost of living, inflation, and housing costs and availability as the most important issues facing California today. Majorities think that things in California are going in the wrong direction and that California will have bad times financially during the next 12 months. Fifty-four percent say that recent price increases have caused them financial hardships, 65 percent say that recent gasoline price increases have affected their financial situation, and 60 percent believe that the US military action in Iran will have a mostly negative impact on their financial situation. Fifty percent of adults and 54 percent of likely voters approve of the job performance of Governor Gavin Newsom.
 About half of Californians name political extremism or threats to democracy and economic conditions as the most important problems facing the US today. About eight in ten think things in the US are going in the wrong direction and that the US will have bad times financially during the next 12 months. About three in four adults and likely voters disapprove of the US military action against Iran, disapprove of the job that US Immigration and Customs Enforcement (ICE) is doing, and oppose new tariffs on goods imported from other countries. Majorities are opposed to ending the automatic granting of citizenship to children born in the US to undocumented immigrants. Twenty-four percent of adults and 30 percent of likely voters approve of the job performance of President Donald Trump.
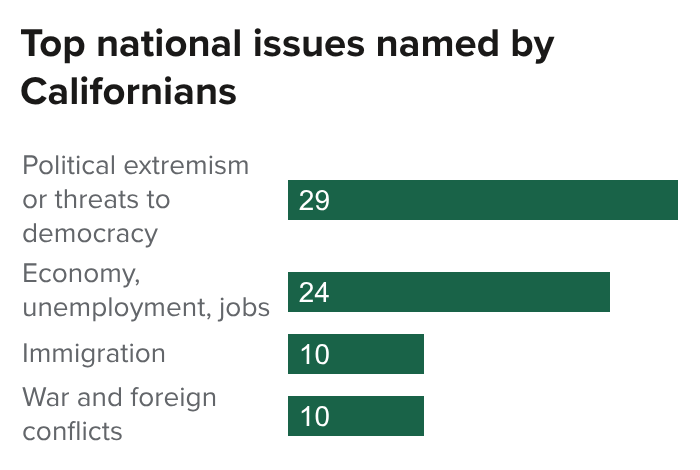 About half of Californians name political extremism or threats to democracy and economic conditions as the most important problems facing the US today. About eight in ten think things in the US are going in the wrong direction and that the US will have bad times financially during the next 12 months. About three in four adults and likely voters disapprove of the US military action against Iran, disapprove of the job that US Immigration and Customs Enforcement (ICE) is doing, and oppose new tariffs on goods imported from other countries. Majorities are opposed to ending the automatic granting of citizenship to children born in the US to undocumented immigrants. Twenty-four percent of adults and 30 percent of likely voters approve of the job performance of President Donald Trump.
2026 Elections
All of California’s registered voters have received mail ballots for the June 2 primary, and some ballots have already been returned. Voters will determine the top-two candidates for governor and other statewide candidates for office, as well as US House and state legislative candidates for the November 3 election. Meanwhile, several ballot initiatives have qualified for the general election ahead of a June 25 deadline for withdrawal or qualification.
Gubernatorial Primary. Five candidates in the top-two governor’s primary have double-digit support from likely voters: Xavier Becerra (D; 23%) and Steve Hilton (R; 20%) are in the lead, followed by Tom Steyer (D; 15%), Chad Bianco (R, 13%), and Katie Porter (D; 12%). Most Republicans support the two Republicans (53% Hilton, 33% Bianco), and most Democrats support the three Democrats (39% Becerra, 23% Steyer, 15% Porter); few partisans support a candidate outside of their party. Independents are divided among the top five candidates (20% Porter, 17% Hilton, 15% Becerra, 14% Bianco, 14% Steyer). Since our December survey, support has increased for Becerra (14% to 23%) and Hilton (14% to 20%).
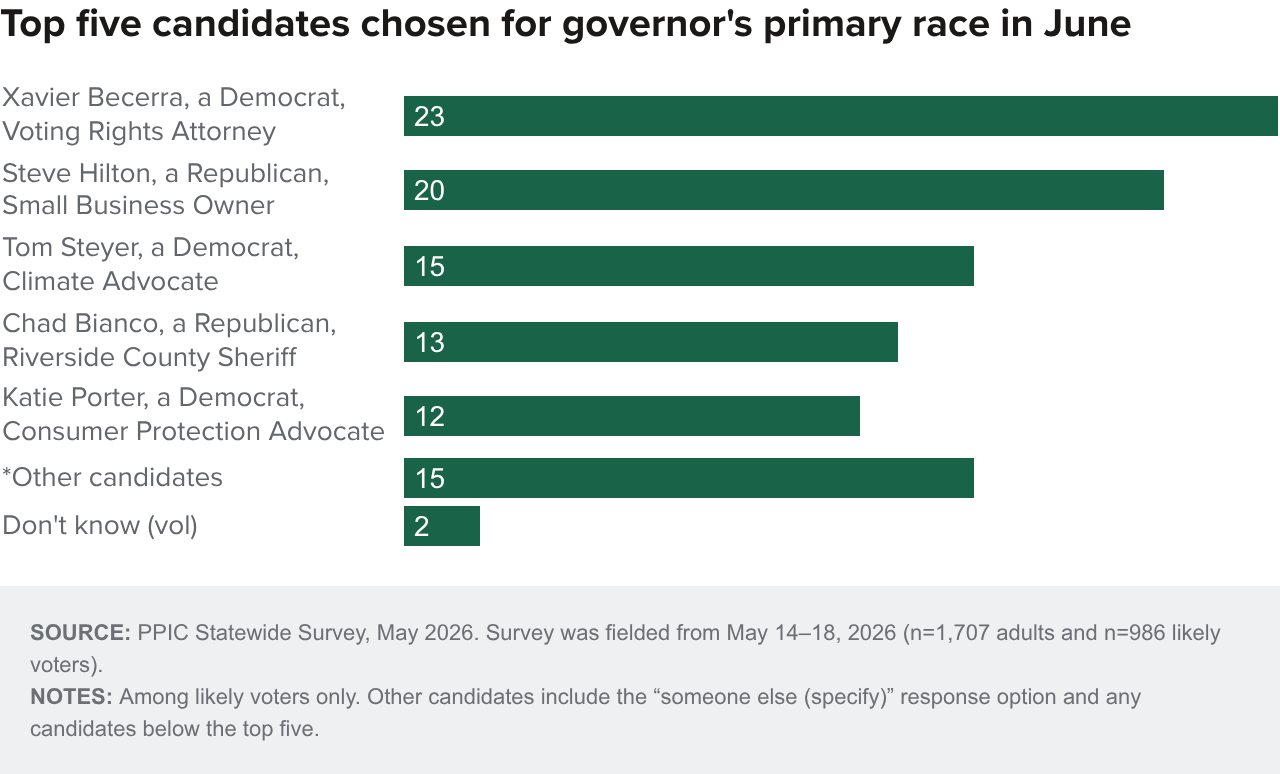
Seven in ten likely voters are very (23%) or fairly closely (48%) following the news about candidates for the 2026 governor’s election, including majorities across partisan groups (68% Democrats, 76% Republicans, 65% independents) and demographic groups and regions. Sixty-two percent are satisfied with the candidate choices in the governor’s race, including majorities across demographic groups and regions, while satisfaction levels vary among partisans (60% Democrats, 72% Republicans, 54% independents). A similar 59 percent think the top-two primary has been mostly a good thing for California since voters passed Proposition 14 in 2010, including about half or more across partisan and demographic groups and regions.
US House Races. California likely voters say they would vote for the Democratic candidate over the Republican candidate in their local House race by a 29 point margin (64% to 35%). The margins were similar in our December survey and our February survey. Today, few partisans say they would support a House candidate outside of their party, and two in three independents would vote for the Democratic candidate. About half or more across demographic groups would vote for the Democratic candidate, but shares holding this view vary by region.

With national attention focused on the 2026 midterms, 61 percent of likely voters say they are more enthusiastic about voting than usual in the congressional election (38% less enthusiastic). Majorities across demographic groups and state regions say they are more enthusiastic than usual about voting, but there is an “enthusiasm gap” across partisan groups (68% Democrats, 59% Republicans, 47% independents).
Sixty-five percent of likely voters are confident (24% very, 41% somewhat) that votes for congressional candidates will be accurately cast and counted across the country in this year’s election, including majorities across demographic groups and state regions and varying majorities across partisan groups (69% Democrats, 51% Republicans, 74% independents). A similar 66 percent say that they have confidence (43% great deal, 23% quite a lot) in the system in which votes are cast and counted in California elections; however, partisans differ sharply in their level of confidence in the state’s election system (87% Democrats, 25% Republicans, 70% independents).
State Ballot Measures. California voters will be asked to make policy choices about the state propositions on the November ballot. Likely voters are divided (49% yes, 51% no) over a citizens’ initiative that would establish additional voter identification and citizenship verification requirements, with sharp differences in partisan support (29% Democrats, 88% Republicans, 42% independents). A majority of likely voters favor (53% yes, 45% no) a citizens’ initiative to create a loan program for middle-income buyers of qualified homes; renters (72%) are more likely to support this measure than homeowners (47%).
Majorities of likely voters favor (54% yes, 45% no) a citizens’ initiative that would impose a one-time tax of up to 5 percent on taxpayers and trusts with covered assets valued over $1 billion. Likely voters’ support for this citizens’ initiative varies across partisan groups, as well as across state regions and age, gender, homeownership, and income groups.

State Budget and Taxes
Governor Newsom recently released a May revision to his January budget proposal, and the legislature has until June 15 to pass a balanced budget for 2026–27. As the governor and legislature negotiate, a majority of Californians and likely voters say they prefer to pay lower taxes and have a state government that provides fewer services rather than pay higher taxes and have a state government that provides more services. Findings were similar in PPIC Statewide Surveys conducted in February and last June (55% each lower taxes/fewer services). Preference for a smaller government is widespread: half or more across most parties, regions, and nearly all demographic groups hold this view. This view is less prevalent among Democrats (34%), African Americans (38%), renters (47%), those ages 18 to 34 (47%), and those with incomes of less than $40,000 (46%).

Looking beyond their preference for a smaller government, Californians think that health and human services (46%) and TK–12 education (39%) should be given the highest priority when it comes to state government spending.
Governor Newsom’s revised budget plan for the next fiscal year includes $246.6 billion in General Fund spending and no deficit. It is supported by a $16.5 billion increase in projected revenue since January, driven by capital gains from AI-related stock market gains. Newsom’s revised budget is balanced for both the 2026–27 and 2027–28 fiscal years, increases total budget reserves to $29.9 billion, and places $9.7 billion into the Surplus Holding Account. The budget proposes significant investment in TK–14 education (kindergarten through community college), modest increases in higher education funding, and expanded Covered California health insurance subsidies for working families earning up to twice the federal poverty level; it proposes reductions in Medi-Cal benefits primarily affecting seniors, disabled adults, and immigrants.
In this context, most Californians say the state budget situation—that is, the balance between government spending and revenues—is a big problem (41%) or somewhat of a problem (48%); about one in ten (9%) say it is not a problem. Likely voters hold similar views (45% big problem, 45% somewhat of a problem, 9% not a problem). Californians held similar views in February (43% big problem, 48% somewhat of a problem), when there was a $2.9 billion estimated shortfall, and last June (43% big problem, 49% somewhat of a problem), when the shortfall was $11.9 billion. Today, more than eight in ten across parties, regions, and demographic groups say the budget situation is a problem. However, it is noteworthy that Republicans (81%) are by far the most likely to call the budget situation a big problem; fewer than half of independents (42%) and Democrats (24%) hold this view.
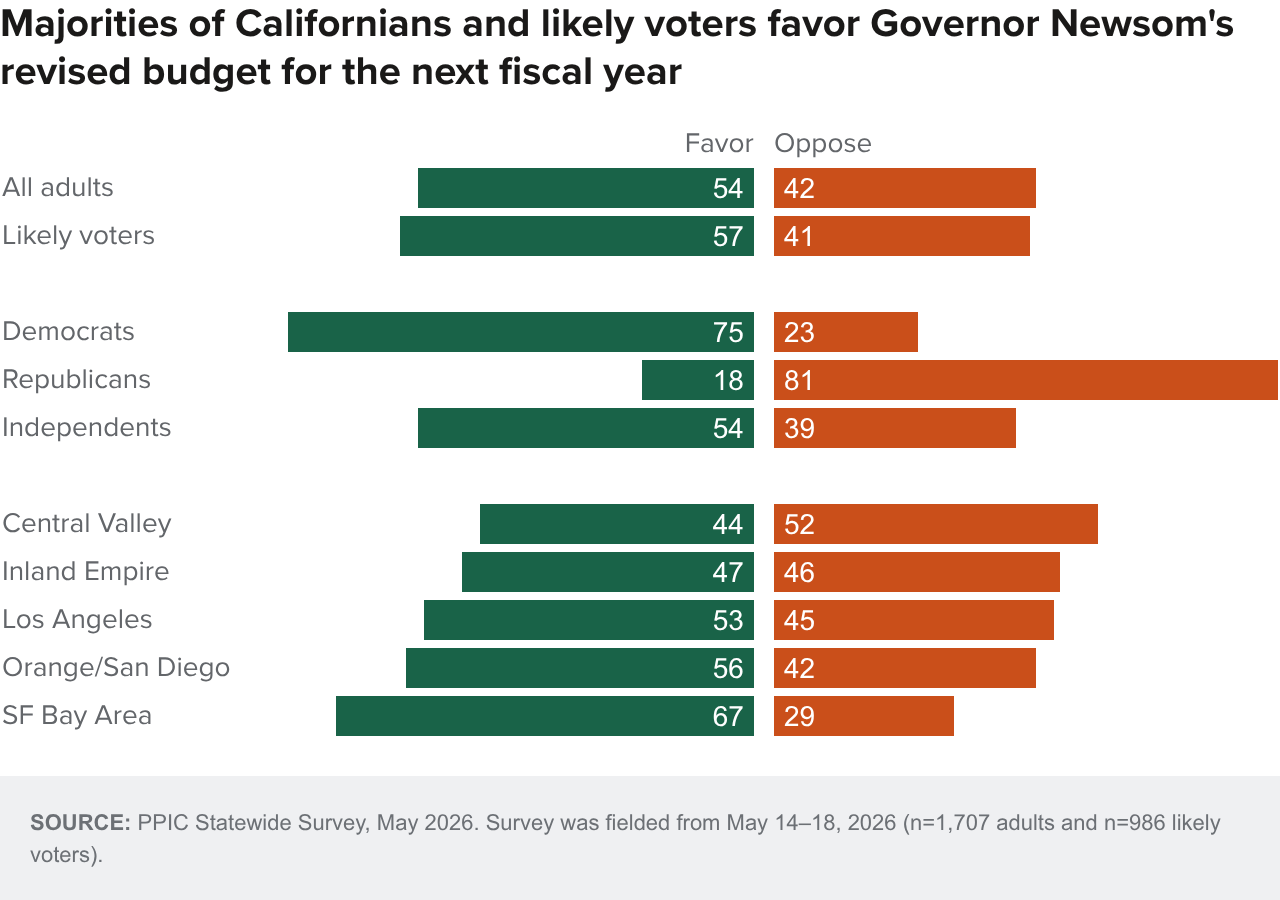
After reading a brief summary of the governor’s proposal, a majority of Californians and likely voters are in favor. Three in four Democrats and a majority of independents favor the revised plan, while most Republicans are opposed. Support is higher in the San Francisco Bay Area, Orange/San Diego, and Los Angeles than elsewhere in the state. Half or more across nearly all demographic groups are in favor of the plan, with the exception of those with a high school diploma or less (44%) and those 55 and older (48%).
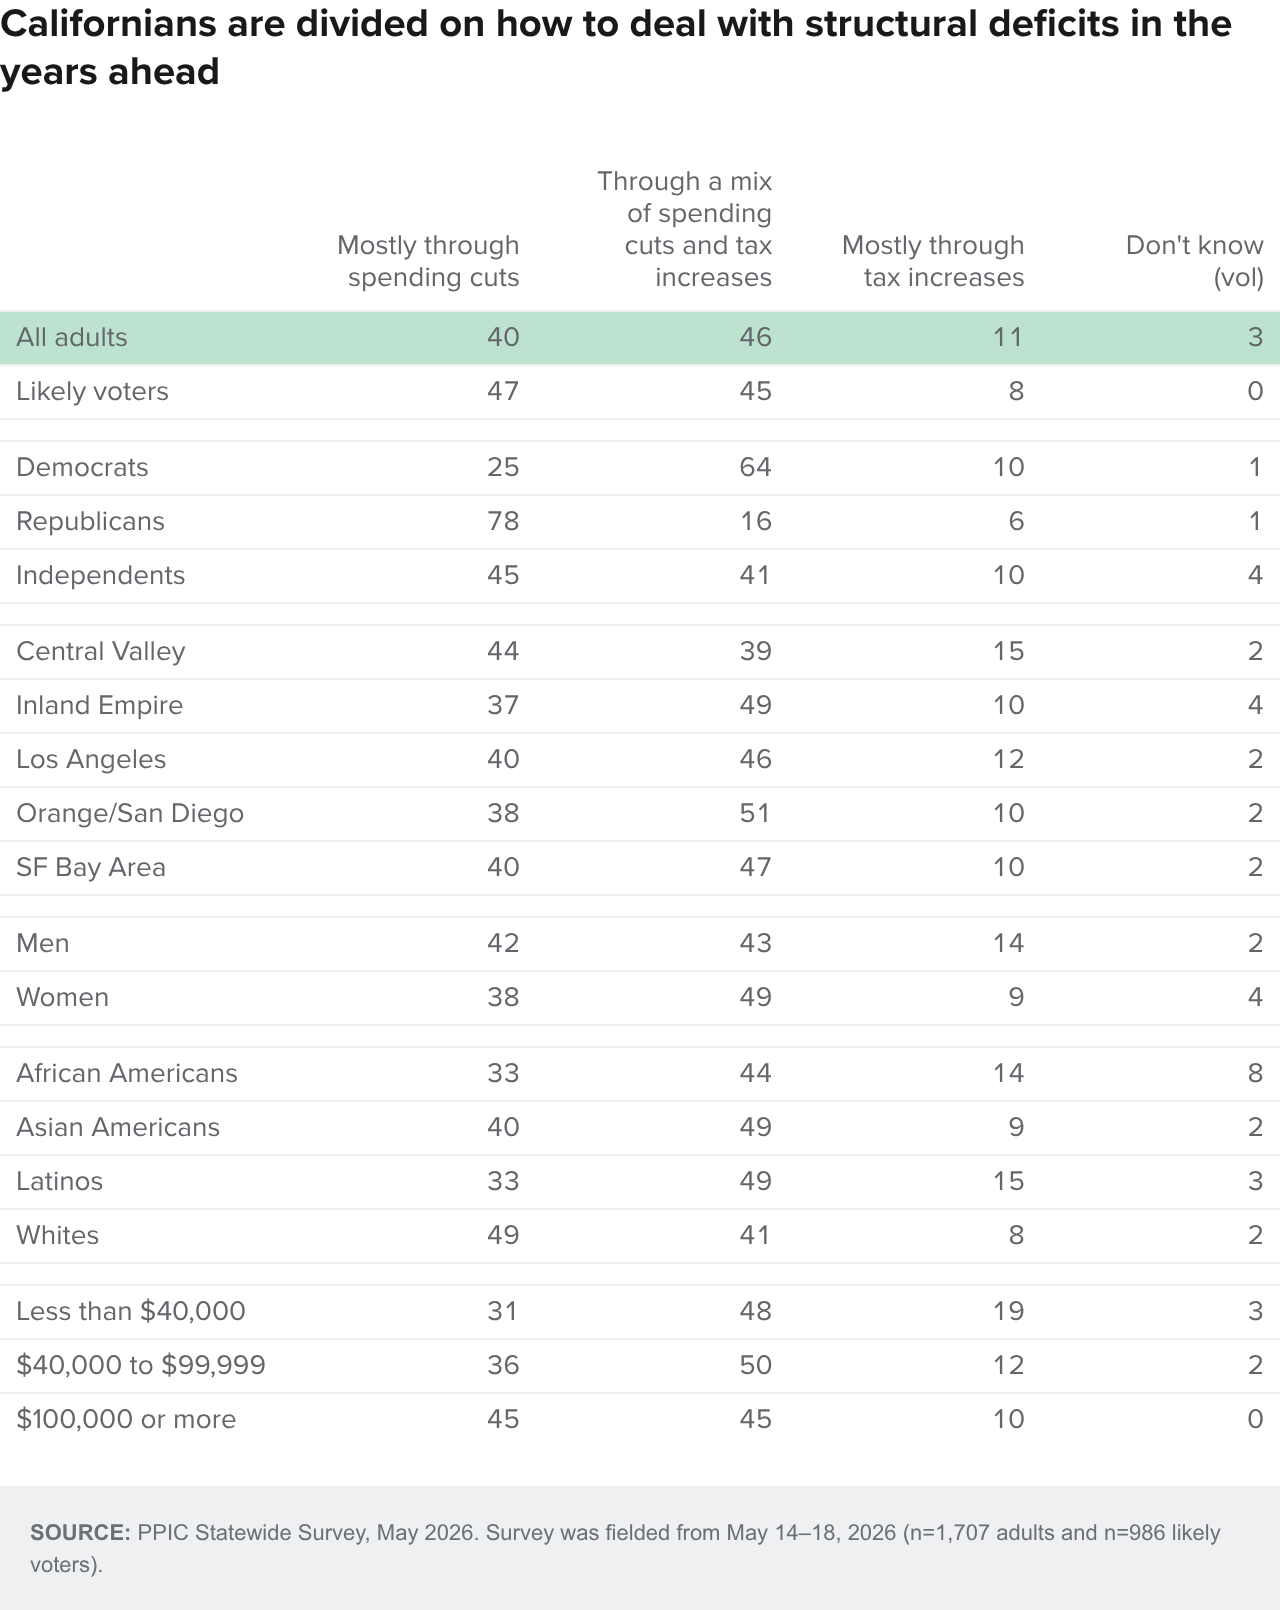
A recent Legislative Analyst’s Office (LAO) report noted that General Fund spending has grown by about $100 billion since 2019–20, reaching about $247 billion in the proposed 2026–27 budget; 70 percent of increased spending went to existing services, while 30 percent went to expanding or creating new services. Additionally, the LAO projects an ongoing state budget gap of $20 to $30 billion annually in the years ahead and advises that this balance of spending and revenue is not sustainable and will require difficult decisions. When asked how they would prefer to deal with these structural deficits, 46 percent of Californians prefer a mix of spending cuts and tax increases, while 40 percent say it should be addressed mostly through spending cuts. One in ten prefer to address deficits mostly through tax increases (11%). Likely voters are divided: 47 percent want to address the gap mostly through spending cuts and 45 percent prefer a mix of spending cuts and tax increases. Partisans are also divided: nearly eight in ten Republicans prefer spending cuts, and about two in three Democrats prefer a mix of cuts and taxes. When asked if they favor or oppose raising state taxes paid by some of the largest corporations to help reduce the gap between spending and revenues, 57 percent of Californians and 60 percent of likely voters are in favor.
State of the State
A majority of California adults (57%) and about half of likely voters (52%) believe that things in the state are generally headed in the wrong direction. Majorities across most partisan, regional, and demographic groups share this pessimistic outlook—the exceptions are college graduates (49%), residents of the San Francisco Bay Area (45%), and Democrats (32%). This dissatisfaction is also reflected in Californians’ views of the economy.
More than four in ten Californians (44%) identified the cost of living and the economy as the most important issue facing the state; the second most commonly chosen issue was housing costs and availability (14%). Economic anxiety has continued to grow in recent years; today, three in four Californians expect difficult economic times ahead for the state. About seven in ten or more across parties, regions, and demographic groups are pessimistic.

A third of Californians (35%) say they and their family are financially worse off than they were a year ago, while about half say they are about the same (51%) and 13 percent say they are better off. Views are similar among likely voters and across partisan groups. Financial strain is especially pronounced among lower-income residents: about half of Californians earning less than $40,000 annually (49%) say they are worse off financially, compared to just 27 percent of those earning $100,000 or more.
Six in ten Californians think that US military action in Iran will mostly negatively impact their own financial situation. Few say it will not have any impact (11%) or a positive impact (6%); about a quarter are unsure (23%). The shares expecting a mostly negative impact are particularly high among Democrats (79%), college graduates (68%), San Francisco Bay Area residents, Asian Americans, and those ages 18 to 34 (67% each).
A strong majority of Californians say recent increases in gas prices have affected their household’s finances a great deal (29%) or somewhat (36%), while about a quarter say not too much (24%) and one in ten say not at all (11%). About seven in ten residents in the Central Valley, Los Angeles, and the Inland Empire say gas prices have affected their financial situation at least somewhat, compared to fewer in Orange/San Diego and the San Francisco Bay Area. Six in ten or more across most demographic groups say this.
More than half of Californians report that overall recent price increases have caused financial hardship for themselves or their households, including about two in ten who describe the hardship as serious. African Americans (67%) and Latinos (65%) are much more likely than whites (47%) and Asian Americans (43%) to report hardship related to rising prices, and about four in ten African Americans (38%) and three in ten Latinos (27%) say it has caused serious hardship. About eight in ten residents earning under $40,000 and seven in ten residents earning $40,000–$99,999 report financial hardship, compared to a much smaller share than those earning $100,000 or more. Reports of hardship decrease as age and educational attainment increase.

About six in ten adults (59%) and likely voters (61%) are in favor of state and local governments making their own policies and taking actions separate from the federal government to protect the legal rights of undocumented immigrants in California. These shares have been similar since February 2025. Regarding federal immigration enforcement, more than four in ten are worried a lot (17%) or some (28%) that someone they know could be deported. A majority in Los Angeles (52%) express this concern, compared to less than half in other major regions. A majority of Latinos (57%) and half of African Americans (50%) share this worry, compared to about four in ten or fewer Asian Americans (39%) and whites (35%). Seven in ten noncitizens worry about deportation (36% a lot, 35% some).
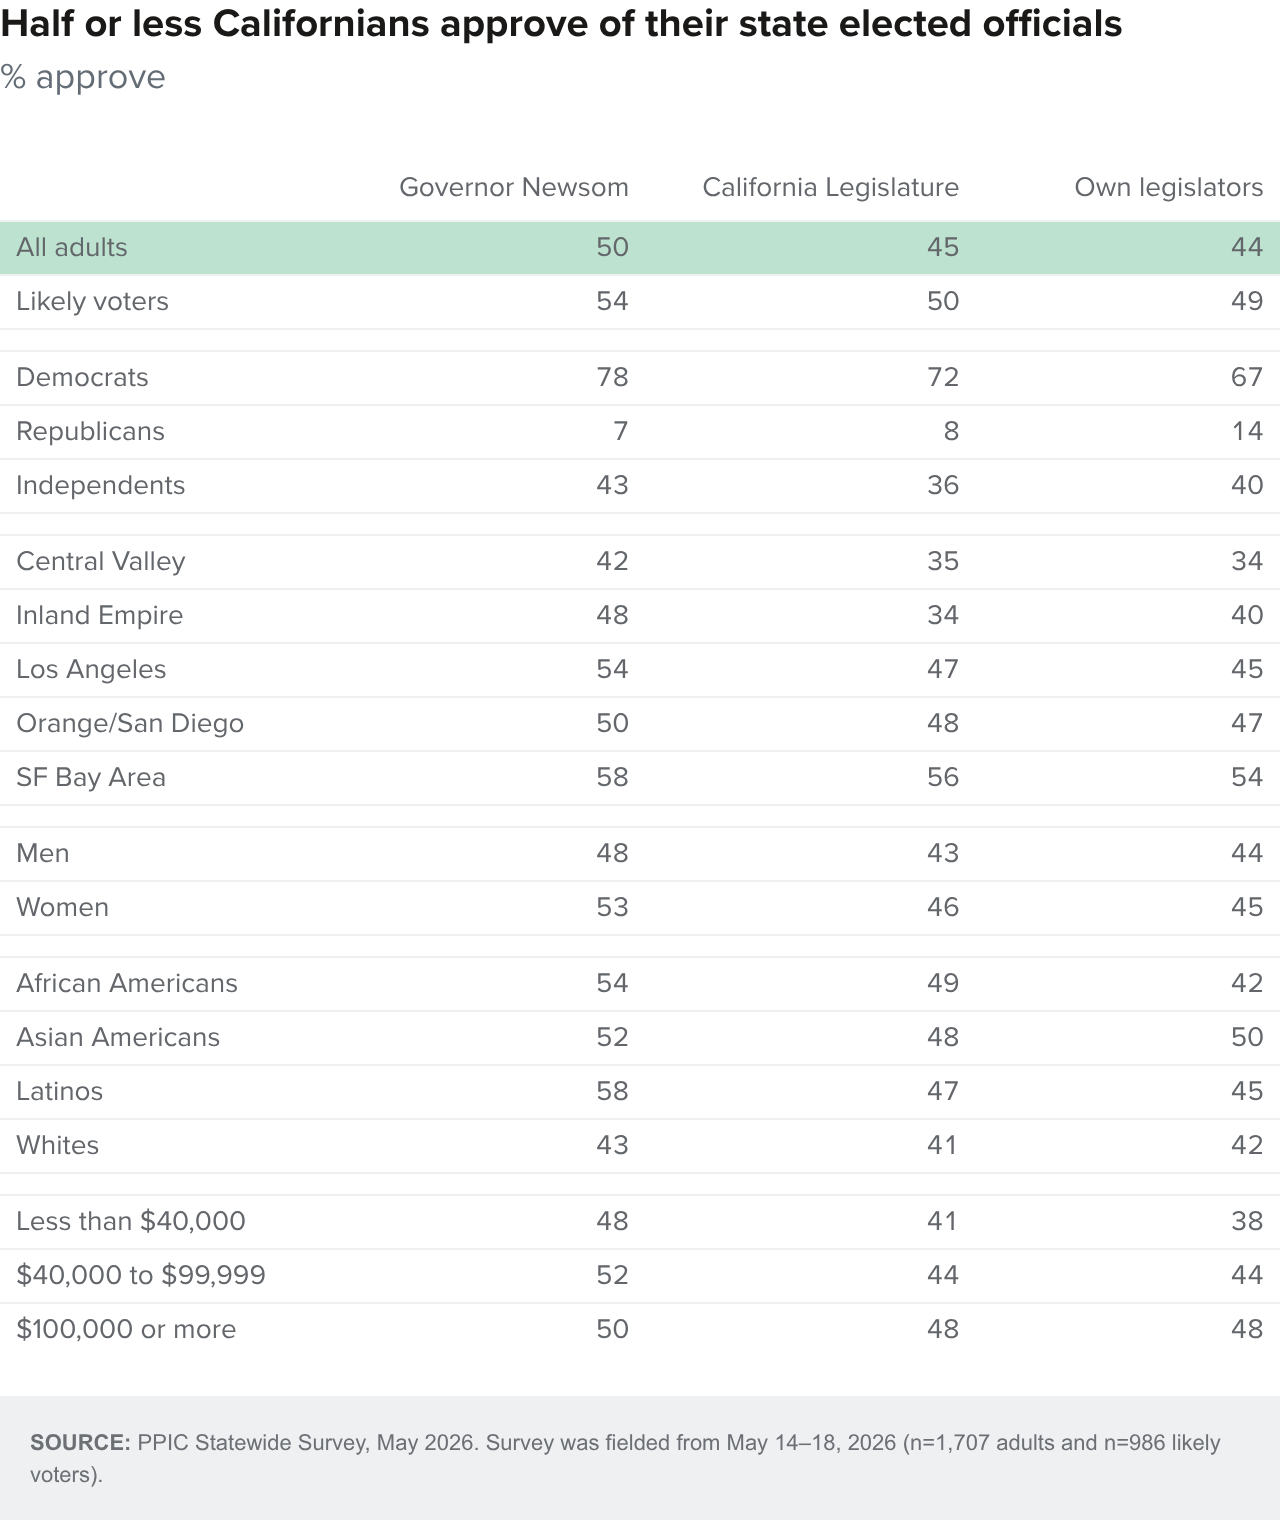
Half of adults and a majority of likely voters approve of the way Gavin Newsom is handling his job as governor. Approval is strongly divided along partisan lines: about eight in ten Democrats approve, while nine in ten Republicans and 54 percent of independents disapprove. San Francisco Bay Area residents are the most likely to approve, while Central Valley residents are the least likely. Approval varies across demographic groups.
Approval of the California State Legislature is somewhat lower. Forty-five percent of adults and half of likely voters approve of the job the state legislature is doing. Seven in ten Democrats approve, while nearly nine in ten Republicans and six in ten independents disapprove. Less than half across regions and demographic groups approve of the state legislature, except for San Francisco Bay Area residents (56%) and college graduates (54%).
Californians feel similarly toward the legislators representing their own state assembly and senate districts. Forty-four percent of adults and about half of likely voters approve. Across regions, fewer than half approve of their state legislators, with the exception of San Francisco Bay Area residents. Most Democrats approve, while most Republicans and half of independents disapprove. Less than half across demographic groups approve, with the exception of college graduates (55% approve) and Asian Americans (50% approve).
State of the Nation
Asked about the most important problem facing the US today, Californians are most likely to choose political extremism or threats to democracy (29%) or jobs and the economy (24%); one in ten choose war and foreign conflicts (10%) or immigration (10%). Likely voters most often see political extremism or threats to democracy (39%) and the economy (21%) as the biggest issue. Overall, the shares of adults choosing political extremism has declined somewhat since February (37%), while the share choosing the economy (18%) or war and foreign conflict (2%) has increased since then.
Eight in ten California adults (75% likely voters) say the US is headed in the wrong direction—the highest share since we began asking this question in 2003. Today, most Democrats (92%) and independents (82%) say wrong direction. Republicans are divided (50% wrong direction, 49% right direction)—it is notable that the share of Republicans saying the country is headed in the right direction has declined significantly from 64 percent in February. Overwhelming majorities across demographic groups say the country is headed in the wrong direction. Californians overall (80%) are far more likely to hold this pessimistic view than adults nationwide (65%), according to a May Reuters/Ipsos poll.

Californians are similarly pessimistic about the US economy: 78 percent of adults (74% likely voters) expect bad financial times over the next 12 months, the highest share since PPIC began asking this question in 2003. Today, most Democrats (92%) and independents (76%) expect bad times ahead, with Republicans somewhat divided (51% bad times, 48% good times). About three in four or more across demographic and regional groups expect bad financial times in the next year.
Most adults (77%) and likely voters (72%) oppose the US placing new tariffs on goods imported from other countries; the share opposing this is similar to last October 2025 (72%). Three in four adults and seven in ten likely voters disapprove of US military action against Iran. Most Democrats and independents disapprove, while about seven in ten Republicans approve. Six in ten or more across regions and demographic groups disapprove, and the share disapproving declines as age rises. California adults overall are more likely than adults nationwide (61%) to disapprove, according to a May Reuters/Ipsos Political Update poll.

With the US Supreme Court preparing to issue a ruling on the executive order ending birthright citizenship for children born in the US if neither parent is a citizen or lawful permanent resident, majorities of Californians oppose this policy (adults: 42% strongly, 17% somewhat; likely voters: 43% strongly, 14% somewhat). The overall share who oppose ending birthright citizenship is slightly lower than in February 2025 (51% strongly, 16% somewhat).
As US Immigration and Customs Enforcement (ICE) continues its operations across the country, seven in ten or more California adults (74%) and likely voters (70%) disapprove of the job that it is doing. Overall, seven in ten or more adults have disapproved since October 2025. Today, most Democrats and independents disapprove, while most Republicans approve of ICE. Six in ten or more across demographic and regional groups disapprove. Californians overall are far more likely to disapprove compared to adults nationwide (58%), according to a recent Fox News poll.
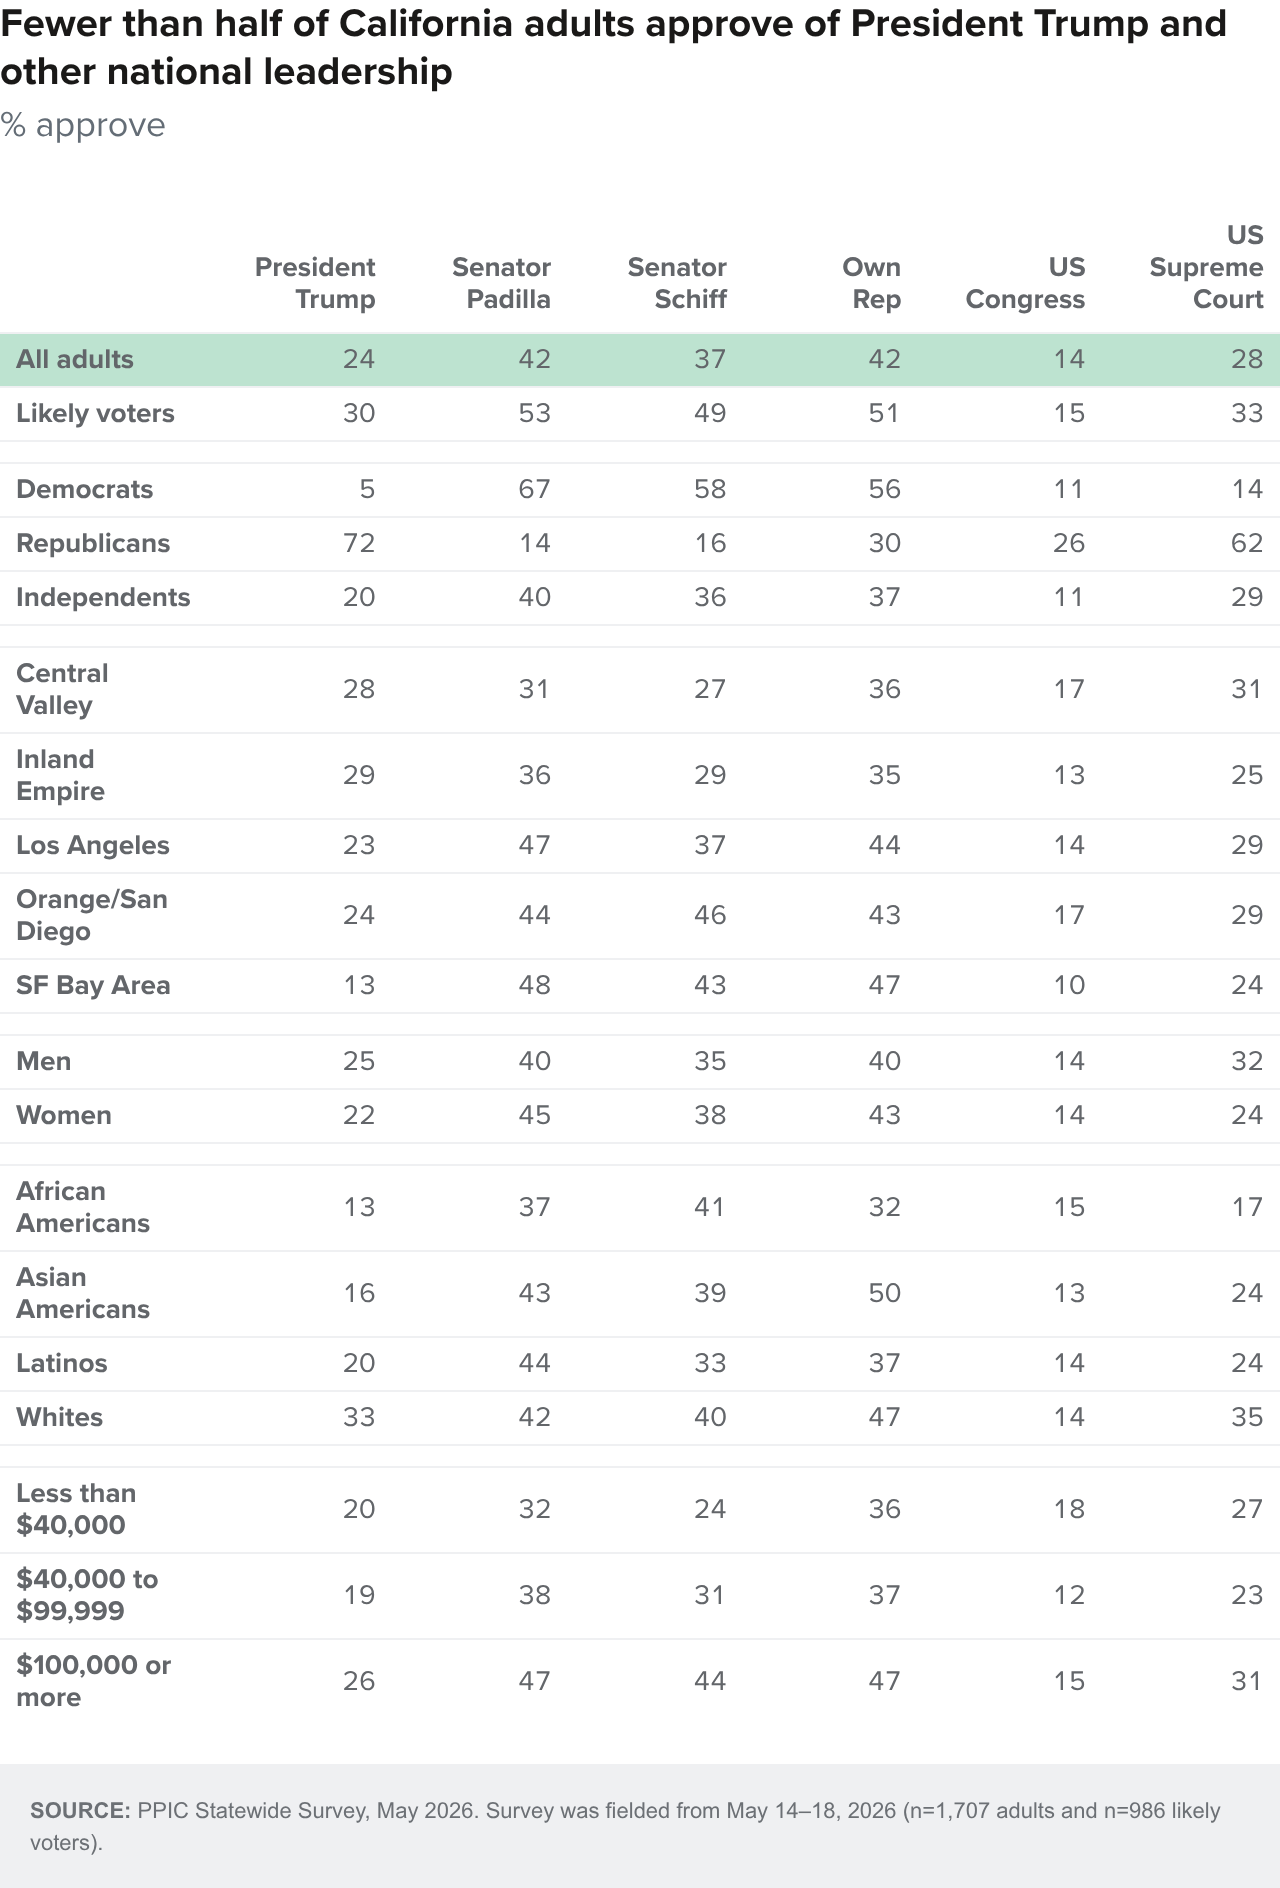
Twenty-four percent of California adults (30% likely voters) approve of the way Donald Trump is handling his job as president—a record low across both terms of his presidency. Overall, Californians are less likely to approve than adults nationwide (35%) according to the Reuters/Ipsos poll. Roughly four in ten (and about half of likely voters) approve of both Senator Alex Padilla and Senator Adam Schiff. Four in ten adults and a slim majority of likely voters approve of their own US House representative. Fewer than two in ten adults and likely voters approve of the way the US Congress is handling its job, while about three in ten approve of the way the US Supreme Court is handling its job.
Topics
2026 Election Political Landscape Statewide SurveyLearn More

How Californians Want to Fix the State Budget
How Election Reform Played Out in California’s June Primary
Latest PPIC Statewide Survey Sheds Light on Voter Preferences
Five Fast Takes on the Temperature of California Voters
California Voters and the Top-Two Primary