

Recent Publications


Blog Posts
View More →
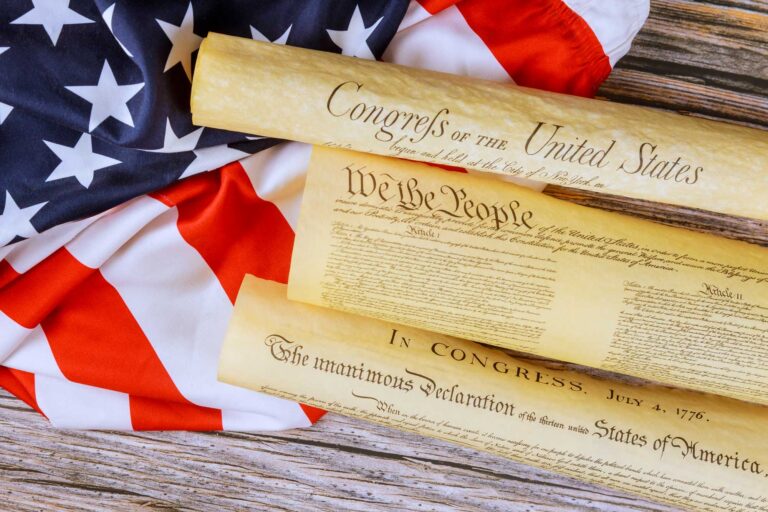
Our Nation’s Founding Documents Matter to Californians
Mark Baldassare, Tani Cantil-Sakauye

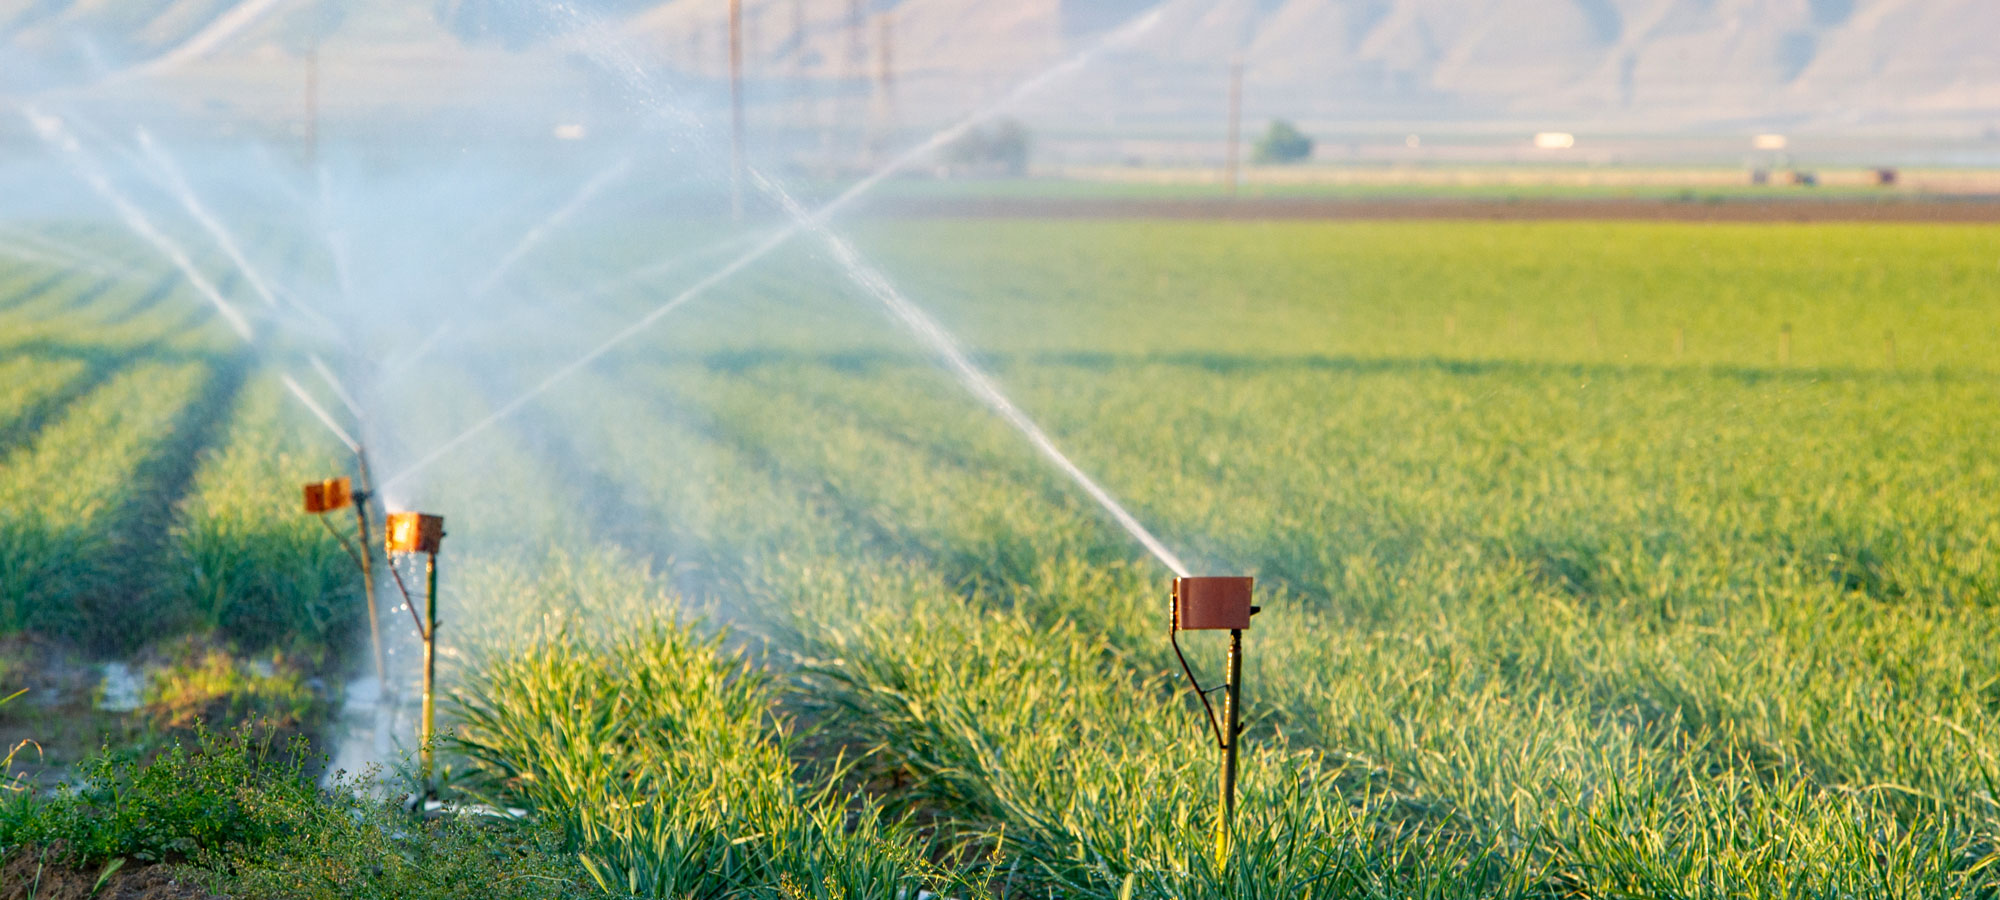
AI Predicts Natural River Flows in California. Could It Do More?
Annalise Blum

What Do International Students Contribute to California’s Public Universities?
Valerie Lundy-Wagner, Eric Assan

What California’s Next Governor Needs to Know about Housing
Eric McGhee, Marisol Cuellar Mejia, Hans Johnson
Events
View More →
The Future of Civic Engagement
July 23, 2026 · 12:00 pm - 1:15 pm
Fact Sheets
View More →
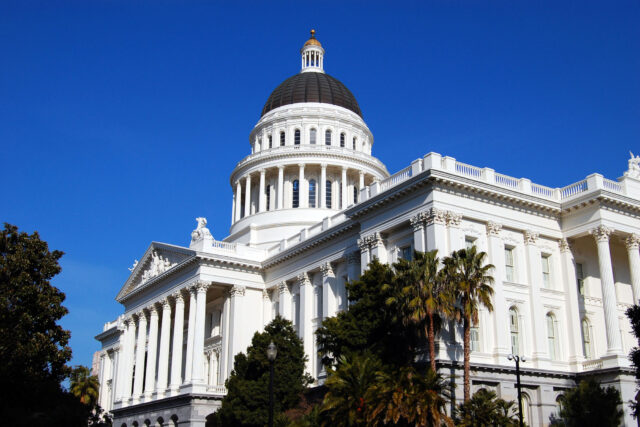
Higher Education Funding in California
Kevin Cook, Valerie Lundy-Wagner

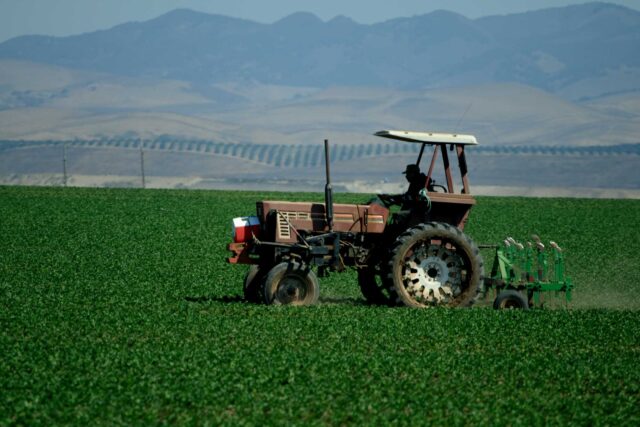
California’s Economy
Daniel Payares-Montoya, Sarah Bohn

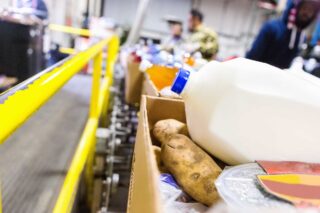
California’s Nutrition Safety Net
Tess Thorman, Patricia Malagon
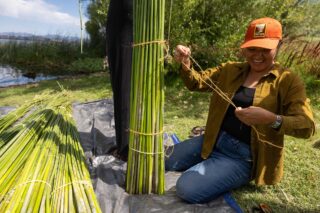
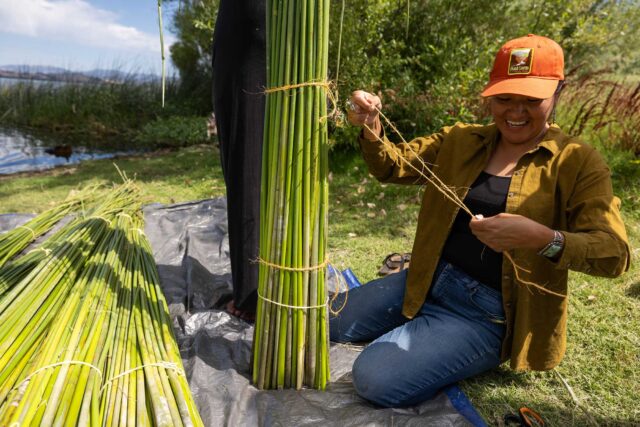
Tribal Water Rights and Water Use in California
Brian Gray, Letitia Grenier
Income Inequality in California
Tess Thorman, Daniel Payares-Montoya
